Method for detecting a target analyte

a target analyte and detection method technology, applied in the field of detecting a target analyte, can solve the problems of not easily portable and expensive, complicated system of Kretschmann, and inability to detect the system, so as to achieve the effect of increasing the fluorescence emitted

Inactive Publication Date: 2015-08-06
AGENCY FOR SCI TECH & RES
View PDF3 Cites 9 Cited by
  • Summary
  • Abstract
  • Description
  • Claims
  • Application Information

AI Technical Summary

Benefits of technology

[0008]According to a first aspect, there is provided a method for detecting the presence or absence of a target analyte in a sample comprising the steps of allowing an inorganic fluorescent particle to conjugate with a detection biomolecule that is bound to said target analyte, if present in said sample, said target analyte additionally being bound by a capture biomolecule immobilized on or with

Problems solved by technology

However, the Kretschmann configuration is a complicated system, not readily portable and expensive due to the need for the photomultiplier.
However, in these experiments, the plasmonic enhancement of the fluorescence dye emission is only feasible to achieve 10 to 100 times sensitivity enhancement, and they require a sensitive photodetector or PMT, or a confocal microscope for detection.
The inventors have found that such a system cannot be detected using a dark-field microscope and that there are difficulties in detecting the fluorescence label of the LSPR at a low clin

Method used


Image

  • Method for detecting a target analyte
  • Method for detecting a target analyte
  • Method for detecting a target analyte

Examples


example 1

Nanostructure Design, Fabrication and Characterization

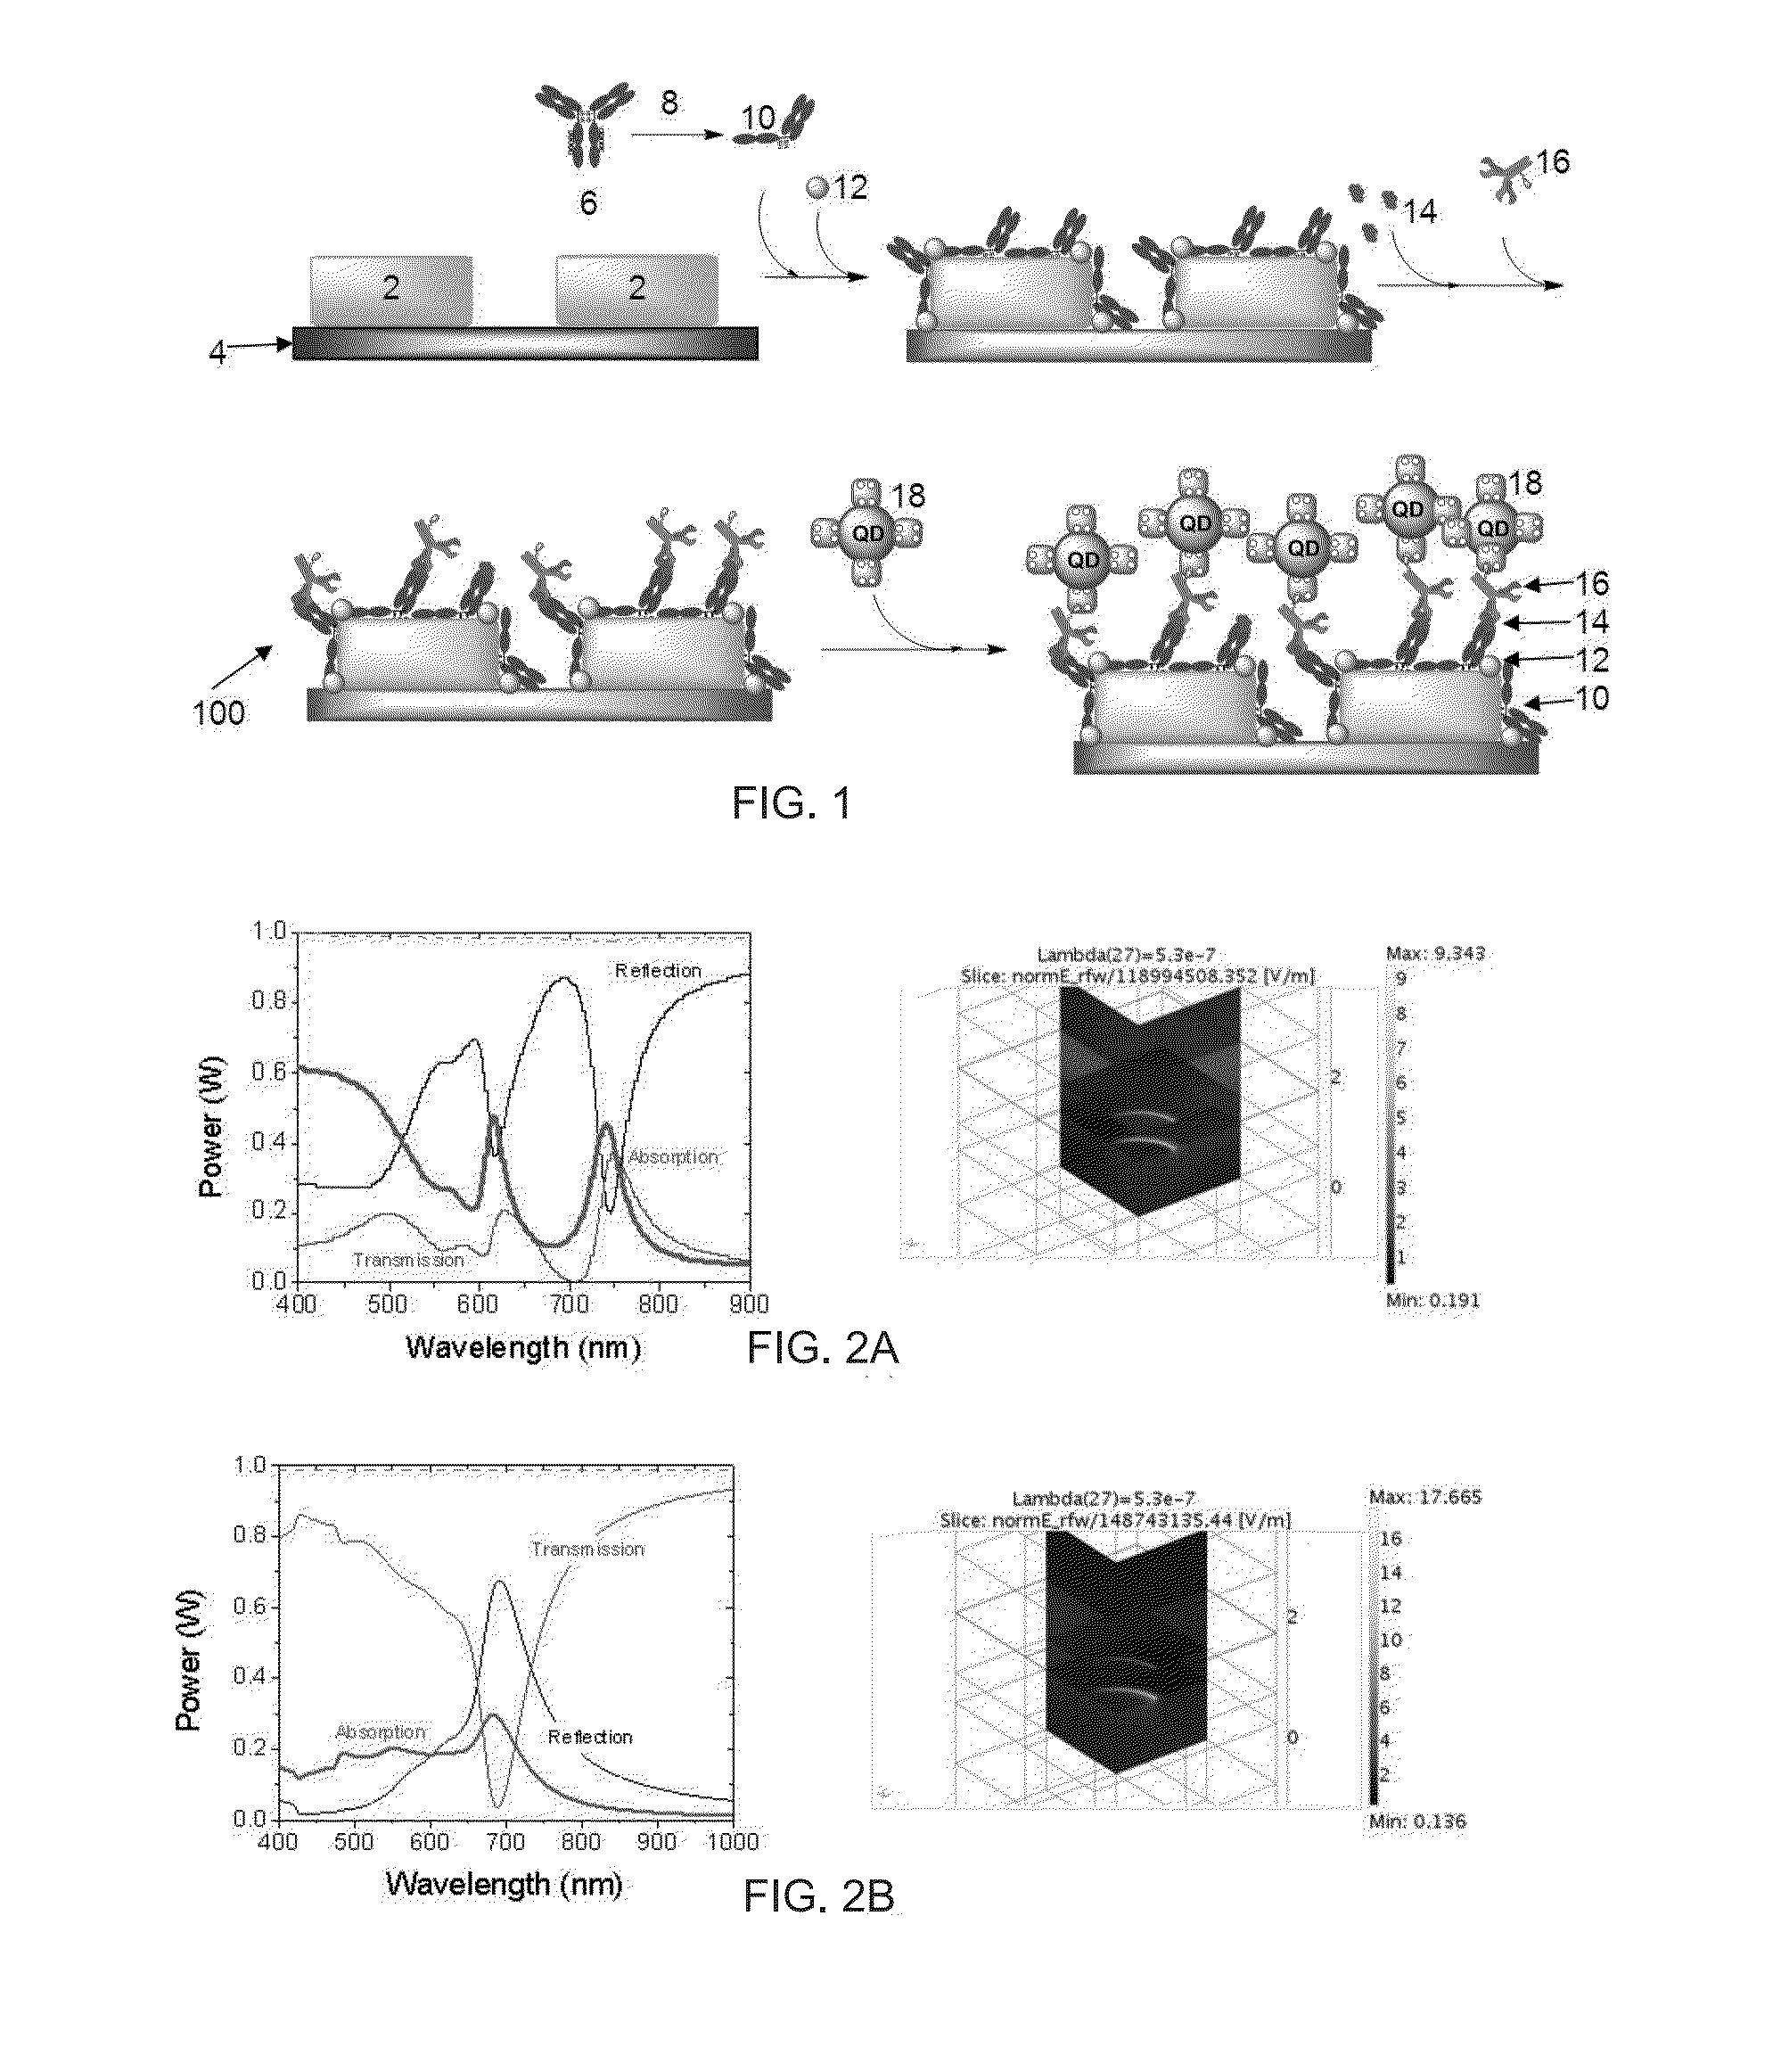
Nanostructure Design:

[0120]Here, two types of exemplary gold nanostructure arrays were designed and simulated through the COMSOL software, which is based on the finite element method to provide total plasmonic field information, including the reflection, transmission and absorption light intensity as well as the plasmonic near-field distribution around the gold nanostructures at each wavelength. The objective of the plasmonic nanostructure design is to maximize the quantum dot (QD) photoluminescence by the electromagnetic enhancement of the plasmonic resonances. For the gold nanostructure array, only a unit cell composed of one gold nanostructure embedded in a square whose length equals to the array pitch needs to be calculated. In the cases of round or square gold nanostructures, only a quarter of the unit cell was simulated due to the geometrical symmetry.

[0121]In the simulation, the frequency-dependent dielectric function of g...

example 2

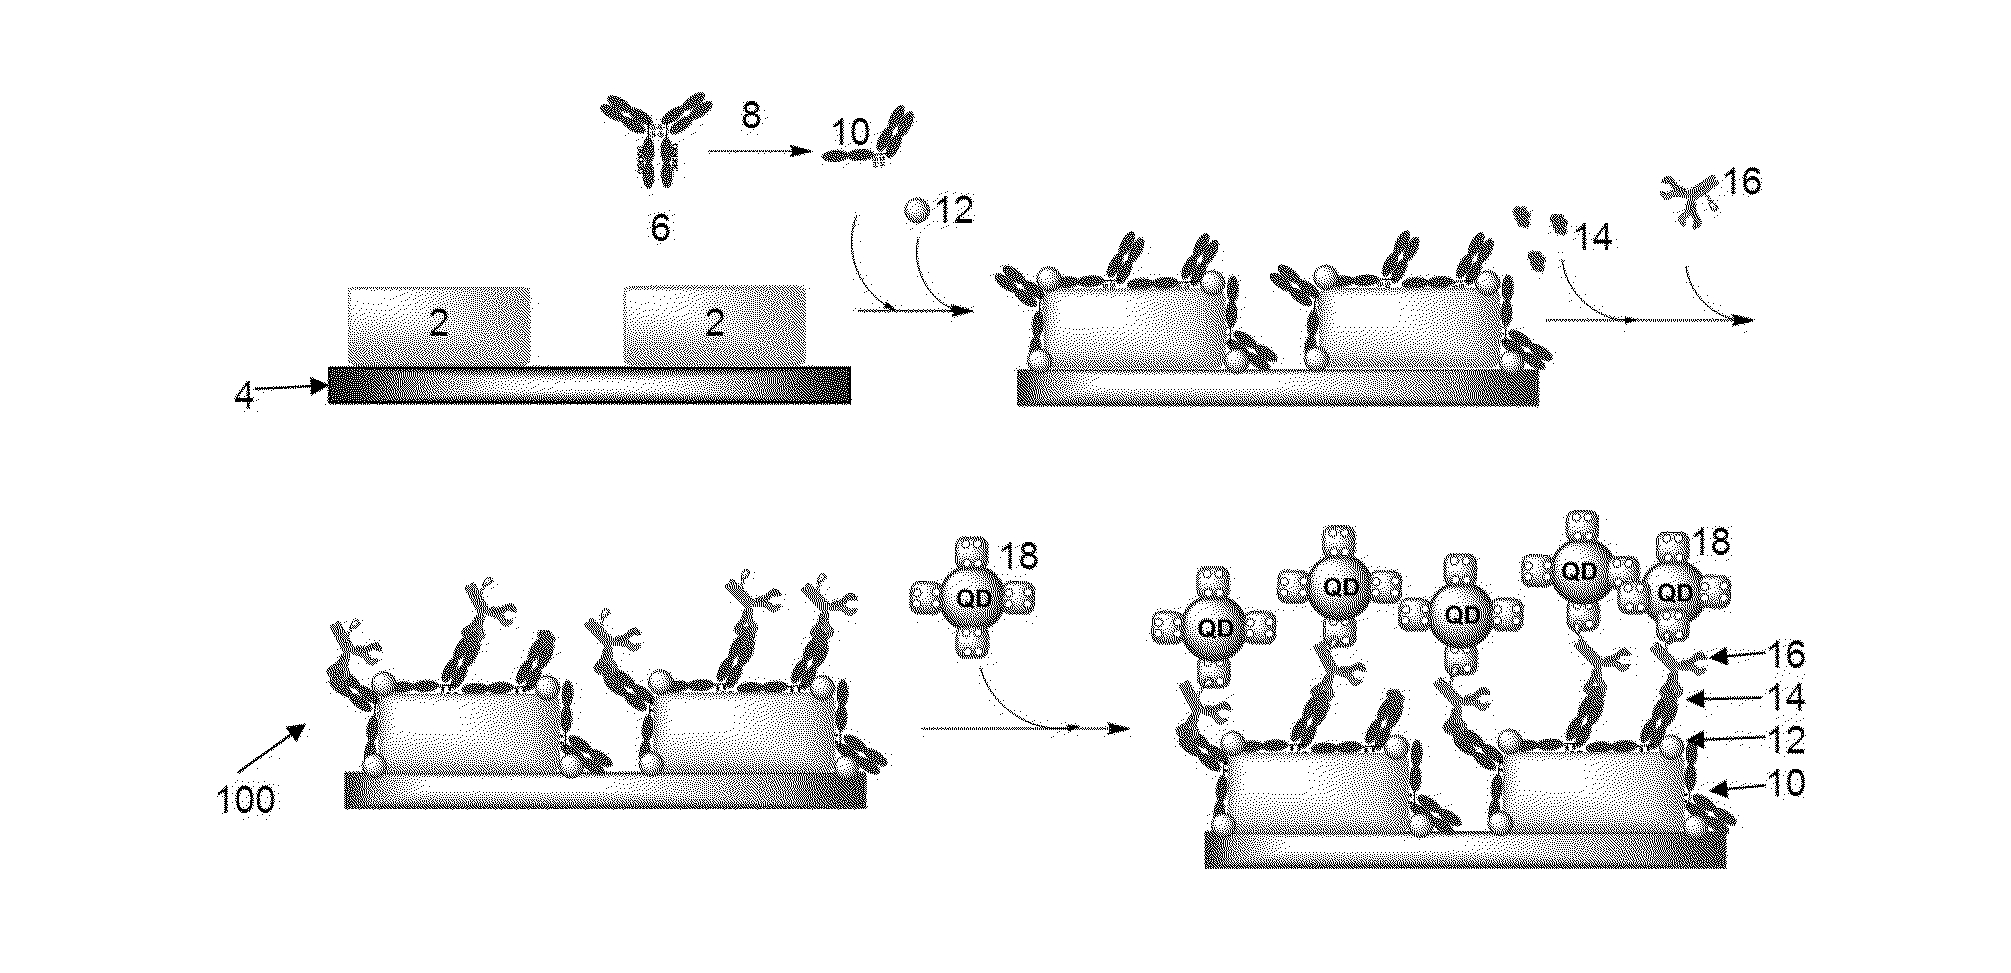
Biofunctionalization of Nanostructures

[0132]Materials: Purified human prostate specific antigen (PSA), PSA monoclonal capture antibody G3D6 (cAb) and PSA monoclonal detection antibody G1E3 (dAb) were purchased from BBI Solutions (of Sittingbourne, UK). Qdot® 655 streptavidin conjugate (QD-655) and NHS-PEG4-biotin were purchased from Life Technologies (of Singapore). BSA was purchased from Sigma-Aldrich (of Singapore).

[0133]HEPES buffer (10 mM HEPES, 150 mM NaCl, prepared) was used as dilution buffer for PSA antibody immobilization; HBS buffer (HEPES, with 3.4 mM EDTA, 0.05% P20) was used as binding buffer for PSA detection.

Reduction of Capture Anti-PSA (cAb) with TCEP:

[0134]TCEP solution was prepared at 50 mM (2.5 mg dissolved in 174 μL of water), and diluted to 250 μM. 5 μL of the diluted TCEP solution was added to 50 μL of the PSA antibody in PBS (1.26 mg / ml, 8.4 μM) and incubated at room temperature for 30 minutes. After reaction, the mixture was purified by G25 column. The purif...

example 3

Bioassay Performance

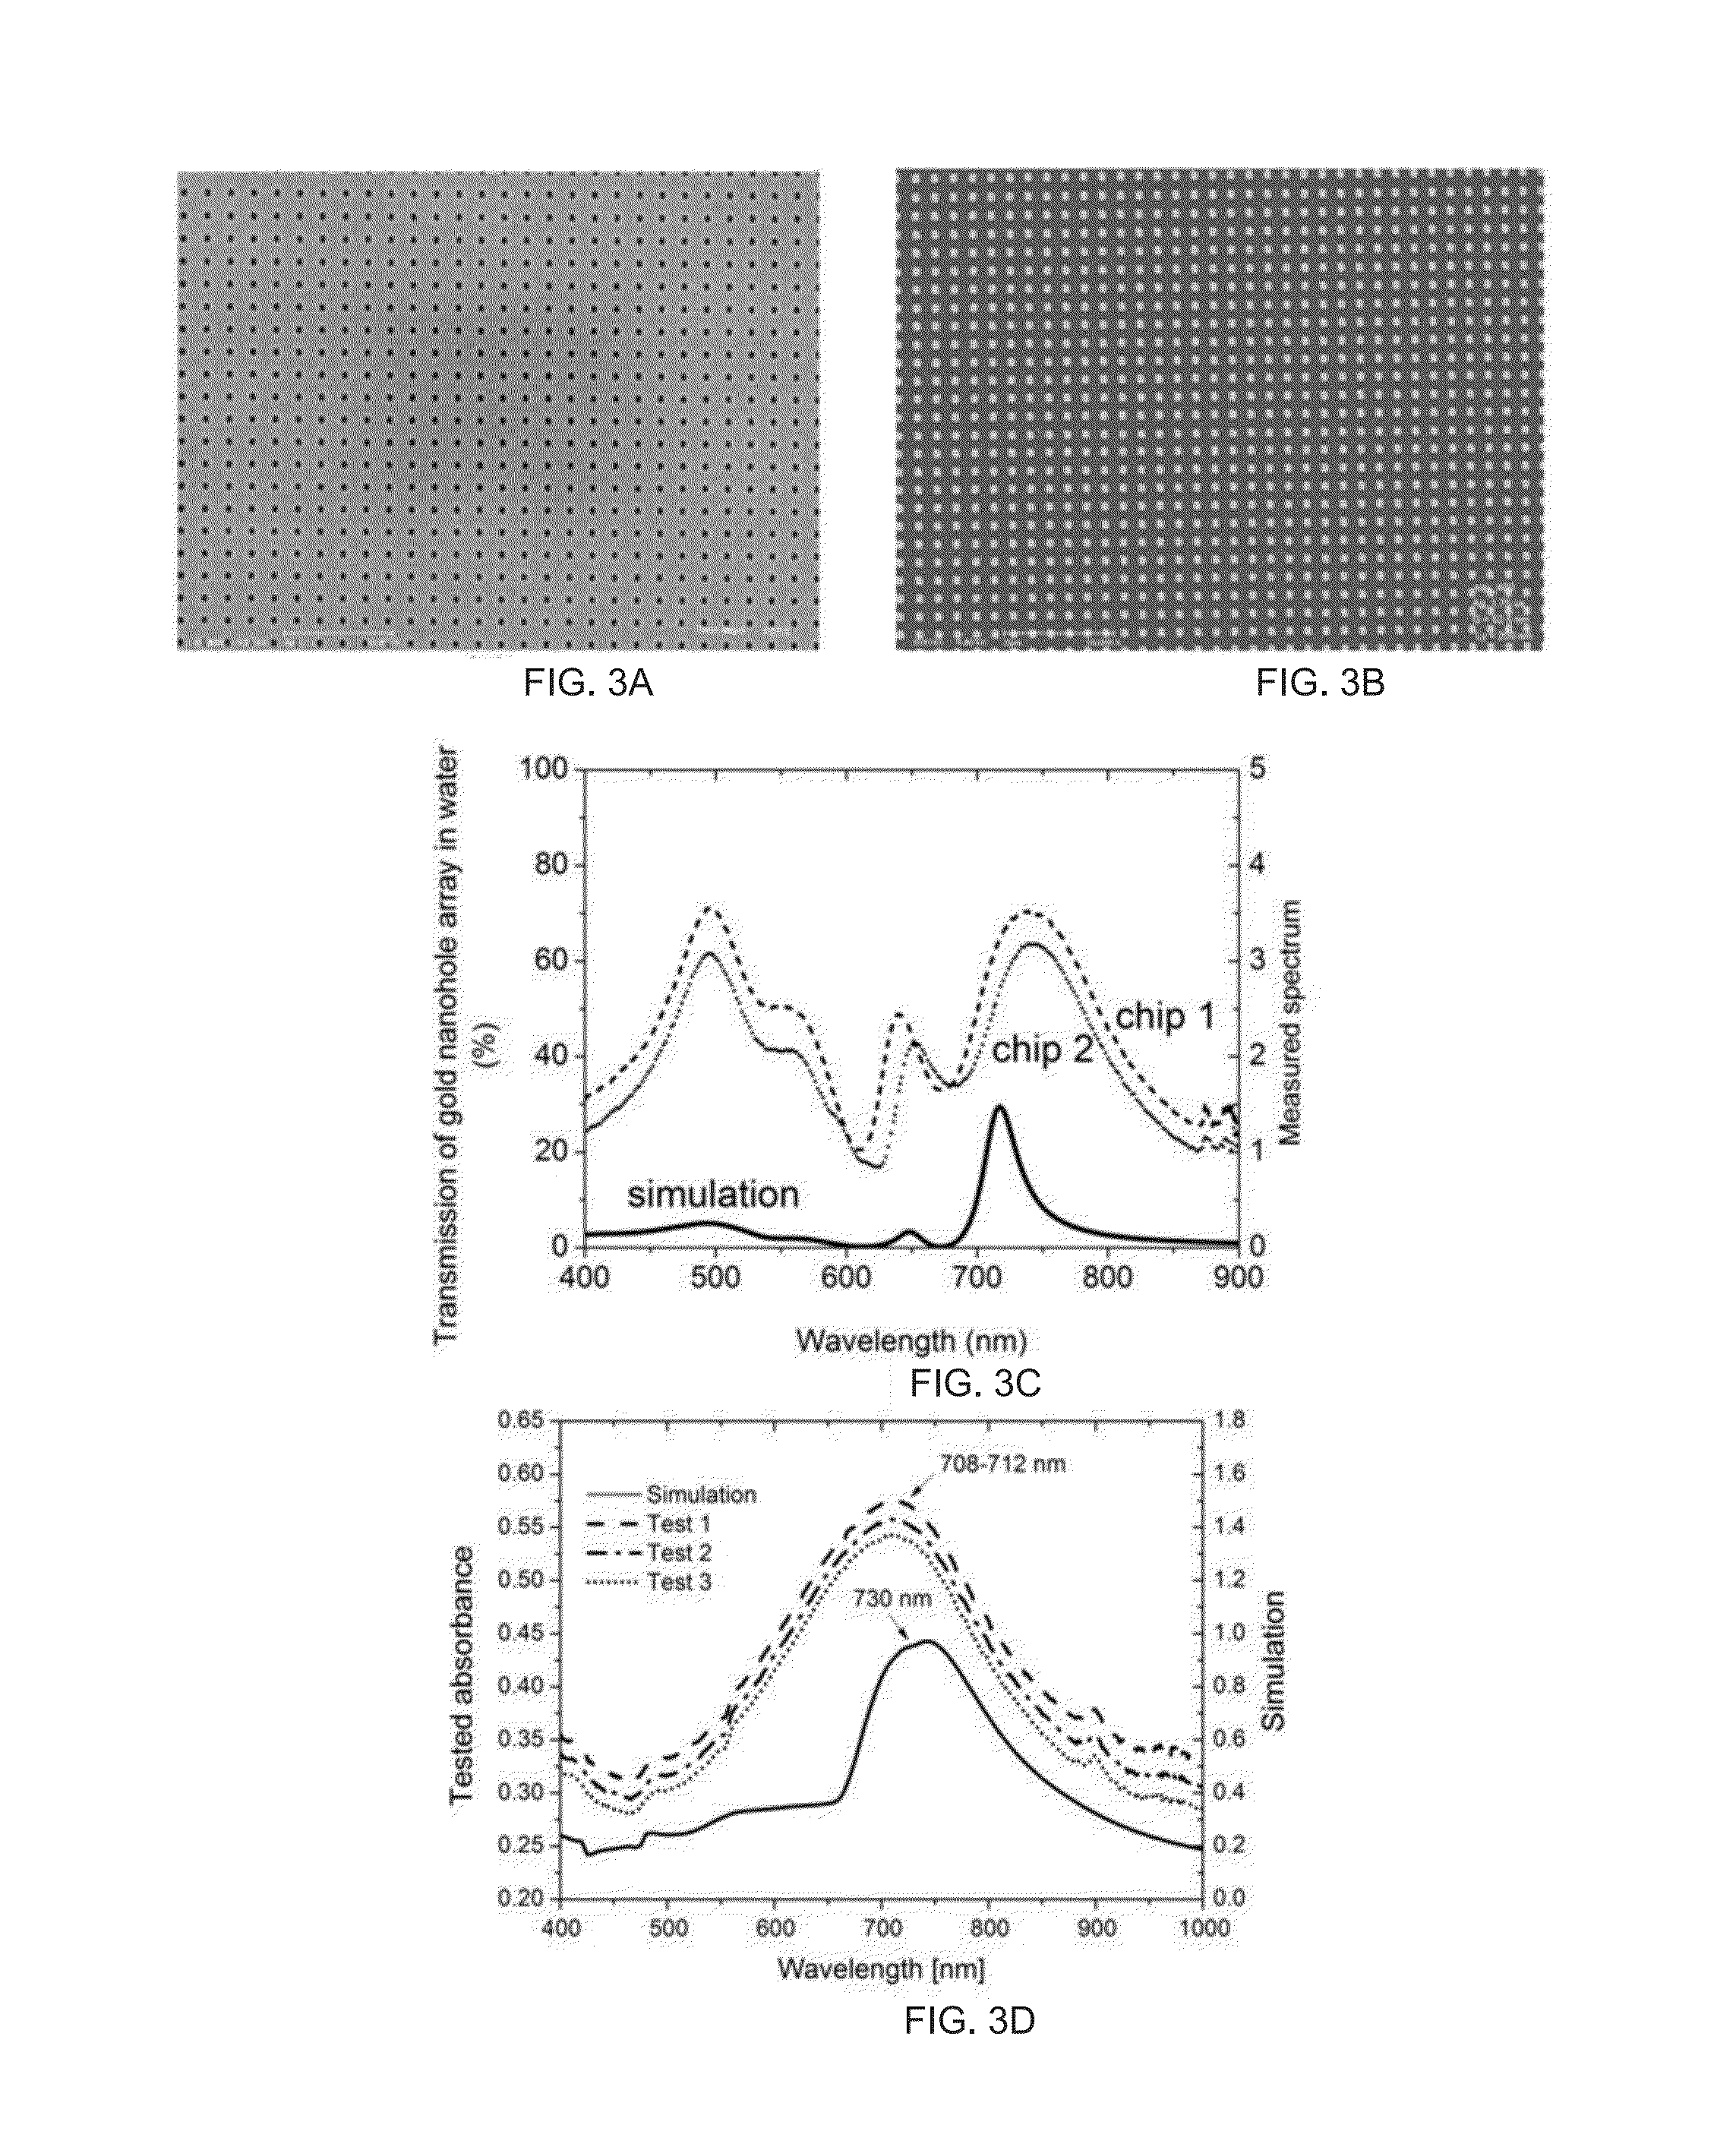
Gold Nanohole Array:

[0148]As shown in the typical fluorescence images of gold nanohole array with quantum dot bioassay in FIGS. 7(a) and 7(b) (for 100 ms of fluorescence integration time) and FIG. 8 (for 20 ms of the integration time), the inside gold nanohole area showed much stronger fluorescence emission than the outside gold film, due to the plasmonic enhancement provided by the gold nanoholes. The fluorescence difference between outside and inside reduced with the PSA concentration reduction. As shown in FIGS. 8(a) and 8(b), 100 ng / ml of PSA induced fluorescence showed significant difference between gold nanohole area and its outside. When the PSA concentration reached 1 ng / ml (FIG. 8(d)), the fluorescence induced by quantum dots was hard to be discerned. In the control experiment (a gold nanohole array chip but with no PSA added in the sandwich assay), the image was totally dark, which means very low non-specific binding in this quantum dot bioassay.

[0149]I...


PUM


Abstract

There is method for detecting the presence or absence of a target analyte in a sample comprising the steps of: allowing an inorganic fluorescent particle to conjugate with a detection biomolecule that is bound to said target analyte, if present in said sample, said target analyte additionally being bound by a capture biomolecule immobilized on or within a nanostructure; and detecting the fluorescence emitted by said inorganic fluorescent particle, said nanostructure being capable of generating a surface plasmon resonance effect when excited by a light source to substantially increase the fluorescence emitted by said inorganic fluorescent particle, wherein the detected fluorescence indicates the presence of said target analyte in said sample.

Description

CLAIM OF PRIORITY[0001]This application claims the benefit of priority of Singapore Patent Application Serial No. 2014008098, filed on Feb. 4, 2014, the benefit of priority of which is claimed hereby, and which is incorporated by reference herein in its entirety.TECHNICAL FIELD[0002]The present invention generally relates to a method for detecting the presence or absence of a target analyte in a sample. The present invention also relates to a kit for detecting the presence or absence of a target analyte in a sample.BACKGROUND ART[0003]In the field of medical diagnosis, many biomarkers of interest are present in body samples at low concentrations and require label amplifications such as radioluminescence, photoluminescence, gold or polymer microparticles or nanoparticles for detection. With the current medical diagnostic trends of ensuring that most of the population are covered by health screening, reducing medical costs, serving the health-care needs of patients and saving lives in...

Claims


Application Information

Patent Timeline
IPC IPC(8): G01N33/543G01N21/65G01N33/58G01N33/553
CPCG01N33/54386G01N33/582G01N21/658G01N33/553G01N21/648G01N33/588
Inventor SONG, HONG YANWONG, TEN ITSADOVOY, ANTON VALENTINOVICHZHOU, XIAODONGBAI, PINGWU, LIN
Owner AGENCY FOR SCI TECH & RES
Why Eureka
Try Eureka