Plasma Spectrochemical Analysis Method and Plasma Spectrochemical Analyzer

a spectrochemical analysis and plasma technology, applied in the field of plasma spectrochemical analysis methods and plasma spectrochemical analyzers, can solve the problems of inability to measure, low analytical sensitivity, and contamination of samples with other substances, and achieve the effect of easy analysis, high analytical sensitivity, and easy analysis of samples

Active Publication Date: 2016-07-14
ARKRAY INC
View PDF9 Cites 24 Cited by
  • Summary
  • Abstract
  • Description
  • Claims
  • Application Information

AI Technical Summary

Benefits of technology

[0014]The plasma spectrochemical analysis method of the present invention can be carried out easily and can achieve high analytical sensitivity. Thus, according to the plasma spectrochemical analysis method of the present invention, it is possible to analyze a sample easily with high sensitivity, without performing a pretreatment of the sample, for example.

Problems solved by technology

However, the method disclosed in Patent Document 1 has a problem in that, without a proper pretreatment of a sample, contamination of the sample with other substances may affect the result of analysis.
The methods disclosed in Patent Documents 2 and 3 have a problem in that, when a liquid sample with impurities is used or when a foreign substance(s) or the like is mixed in the liquid sample during a pretreatment for reducing the amount of the liquid sample, the narrow portion is clogged with the impurities or foreign substance(s), thus making measurement impossible.
The methods disclosed in Patent Documents 4 and 5 have a problem in that they are only able to achieve low analytical sensitivity.

Method used


Image

  • Plasma Spectrochemical Analysis Method and Plasma Spectrochemical Analyzer
  • Plasma Spectrochemical Analysis Method and Plasma Spectrochemical Analyzer
  • Plasma Spectrochemical Analysis Method and Plasma Spectrochemical Analyzer

Examples


example 1

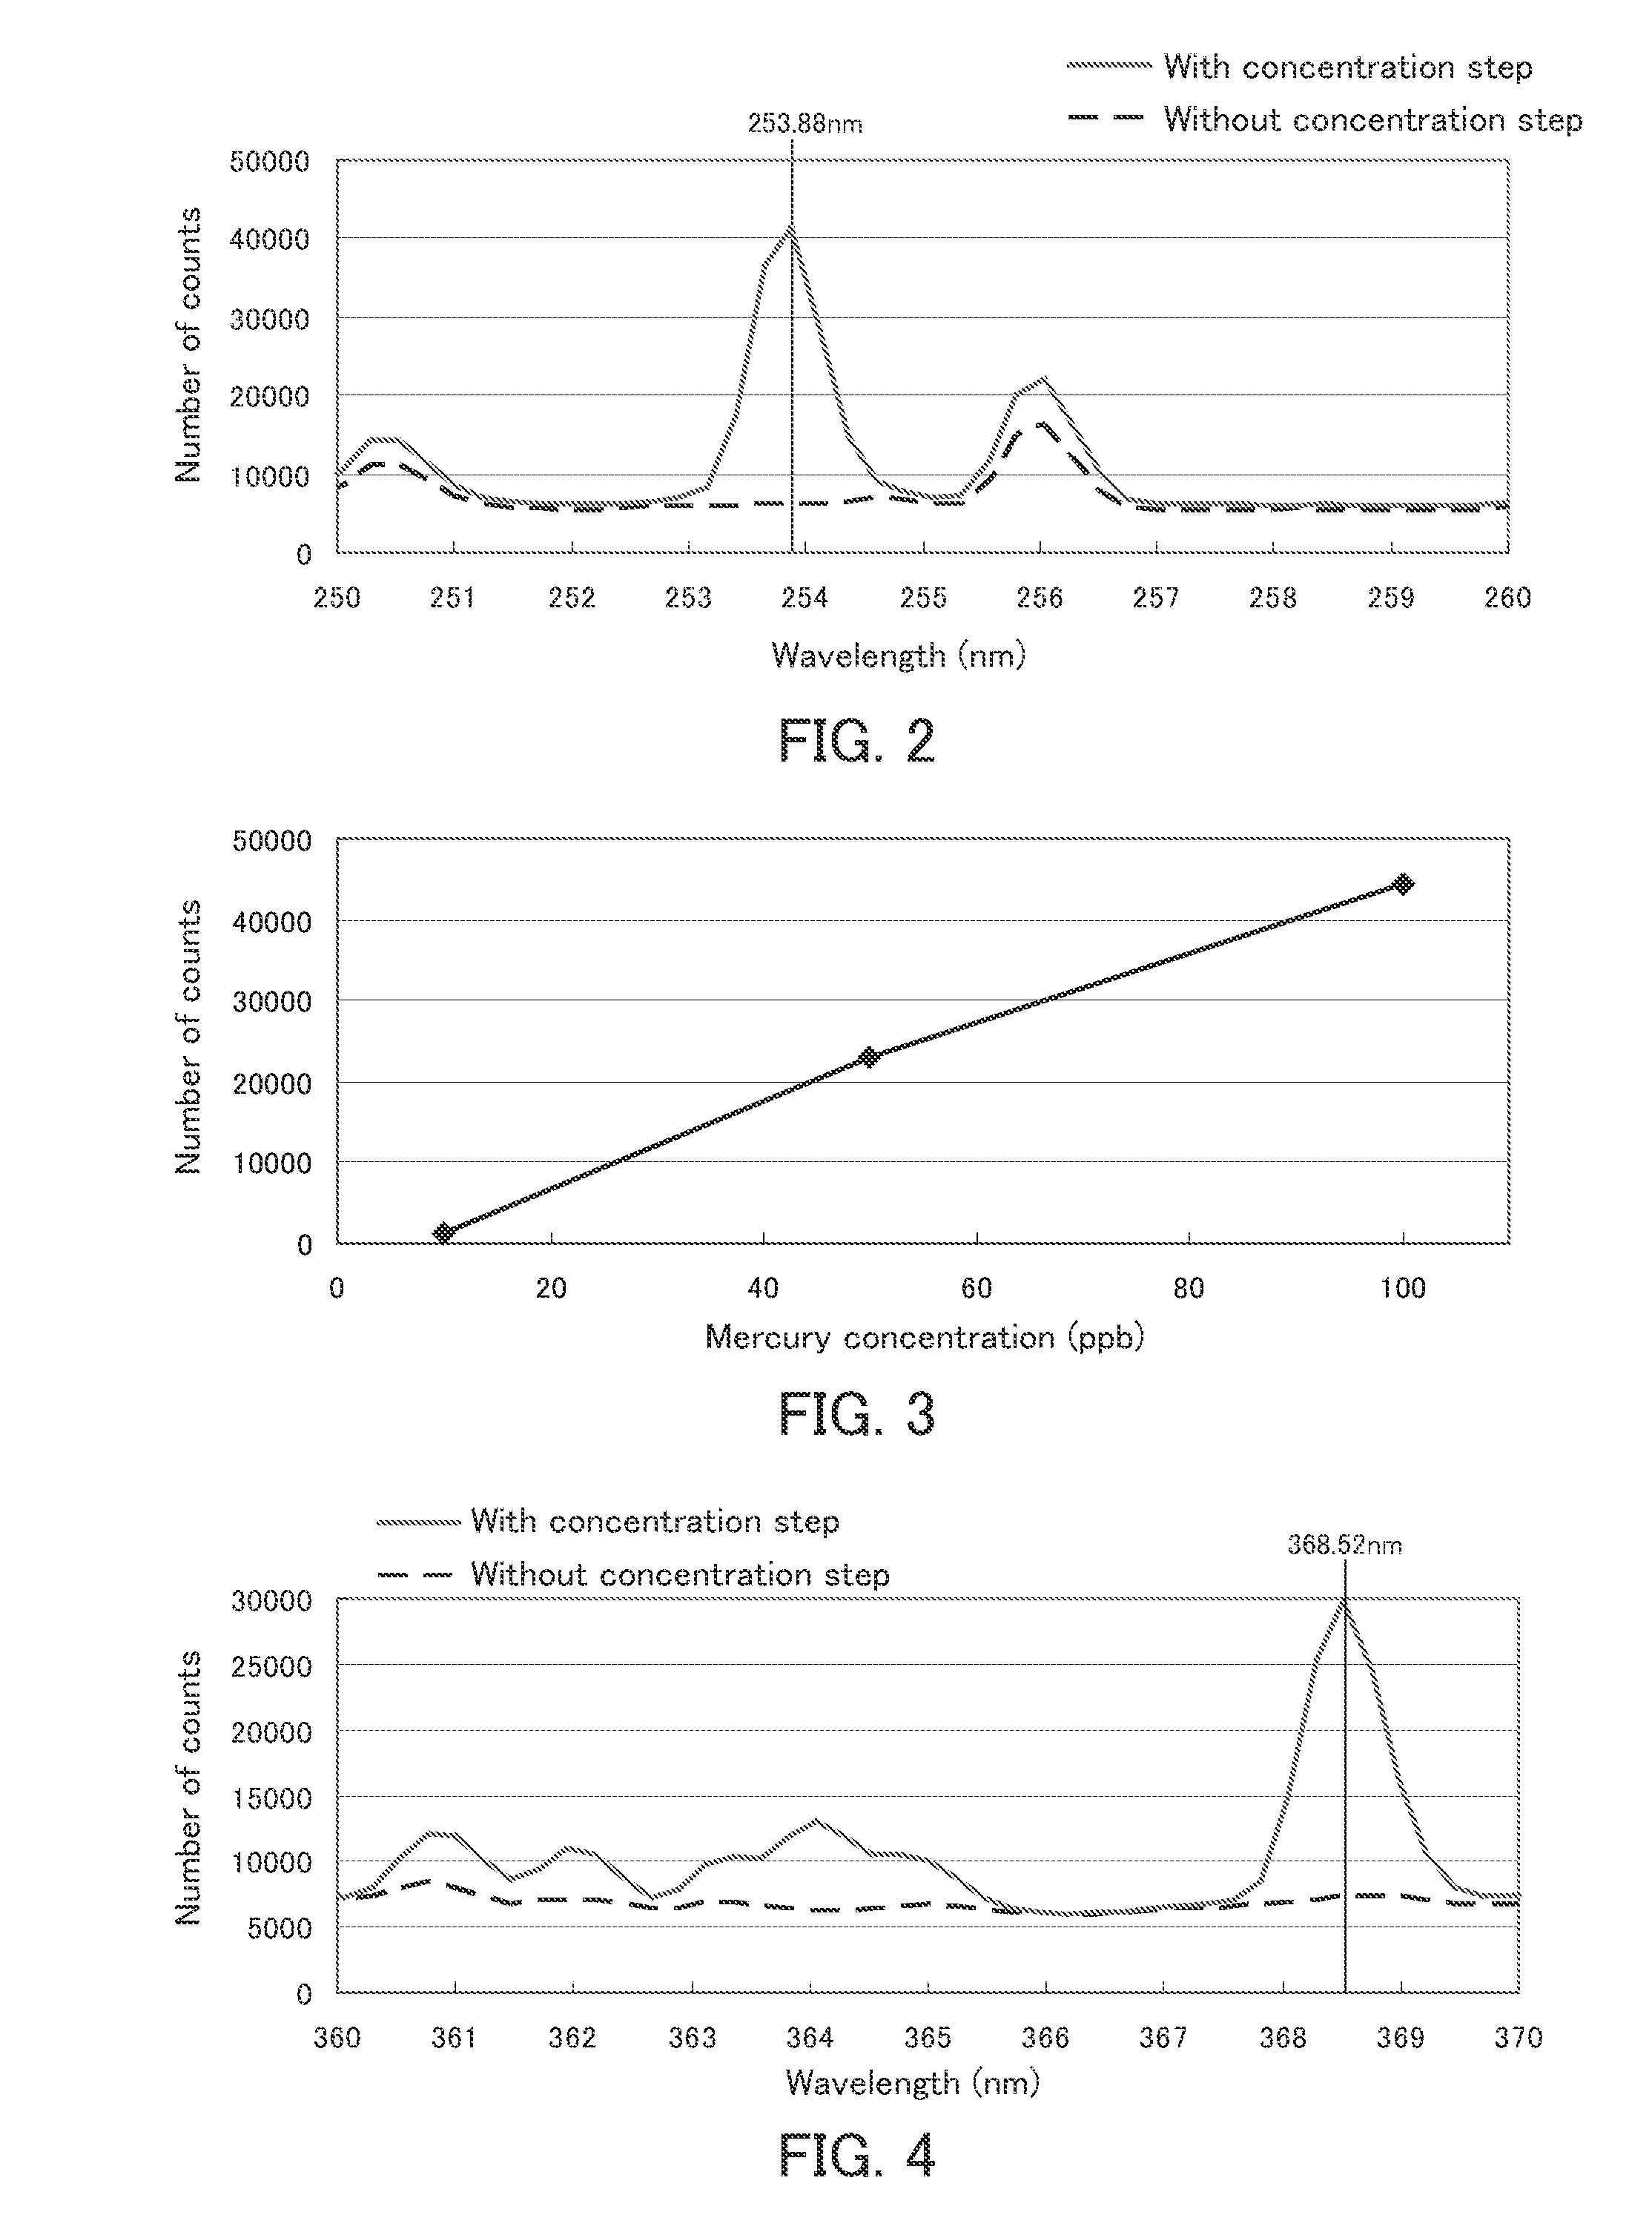
[0060]The present example examined whether the analysis method of the present invention can analyze mercury with high sensitivity.

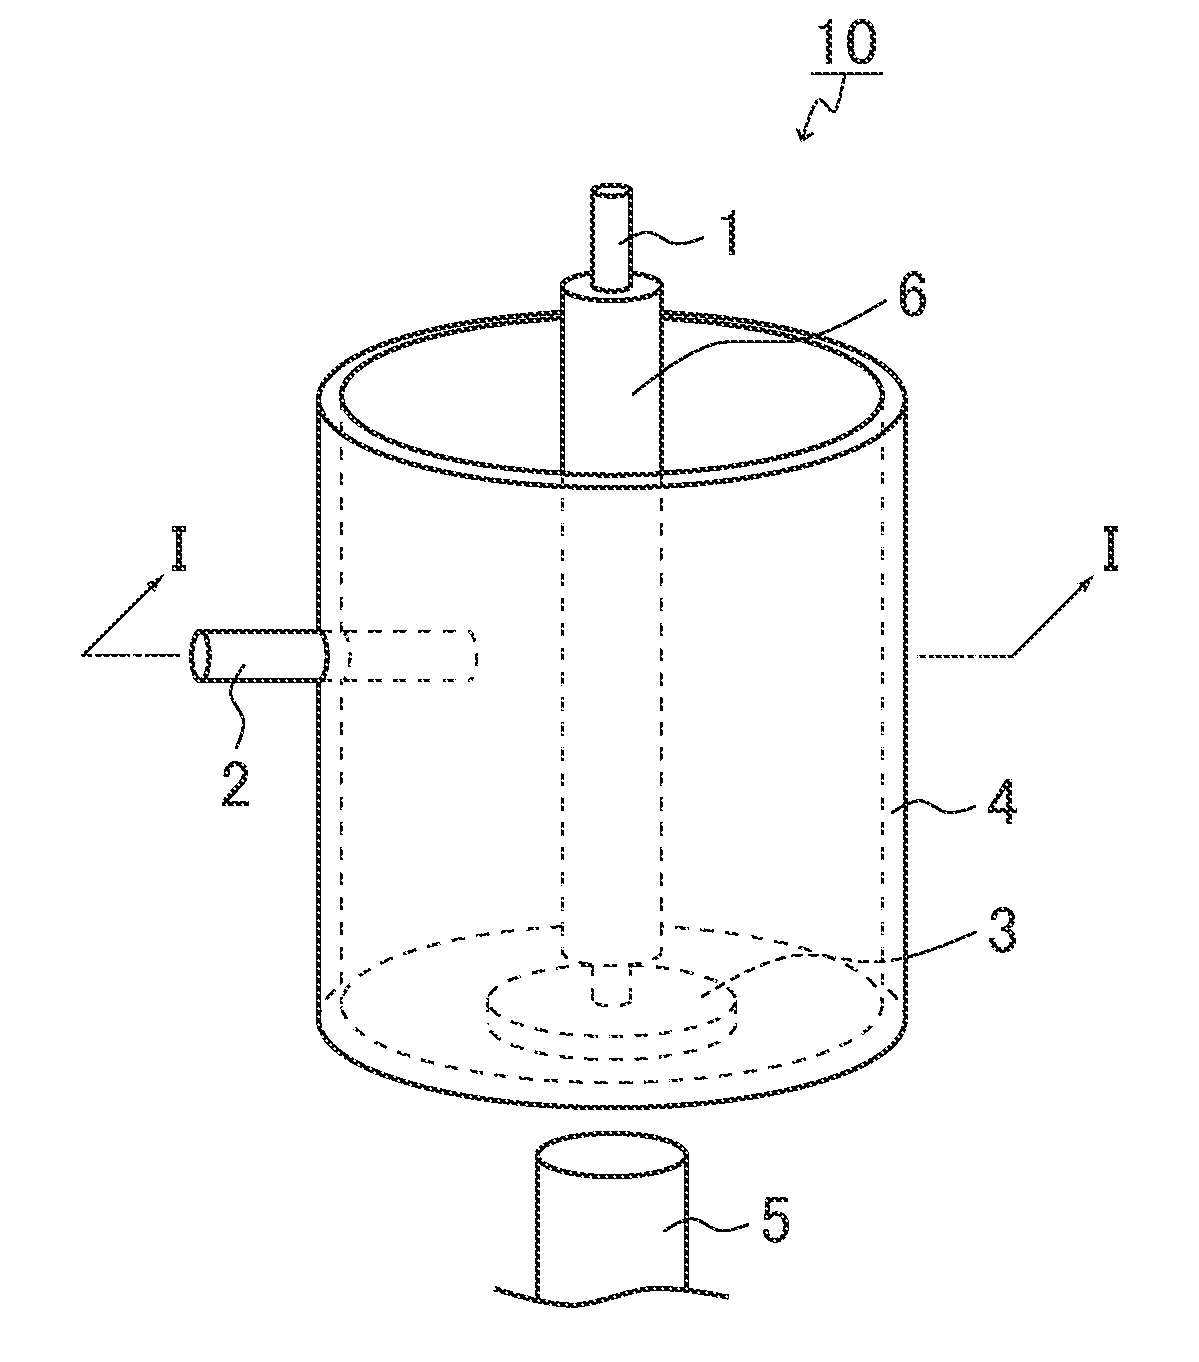
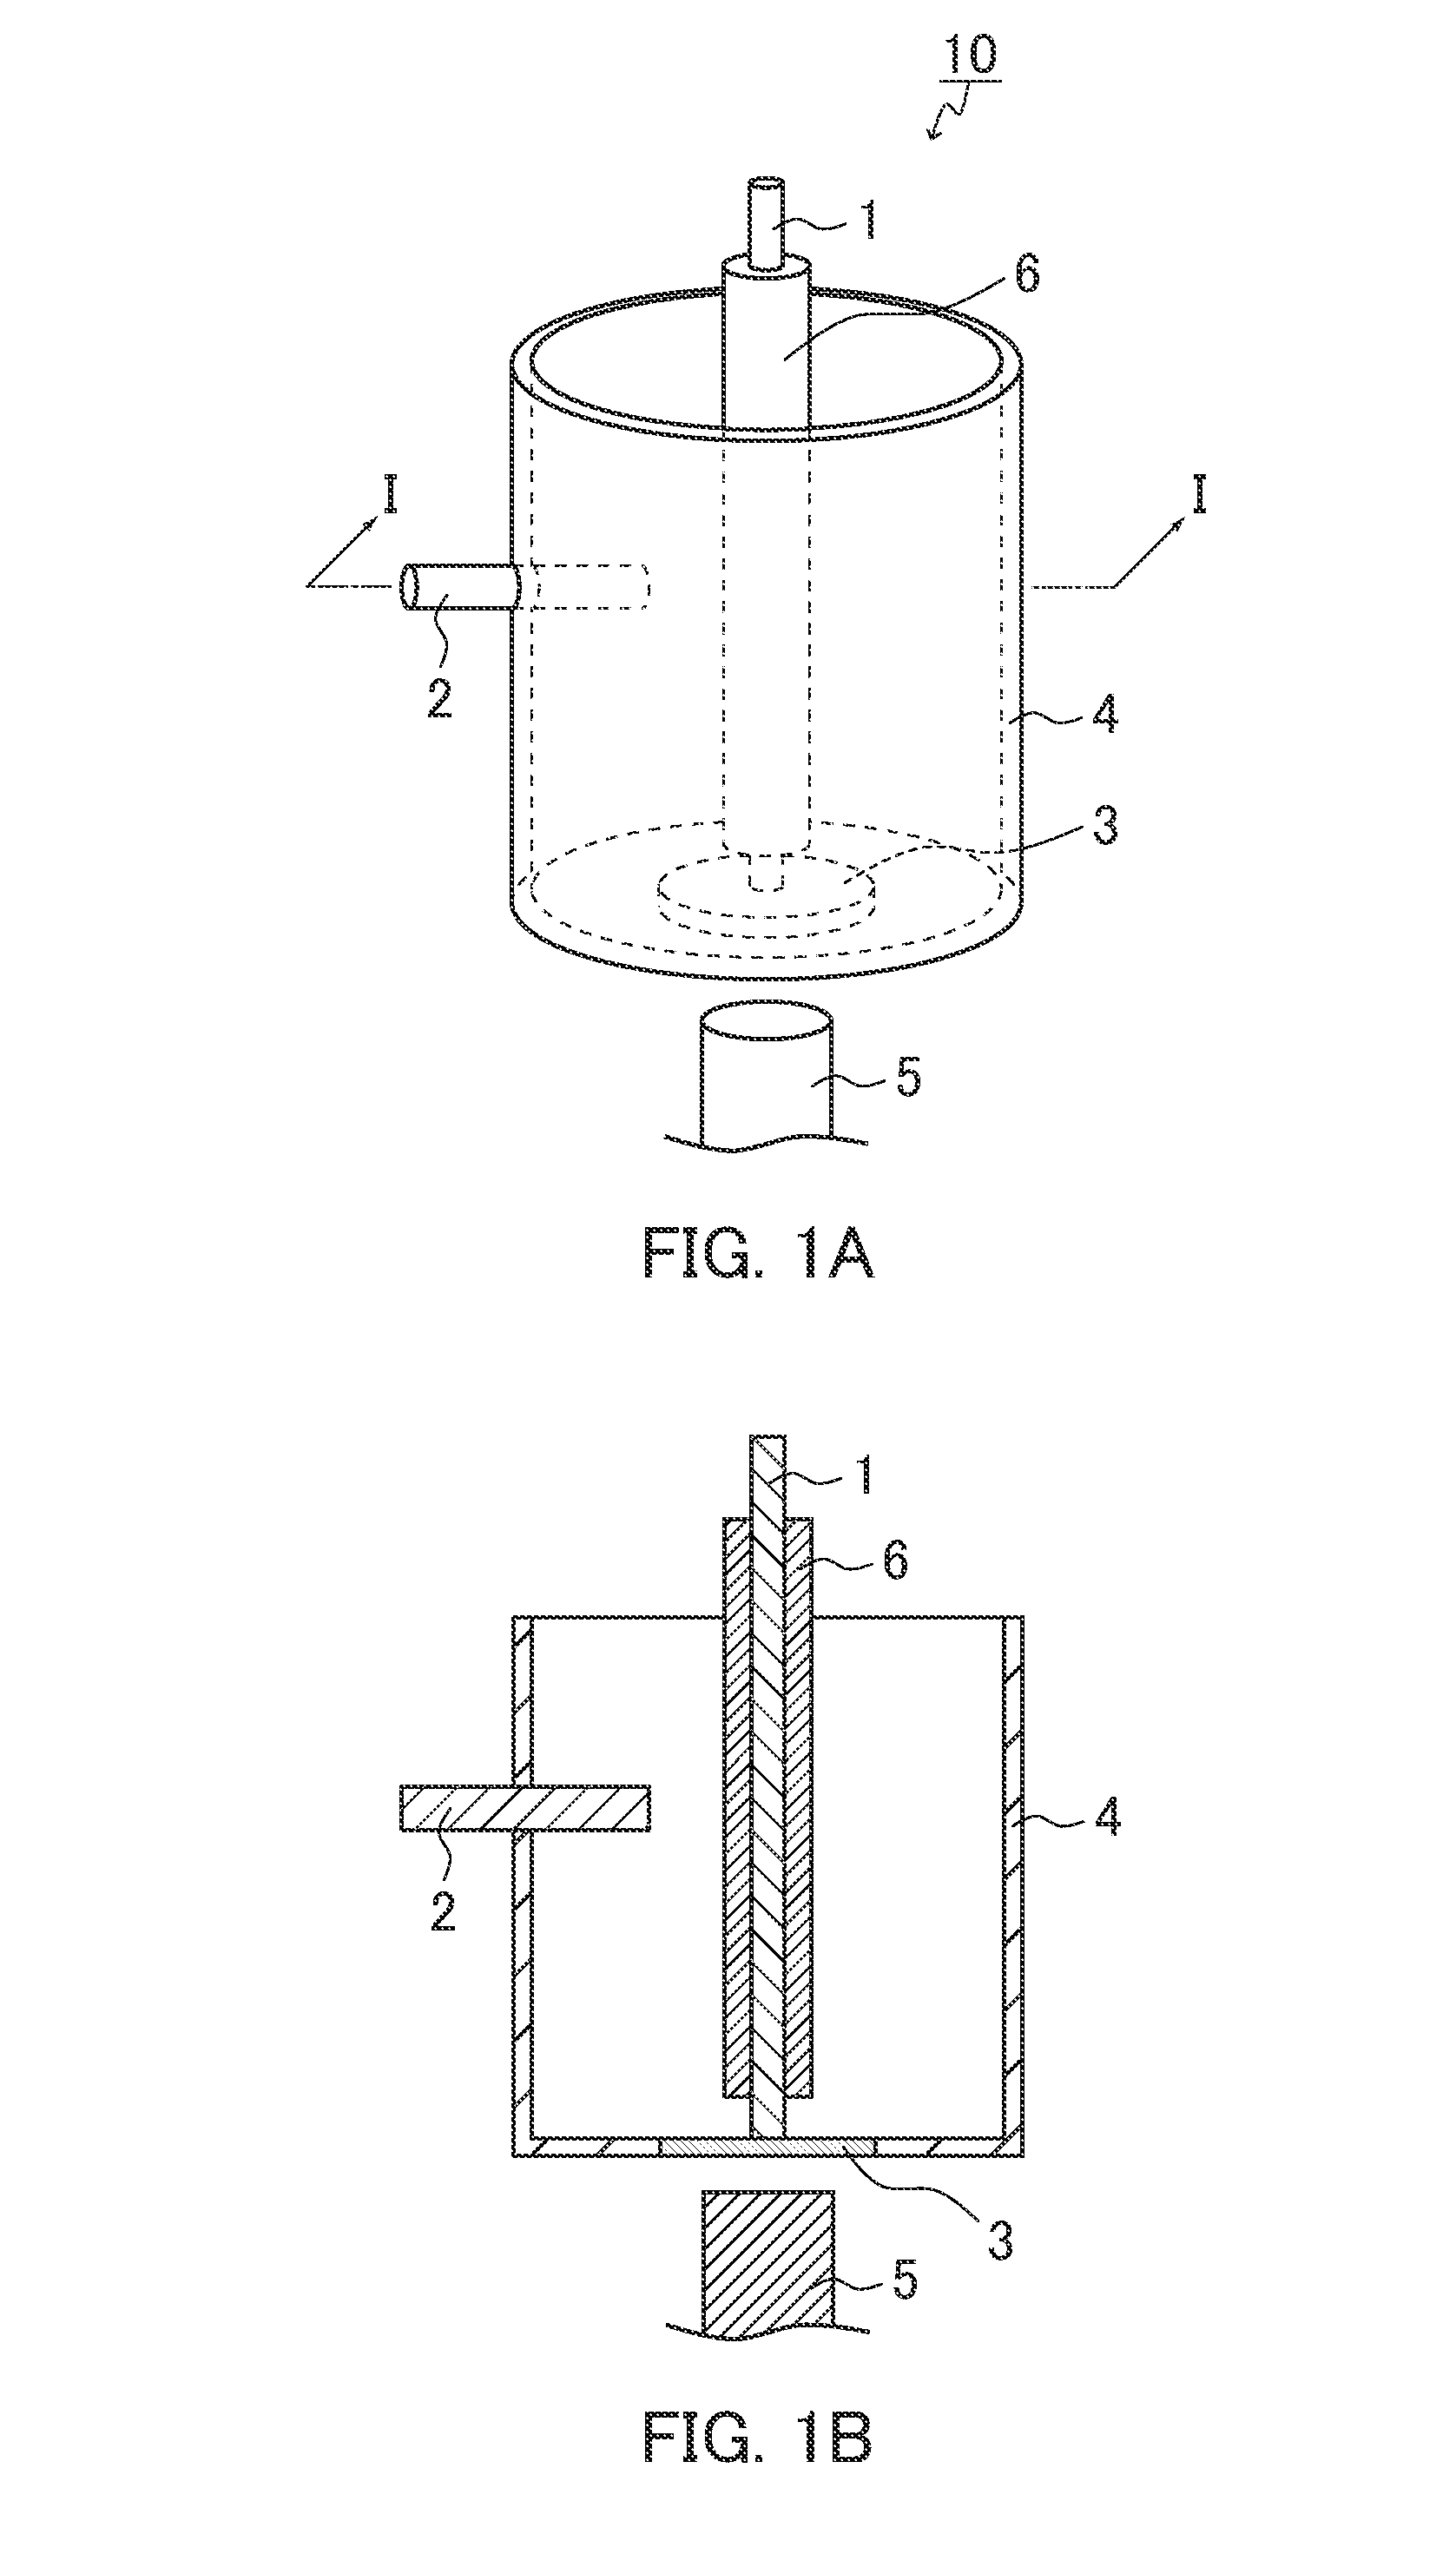
[0061](1) Plasma Spectrochemical Analyzer

[0062]The analyzer according to the above-described embodiment was provided. Specifically, a bottomed cylindrical container formed of transparent PMMA (height: 15 mm×diameter: φ10 mm) was provided. At the center of the bottom of the container, a quartz glass member was disposed. An electrode 1 and an electrode 2 were disposed in the container. The electrode 1 was disposed in such a manner that it extended perpendicular to the bottom surface of the container and the tip of the electrode 1 was in contact with the quartz glass member at the bottom of the container. As the electrode 1, a brass rod with a diameter of 0.12 mm was used. The electrode 1 was configured so that a portion of 0.3 mm length from the tip was exposed and the remaining portion was insulated. The electrode 2 was disposed in such a manner it passed ...

example 2

[0081]The present example examined whether the analysis method of the present invention can analyze lead in a urine specimen with high sensitivity.

[0082](1) Plasma Spectrochemical Analysis

[0083]Lead was dissolved in a urine specimen at a concentration of 100 ppb. Thereafter, lithium hydroxide powder was added thereto so that the concentration of lithium hydroxide was 0.2 mol / L. Then, the spectrum of the generated plasma emission was measured in the same manner as in (2) of Example 1, except that the thus-obtained lead sample was used instead of the mercury sample. Also, as a control (comparative example), the spectrum of the generated plasma emission was measured in the same manner, except that the concentration was not performed.

[0084]The results thereof are shown in FIG. 4. FIG. 4 is a graph showing spectra in the vicinity of the lead peak. In FIG. 4, the horizontal axis indicates the wavelength, and the vertical axis indicates the emission intensity (the number of counts). In FIG...

example 3

[0088]The present example examined whether the analysis method of the present invention can analyze cadmium with high sensitivity.

[0089]A cadmium sample was prepared by dissolving cadmium in 0.2 mol / L lithium hydroxide solution at a concentration of 1 ppm. The spectrum of the generated plasma emission was measured in the same manner as in (1) of Example 2, except that the thus-obtained cadmium sample was used instead of the lead sample. Also, as a control (comparative example), the spectrum of the generated plasma emission was measured in the same manner, except that the concentration was not performed.

[0090]The results thereof are shown in FIG. 6. FIG. 6 is a graph showing spectra in the vicinity of the cadmium peak. In FIG. 6, the horizontal axis indicates the wavelength, and the vertical axis indicates the emission intensity (the number of counts). In FIG. 6, the solid line shows the result obtained regarding the example, and the dashed line shows the result obtained regarding th...


PUM

PropertyMeasurementUnit
heightaaaaaaaaaa
heightaaaaaaaaaa
lengthaaaaaaaaaa

Abstract

The present invention provides a plasma spectrochemical analysis method that can be carried out easily and achieves high analytical sensitivity, and includes: a step of concentrating an analyte in a sample in the vicinity of at least one of a pair of electrodes by applying a voltage to the pair of electrodes in the presence of the sample; and a step of generating plasma by applying a voltage to the pair of electrodes and detecting light emitted from the analyte excited by the plasma.

Description

BACKGROUND OF THE INVENTION[0001]1. Field of the Invention[0002]The present invention relates to a plasma spectrochemical analysis method and a plasma spectrochemical analyzer.[0003]2. Description of Related Art[0004]As a method for analyzing an analyte in a sample, an analysis method utilizing plasma emission is known. Patent Document 1 discloses such a method for analyzing a sample using a high-frequency plasma mass spectrometer. Patent Documents 2 and 3 each disclose a method for analyzing a sample by generating plasma in the sample using a plasma generator having a narrow portion and analyzing the plasma emission. Patent Documents 4 and 5 each disclose a method for analyzing a liquid sample by generating plasma in the liquid sample and analyzing the plasma emission.[0005]However, the method disclosed in Patent Document 1 has a problem in that, without a proper pretreatment of a sample, contamination of the sample with other substances may affect the result of analysis. The metho...

Claims


Application Information

Patent Timeline
Patent Type & Authority Applications(United States)
IPC IPC(8): G01N21/68G01N33/20
CPCG01N33/20G01N21/68G01N21/66G01N21/67
Inventor SHIRAKI, YASUNORIOKAI, HITOSHI
Owner ARKRAY INC
Why Eureka
Try Eureka