Analyzing High Dimensional Data Based on Hypothesis Testing for Assessing the Similarity between Complex Organic Molecules Using Mass Spectrometry
a technology of mass spectrometry and high dimensional data, applied in the direction of material analysis, chemical machine learning, instruments, etc., can solve the problem that two ga cannot be proved “identical”
- Summary
- Abstract
- Description
- Claims
- Application Information
AI Technical Summary
Benefits of technology
Problems solved by technology
Method used
Image
Examples
example 1
[0024]Copolymer-1 (20 mg, purchased from Sigma-Aldrich (St. Louis, Mo.)) or GA (20 mg, ScinoPharm Taiwan Ltd.) was dissolved in 1 mL mannitol (40 mg / mL) at the same concentration as Copaxone, and 7 replicate samples of Copolymer-1 or GA were prepared from 30 μL of the solution. Ten samples were prepared from 30 μL of each lot of Copaxone. For digestion, 45 μL of distilled deionized water (ddH2O), 18 μL of ammonium bicarbonate (24 mg / mL, adjusted pH 8.40), and 15 μL of Lys-C (0.2 g / L) were added to each sample. These samples were incubated at 37° C. for 16 hours in a water bath. After incubation, 10 μL trifluoroacetic acid (0.1%, v / v) and 118 μL acetonitrile (100%) were added to stop the reaction. These samples were filtered through a hydrophilic polyvinylidene fluoride membrane filter with pore size 0.22 μm (Millipore, Billerica, Mass.). Before UPLC-MS analysis, the samples were stored at −20° C.
example 2
[0025]High-Dimensional LC-MS Data Generated from Copolymer-1 Samples
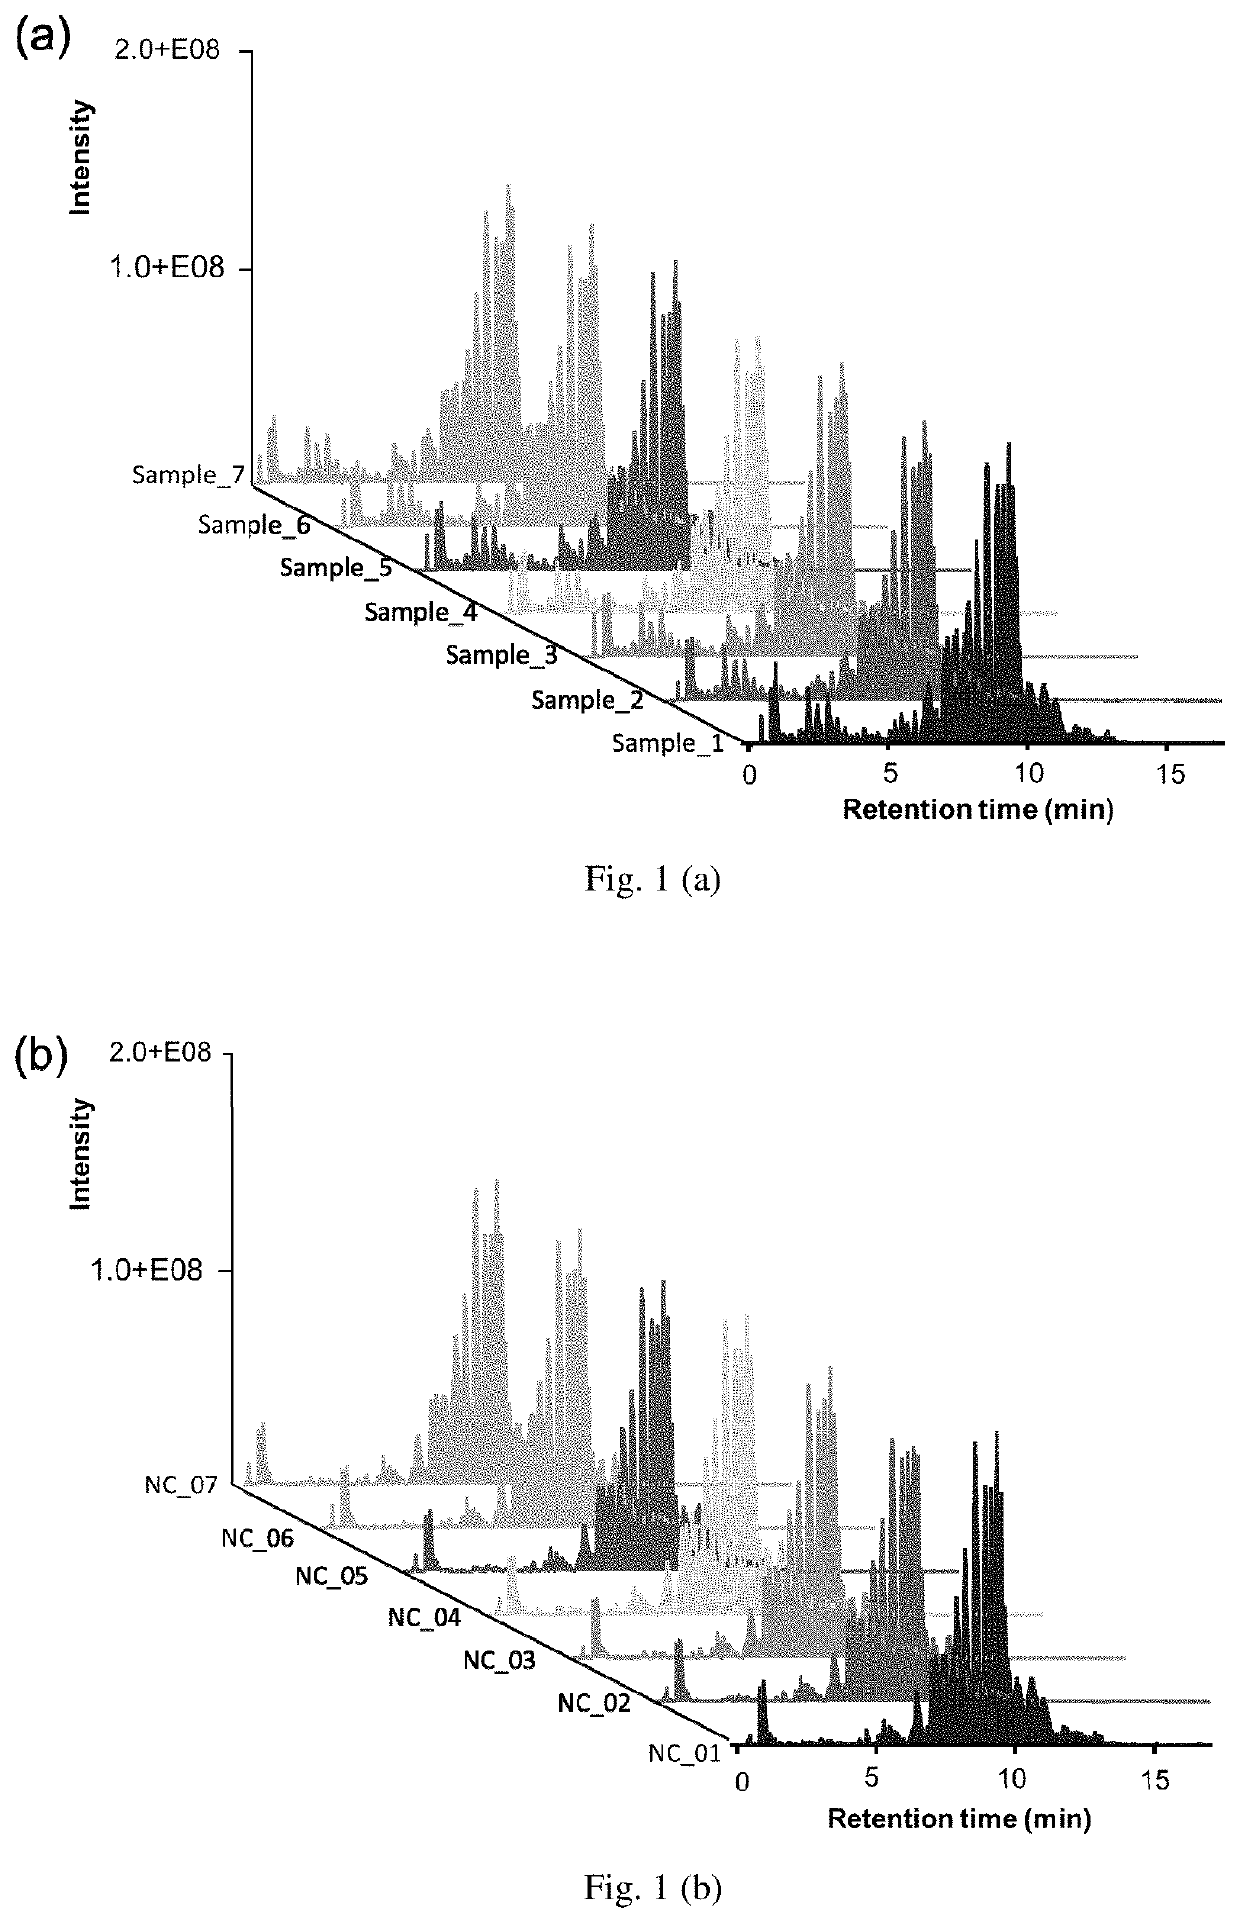
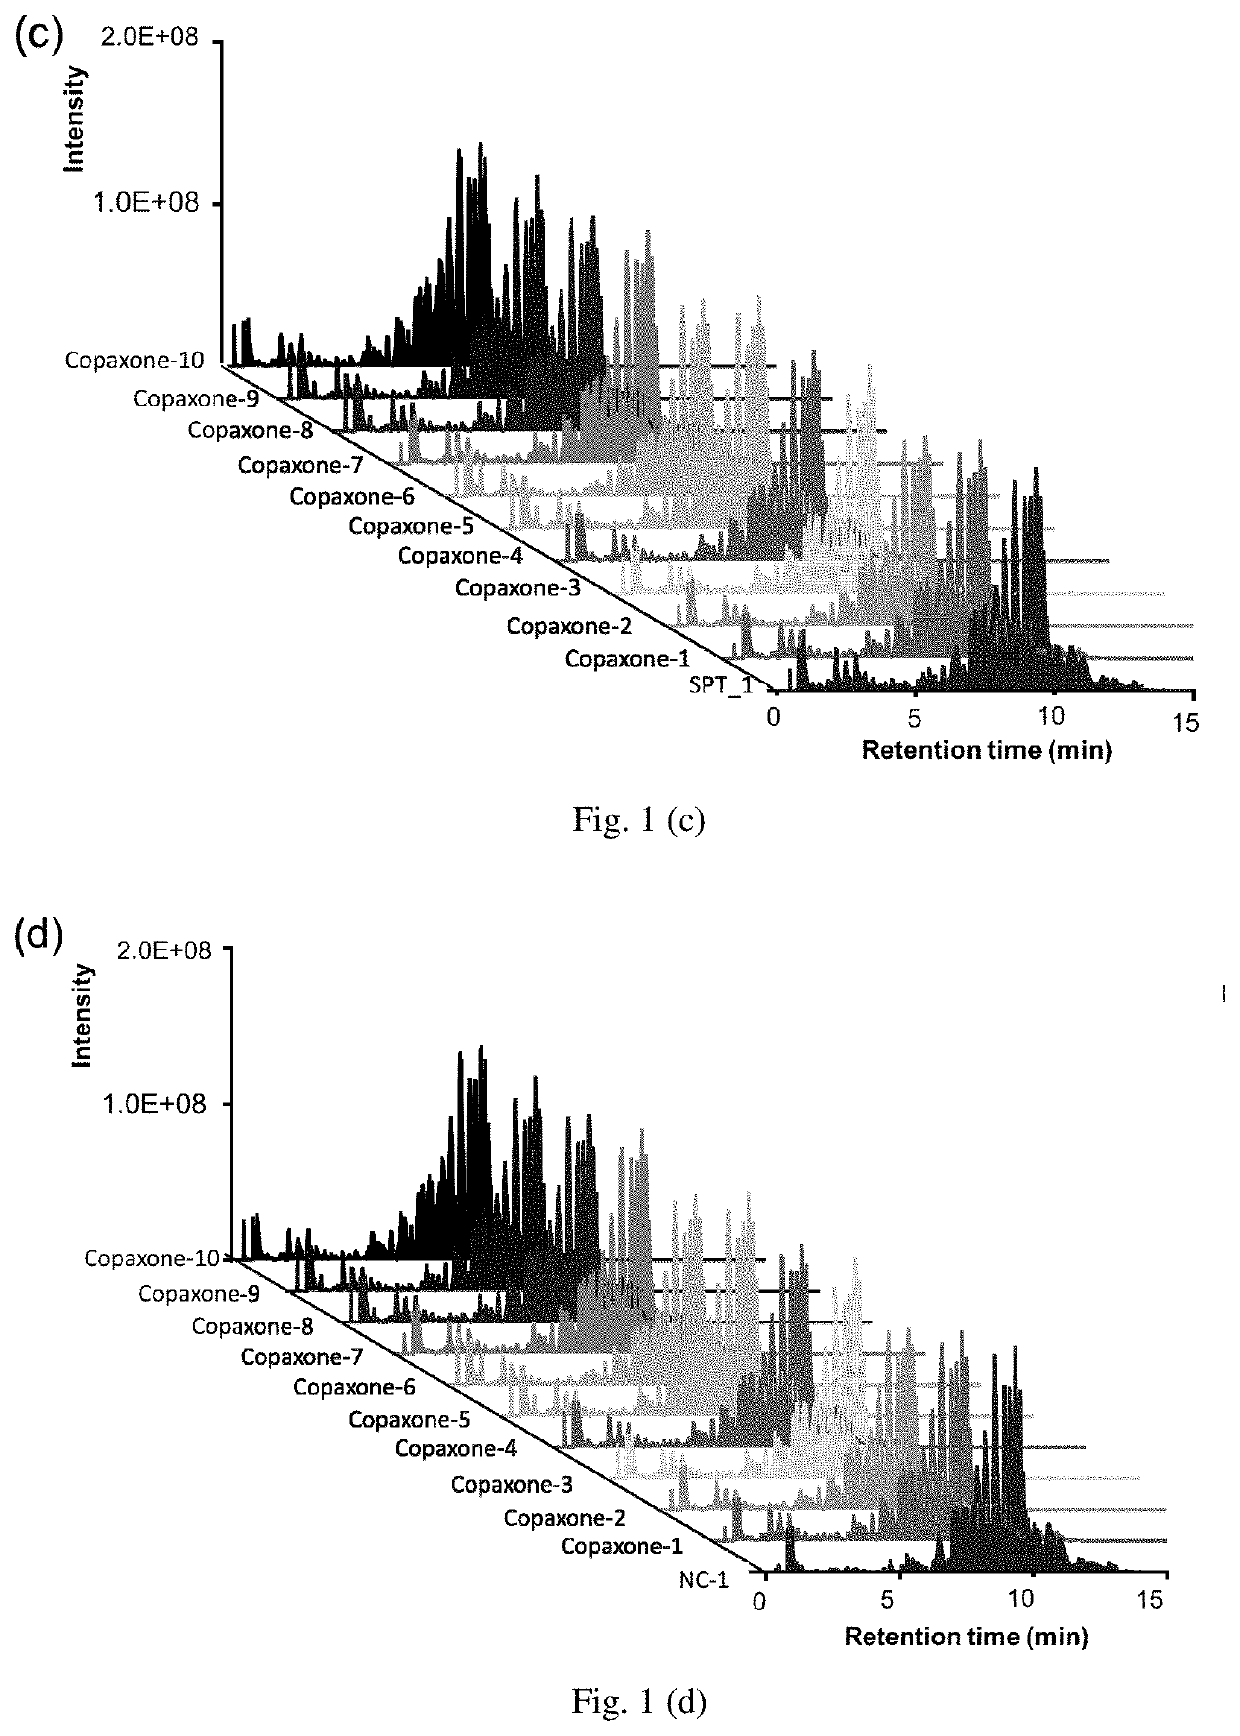
[0026]The LC / MS data of the 7 replicate samples from 2 different sources of Copolymer-1 runs, including Copolymer-1 samples and negative control (NC), both look similar (FIGS. 1a Copolymer-1 samples and 1b negative control), indicating the great reproducibility between their individual 7 replicates. Aligning the LC-MS data of Copolymer-1 samples and 10 lots of Copaxone got an average score larger than 95%, implying that the Copolymer-1 samples and Copaxone have similar digested peptide composition. This can also be observed from the LC / MS data among these 11 runs (FIG. 1c). There are several distinct peaks existed in the first 7 min (FIG. 1d) while comparing the 10 lots of Copaxone with one replicate of negative control, where the Copolymer-1 had negligible peaks within this region, suggesting that certain digested peptides were detected only in Copaxone but not in the negative control.
example 3
[0027]Evaluation of Similarity by Hypothesis Testing
[0028]A statistical hypothesis test is a method of statistical inference and commonly applied to comparison of two or more data sets. In the test method, the statistical hypothesis is a testable hypothesis that is based on the basis of observing a process that is modeled via a set of random variables. We developed a hypothesis testing approach to analyze the high-dimensional LC-MS data to assess the extent of similarity between the reference drug and generics. One characteristic of our proposed hypothesis testing approach is to consider the differences in all data points between two sample groups.
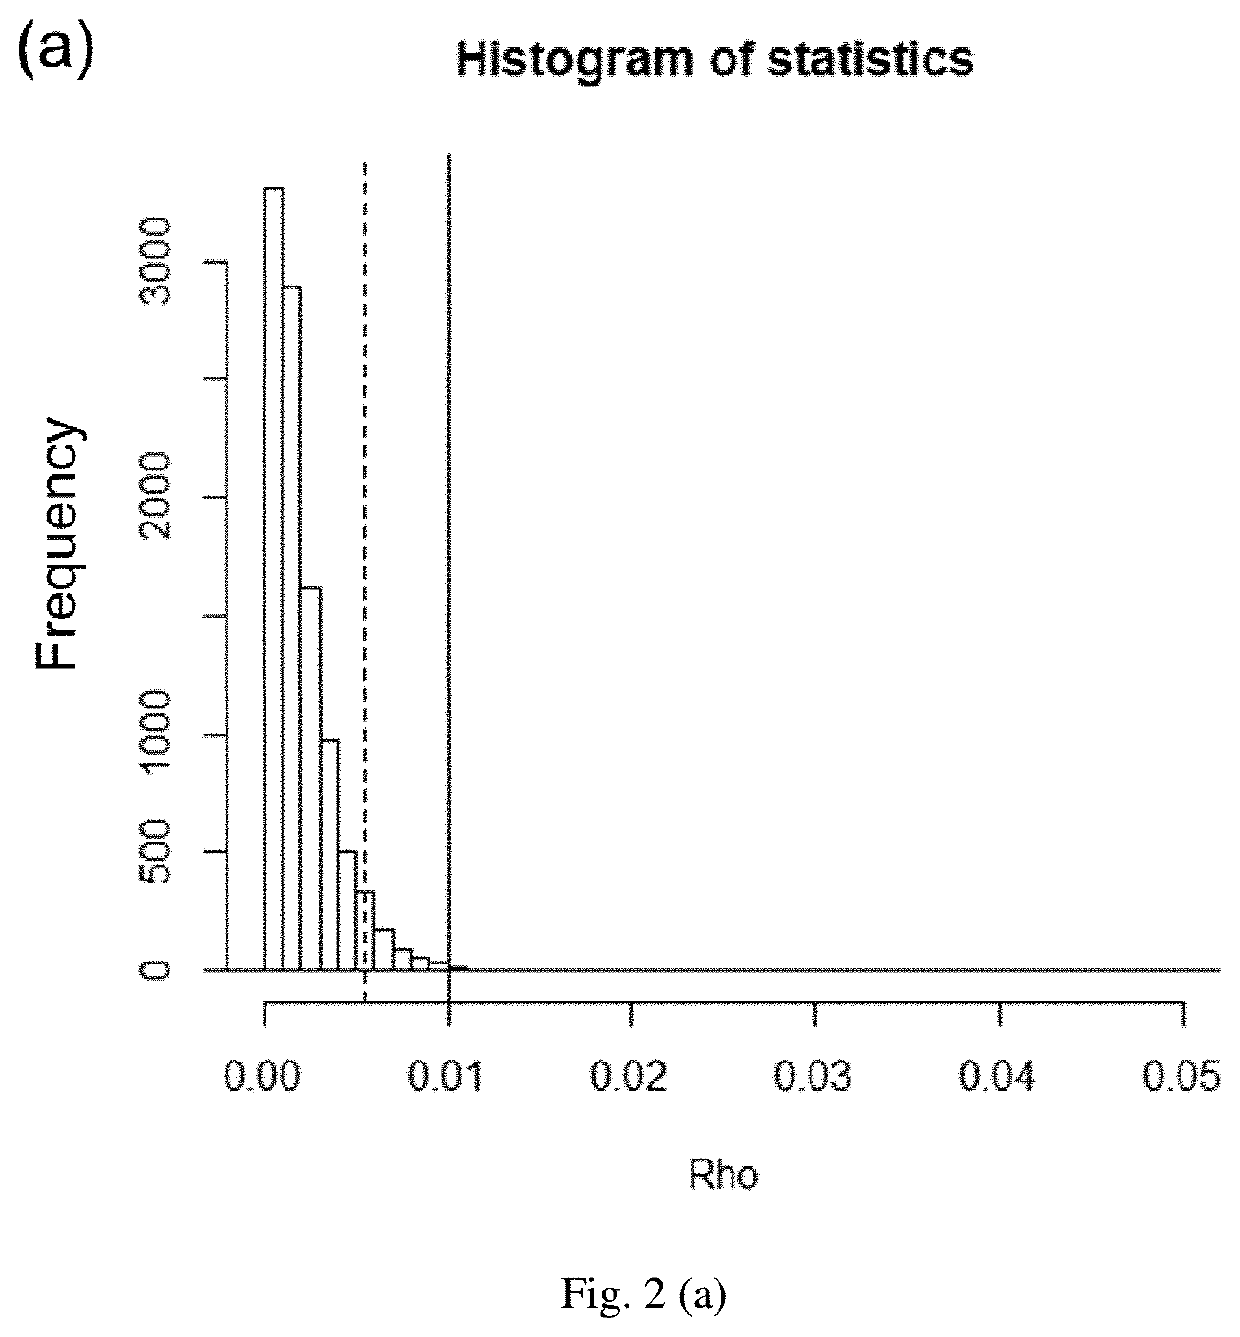
[0029]To first evaluate the feasibility of this approach, 10 lots of Copaxone were randomly separated into two groups with 5 lots each and their data points were used for the developed sum of squared deviations test. The was {circumflex over (ρ)}(95%) (p-value0 was rejected and different lots of Copaxone were significantly similar (FIG. 2a...
PUM
 Abstract
Description
Claims
Application Information
 - R&D
- Intellectual Property
- Life Sciences
- Materials
- Tech Scout
- Unparalleled Data Quality
- Higher Quality Content
- 60% Fewer Hallucinations
Browse by: Latest US Patents, China's latest patents, Technical Efficacy Thesaurus, Application Domain, Technology Topic, Popular Technical Reports.
© 2025 PatSnap. All rights reserved.Legal|Privacy policy|Modern Slavery Act Transparency Statement|Sitemap|About US| Contact US: help@patsnap.com


