Method and apparatus for determining interstitial volume

Inactive Publication Date: 2020-06-04
PHARMACOPHOTONICS INC
View PDF0 Cites 0 Cited by
  • Summary
  • Abstract
  • Description
  • Claims
  • Application Information

AI Technical Summary

Benefits of technology

[0010]According to one aspect of the disclosure, a method of selecting a treatment for a subject having or at risk of a disease based on a value for the interstitial space volume of the subject, the method comprising: A) acquiring a plurality of sample data values representing concentrations of a small marker and a large marker in blood samples of a subject over a duration of time, the small marker filterable by glomeruli of the subject and the large marker not filterable by the glomeruli of the subject; B) calculating a value for plasma volume of the subject, V1, by dividing a dosed concentration of the large marker provided to the subject by a measured average concentration of the large marker from the plurality of sample data values; C) calculating a value for concentration of the small marker at time zero (C0) using the calculated vale of the plasma volume (V1); D) fitting the plurality of sample data values of at least the small marker to a curve using the value of C0; E) calculating a plurality of values for parameters of a resulting fitted curve; F) calculating a value for mGFR using the plurality of values for parameters of the fitted curve and a value for an initial dose of the small marker provided to the subject; G) deriving a value for a measured leakage rate of the small marker into interstitial space of the subject using the calculated value of the mGFR and the calculated plurality of values for parameters of the fitted curve; H) deriving a value for the interstitial space volume of the subject using the derived value for the measured leakage rate of the small marker into the interstitial space and the calculated value of mGFR and the calculated plurality of values for parameters of the fitted curve; and I) selecting one or more treatments for administration to the subject when the derived value for the interstitial space volume exceeds a threshold value for interstitial space volume that would classify the subject as in need of a treatment and/or modulation of treatment for a disease.
[0011]According to one aspect of the disclosure, a method of selecting a treatment for a subject having or at risk of developing congestive heart failure, hypertension, chronic kidney disease or sepsis, comprises: A) administering a first VFI to the subject, wherein the first VFI is filtered by the glomeruli of the subject; B) administering a second VFI to the subject, wherein the second VFI is not filtered by the glomeruli of the subject; C) measuring a concentration of both the first VFI and the second VFI in the subject, at a timepoint Tm; D) determining the vascular volume of distribution of both the first VFI and the second VFI at Tm; E) calculating a T0 concentration (CT0) for the first VFI by one of multiplying the concentration of the second VFI concentration at Tm by the ratio of (first VFI concentration at Tm)/(second VFI concentration at Tm); F) calculating interstitial volume of the subject from the CT0 value; and G) if the calculated interstitial volume exceeds a threshold value for interstitial volume that would classify subject as in need of a treatment and/or modulation of treatment, selecting one or more treatments for congestive heart failure, hypertension, chronic kidney disease or sepsis for administration to the subject, thereby selecting a treatment for a subject having or at risk of developing congestive heart failure, hypertension, chronic kidney disease or sepsis. In one embodiment, the method further comprises administering the selected treatment to the subject, optionally via intravenous injection or other techniques.
[0012]According to another aspect of the disclosure, a method of selecting a treatment for a subject having or at risk of a disease comprises: A) determining a vascular volume of distribution of both a first VFI and a second VFI at a timepoint Tm, the first VFI filterable by the glomeruli of the subject and the second VFI not filterable by the glomeruli of the subject; B) calculating a T0 concentration (CT0) value for the first VFI by multiplying a concentration of the second VFI concentration at Tm by a ratio of the first VFI concentration at Tm to the second VFI concentration at Tm; C) calculating interstitial volume of the subject from the CT0 value and measured concentrations of the first VFI and the second VFI at Tm; and D) selecting one or more treatments for administration to the subject when a calculated interstitial volume exceeds a threshold value for interstitial volume that would classify subject as in need of a treatment and/or modulation of treatment.
[0013]According to another aspect of the disclosure, a method of selecting a treatment for a subject having or at risk of a disease comprises: A) obtaining data r

Problems solved by technology

Biometric indicators are valuable tools used by medical practitioners to aid in the diagnosis of a patient, and their ability to determine the proper course of medical treatment is often limited by access to rapid and accurate quantitative biometric information.
While a medical practitioner may prefer to assess multiple biometric indicators prior to deciding on a particular treatment, the patient's condition may deteriorate faster than

Method used


Image

  • Method and apparatus for determining interstitial volume
  • Method and apparatus for determining interstitial volume
  • Method and apparatus for determining interstitial volume

Examples


example 1

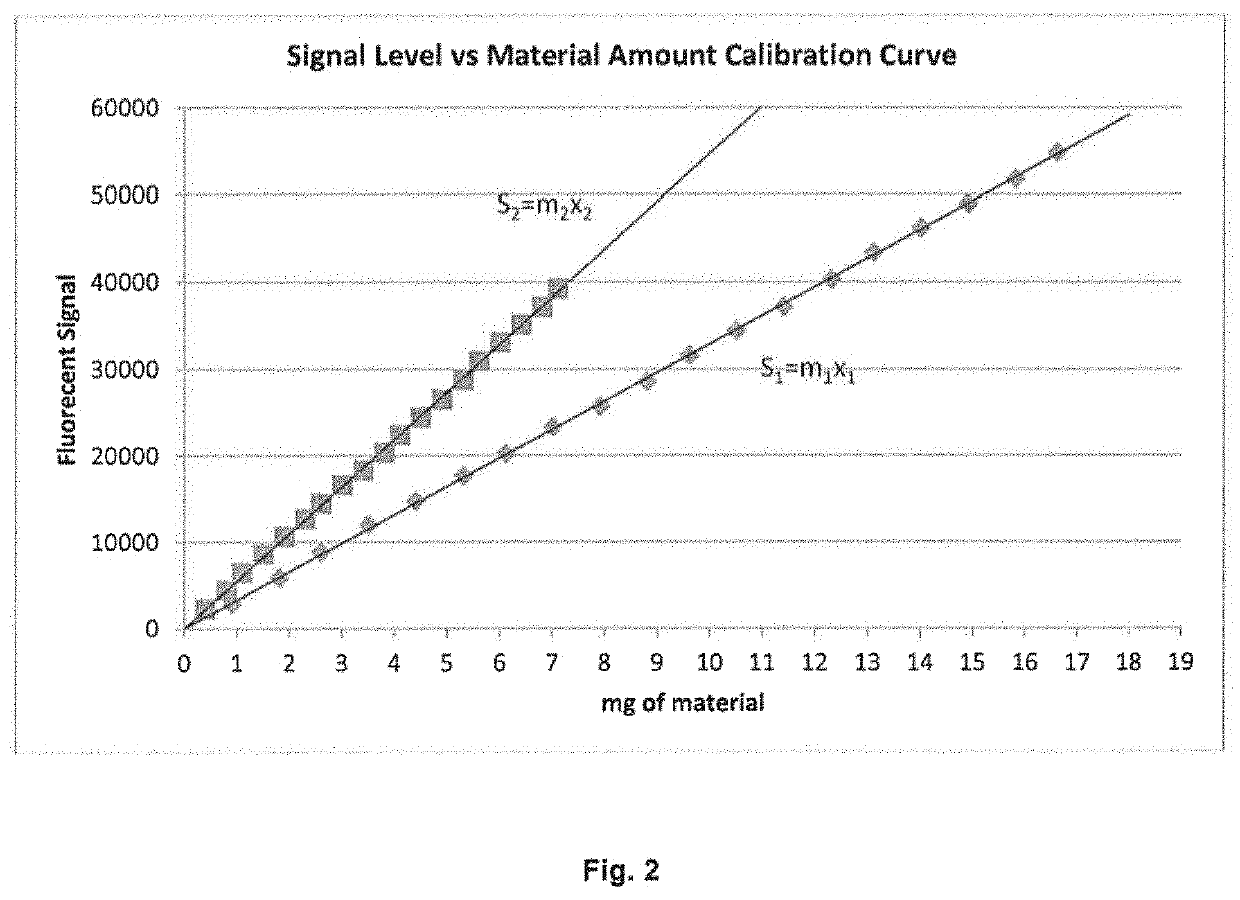
r Generation of Calibration Curves

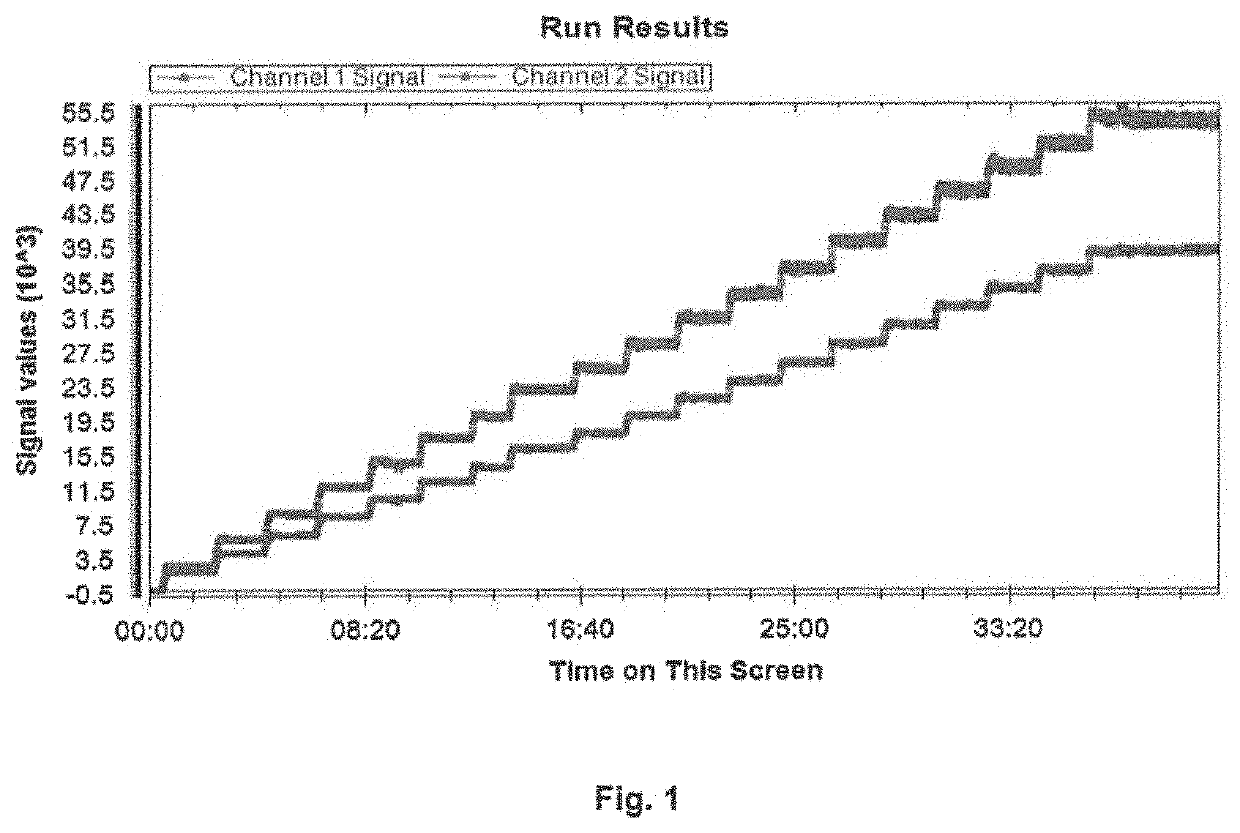
[0099]1. A step dose blood test set is run on a whole blood sample containing two fluorescent markers each having its distinct emission wavelength. An example of the results is shown in FIG. 1 with the upper curve representing the first emission signals from the first fluorescent marker or tag recorded in Channel 1 as the Channel 1 signal, and the second emission signals from the second fluorescent marker or tag recorded in Channel 2 as the Channel 2 signal. As discussed previously, this step dose blood test set can also be generated using one static marker having two fluorescent tags each tag having its distinct emission wavelength. Each fluorescent marker or each fluorescent tag may be referred to as a “fluorescent component” hereafter.

[0100]2. The average signal level of the “flat” or stable portion at each dose step for each fluorescent component is calculated.

[0101]3. Based on the known volume of blood (Vt) used, the known dose of VFI (VD) and ...

example 2

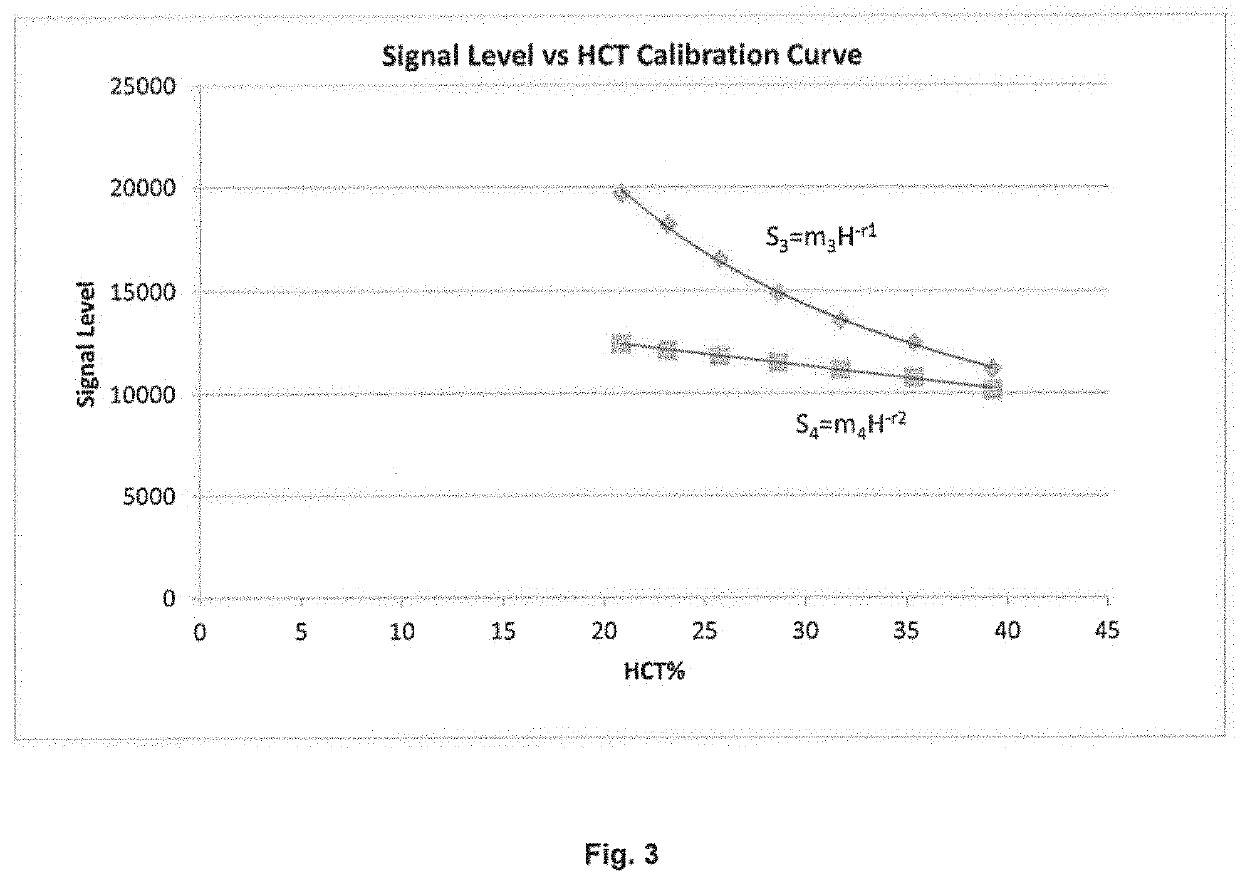
r Generation of a Species Specific Hematocrit (HCT) Calibration Curve

[0103]1. A blood test is run with the single dose approach. With a known volume of blood (Vt) and a known HCT of the blood (Hcalib), the volume of saline (VS) needed for the test is calculated.

Vt−VtHcalib=VS  (4)

[0104]2. The blood and the saline are equivalently dosed from the same VFI vial.

[0105]3. A predetermined volume of blood is removed from the test set and discarded. The same volume of dosed saline, as the blood previously removed, is injected back into the test set. This exchange will maintain the concentration of each component as well as the total volume of the test set, but alter the volume of distribution to HCT ratio. This step is repeated numerous times to generate multiple data points at which the volume of distribution and HCT ratio are different.

[0106]4. Each new point is allowed to stabilize before a new point is generated. A new HCT is calculated at each stable point.

(Vt-Ve)(H0)Vt=H′(5)

[0107]Wher...

example 3

r Determining Various Biometric Indicators

[0114]When a test is run on a subject, the “batch” of VFI must be known because the signal calibration and HCT calibration curves used for interpretation must be based on the same “batch” of VFI given to the subject.

[0115]1. From a test data sample of FIG. 5, the raw ratio at T0 (RT0) and the average stable Component 2 (FD003) signal level (Savg) are extracted. The lower curve in FIG. 5 represents Channel 1 signals, and the upper curve represents Channel 2 signals.

[0116]2. Using the raw ratio at T0 (RT0), the apparent HCT of the subject is calculated from the Ratio vs HCT Calibration Curve.

RT0=KH−q  (10)

H=Happ  (11)

[0117]3. Using the calculated apparent HCT and the Signal Level vs. Material Amount Calibration Curve; the amount of correction, C, is calculated and applied to the average signal level component.

[0118]From Equation 7:

Scalib=m4Hcalib−r  (12)

Sapp=m4Happ−r  (13)

If Happcalib then Scalib / Sapp

If Happ>Hcalib then Sapp / Scalib

Scalib / Sap...


PUM


Abstract

A method and system for selecting a treatment for a subject based on a value for the interstitial space volume of the subject utilizes plurality of sample data values representing concentrations of small and large markers in plurality of blood samples over time. The sample concentrations are utilized to predict a hypothetical peak concentration of the small marker prior to the dissipation of the markers during the test period. This hypothetical peak concentration and other sample values are utilized with either a bi-exponential or tri-exponential decay curve fitting algorithm to define a decay curve, the curve characteristics of which are then utilized to calculate values for glomerular filtration rate, a leakage rate of the small marker into interstitial space, and finally a value for the interstitial volume. The determined value for the interstitial volume can then be compared with number thresholds and decisions made for recommended therapy for the subject, if desired.

Description

FIELD OF THE INVENTION[0001]The disclosure relates, at least in part, to methods of measurement of biometric indicators in a mammalian subject, and, more particular, to systems and techniques for measuring the volume of the interstitial space as a diagnostic tool for treatment of disease.BACKGROUND OF THE INVENTION[0002]Biometric indicators are valuable tools used by medical practitioners to aid in the diagnosis of a patient, and their ability to determine the proper course of medical treatment is often limited by access to rapid and accurate quantitative biometric information. Some common biometric indicators used by medical practitioners include core body temperature, blood pressure, heart and respiratory rates, blood oxygenation and hematocrit, glomerular filtration rate (“GFR”), and the like. While a medical practitioner may prefer to assess multiple biometric indicators prior to deciding on a particular treatment, the patient's condition may deteriorate faster than the indicato...

Claims


Application Information

Patent Timeline
IPC IPC(8): G01N33/68G01N33/70G16H10/00G16H50/20G01N33/58A61B5/00A61B5/20
CPCA61K45/06G01N2800/52G01N33/70G16H10/00G01N2800/50G01N33/6893G16H50/20G01N33/582A61B5/201G01N2800/347A61B5/0071G01N2800/56A61B5/4881
Inventor MEIER, DANIEL J.
Owner PHARMACOPHOTONICS INC
Why Eureka
Try Eureka