Several problems with these statistical approaches to
process control are known.
However, this is rarely the case for
process control data in which many outlying values are typically observed and which are often bimodal or show other irregular distributions.
This means that the statistics calculated using SPC type methods often are not an accurate reflection of the manufacturing process being analysed.
Where products exhibit a high degree of consistency of performance then statistical examination of data is adequate, however, some products such as electric circuits have been found to exhibit
performance results that do not fit statistical distributions, even though the data from these products fall within predetermined performance margins.
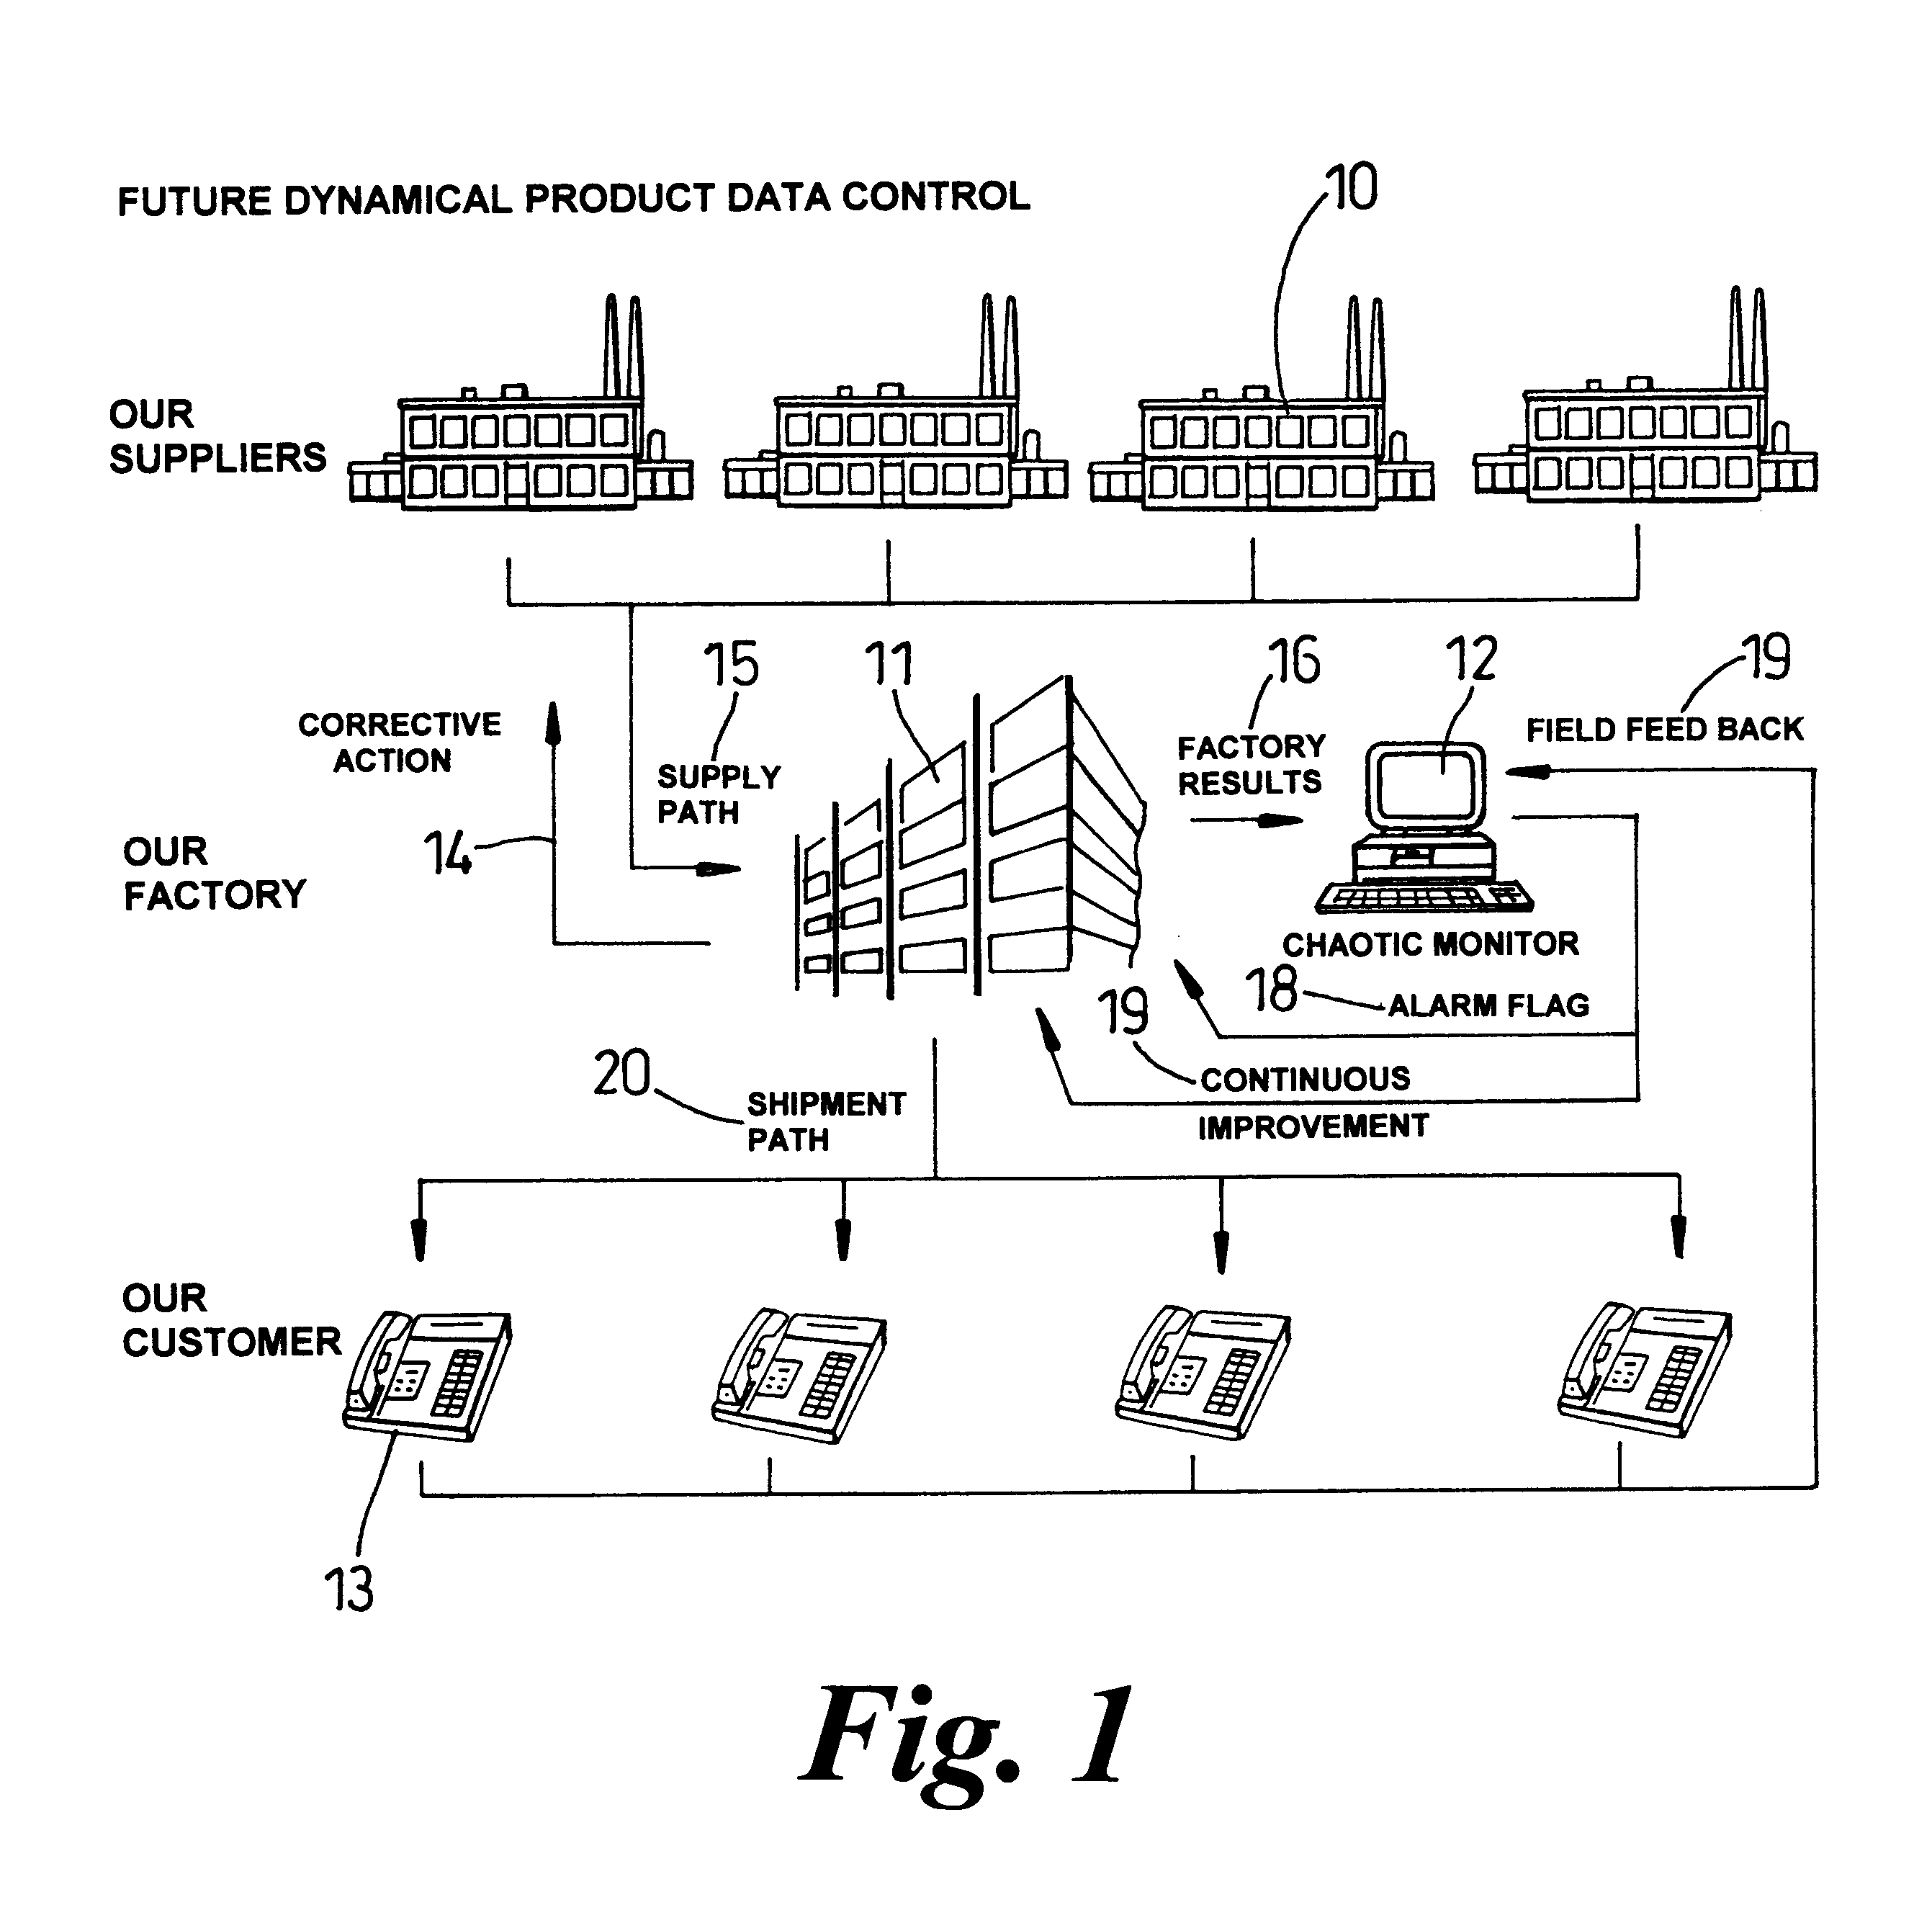
Process control is a difficult problem for manufacturers; it involves analysing the state of the manufacturing process and knowing how to adjust the manufacturing process in the light of the analysis in order to achieve efficiency and desired outputs.
The manufacturer is faced with the problem of producing products that are within certain "tolerance" limits with respect to various parameters (for example, weight of confectionery bars) whilst at the same time reducing waste.
However, because of the limitations of current methods of
process control this cannot be achieved.
Often factors to do with the manufacturing process itself are too difficult to be measured practically and so measurements from the product themselves are taken.
These measurements are sometimes analysed statistically and by making simple comparisons but information about the process is not provided quickly enough and with enough precision to enable the manufacturing process to be adjusted.
This is because the data sets are often small, incomplete, discontinuous and because they contain outlying values.
However, this type of data is typically all that is available for process control.
Often because no suitable method for analysing this kind of data is available, the data is simply stored away "for the
record" and this is a waste of resources.
Methods that can be used to analyse this type of data are typically
time consuming and do not allow the data to be reviewed in close to real time.
Another problem
in process control is being able to deal with the fact that the inputs to the process vary.
However, it is very difficult to analyse how the components vary and this is
time consuming and expensive.
Also, it is difficult to determine what effect variations in the components may have on the manufacturing process that is being controlled.
These problems increase for more complex products that involve many components, such as circuit boards.
This is often not possible if it is necessary to vary the supplier for other reasons, for example to attain a good price or to achieve continuity of supply.
Investment programmes for
test equipment at the component level have shown that it is not practical to distinguish between batches of components and also that the instances of non-compliant components are negligible.
Instances do occur where manufactured products exhibit changes in performance that are attributed to changes in the components but no effective way of dealing with this problem has been found.
A particular problem
in process control involves the situation where a manufacturing process is set up in a particular location, such as the USA, and it is required to set up the same process in a new location, say Canada, in order to produce the same quality of product with the same efficiency.
It is typically very difficult to set up the new process in such a way that the same quality of product is produced with the same efficiency because of the number of factors that influence the process.
In this case, a failure occurs in the manufacturing or other process and it is required to analyse why this has occurred and what corrective action should be taken.
Current methods for dealing with failure mode
effect analysis include
schematic examination and
fault injection techniques but these are not satisfactory because of the problems with the data mentioned above.
This
system is disadvantageous in many respects.
However, in practice it is often not possible to obtain measurements at regular intervals.
Also, JP8314530 does not address the problems of dealing with product data and non
time series data such as product data obtained from many products which will vary.
The manufacturing process can be effectively controlled using the product data despite the fact that this data may not fit a recognised statistical distribution and is not suitable for
statistical analysis.
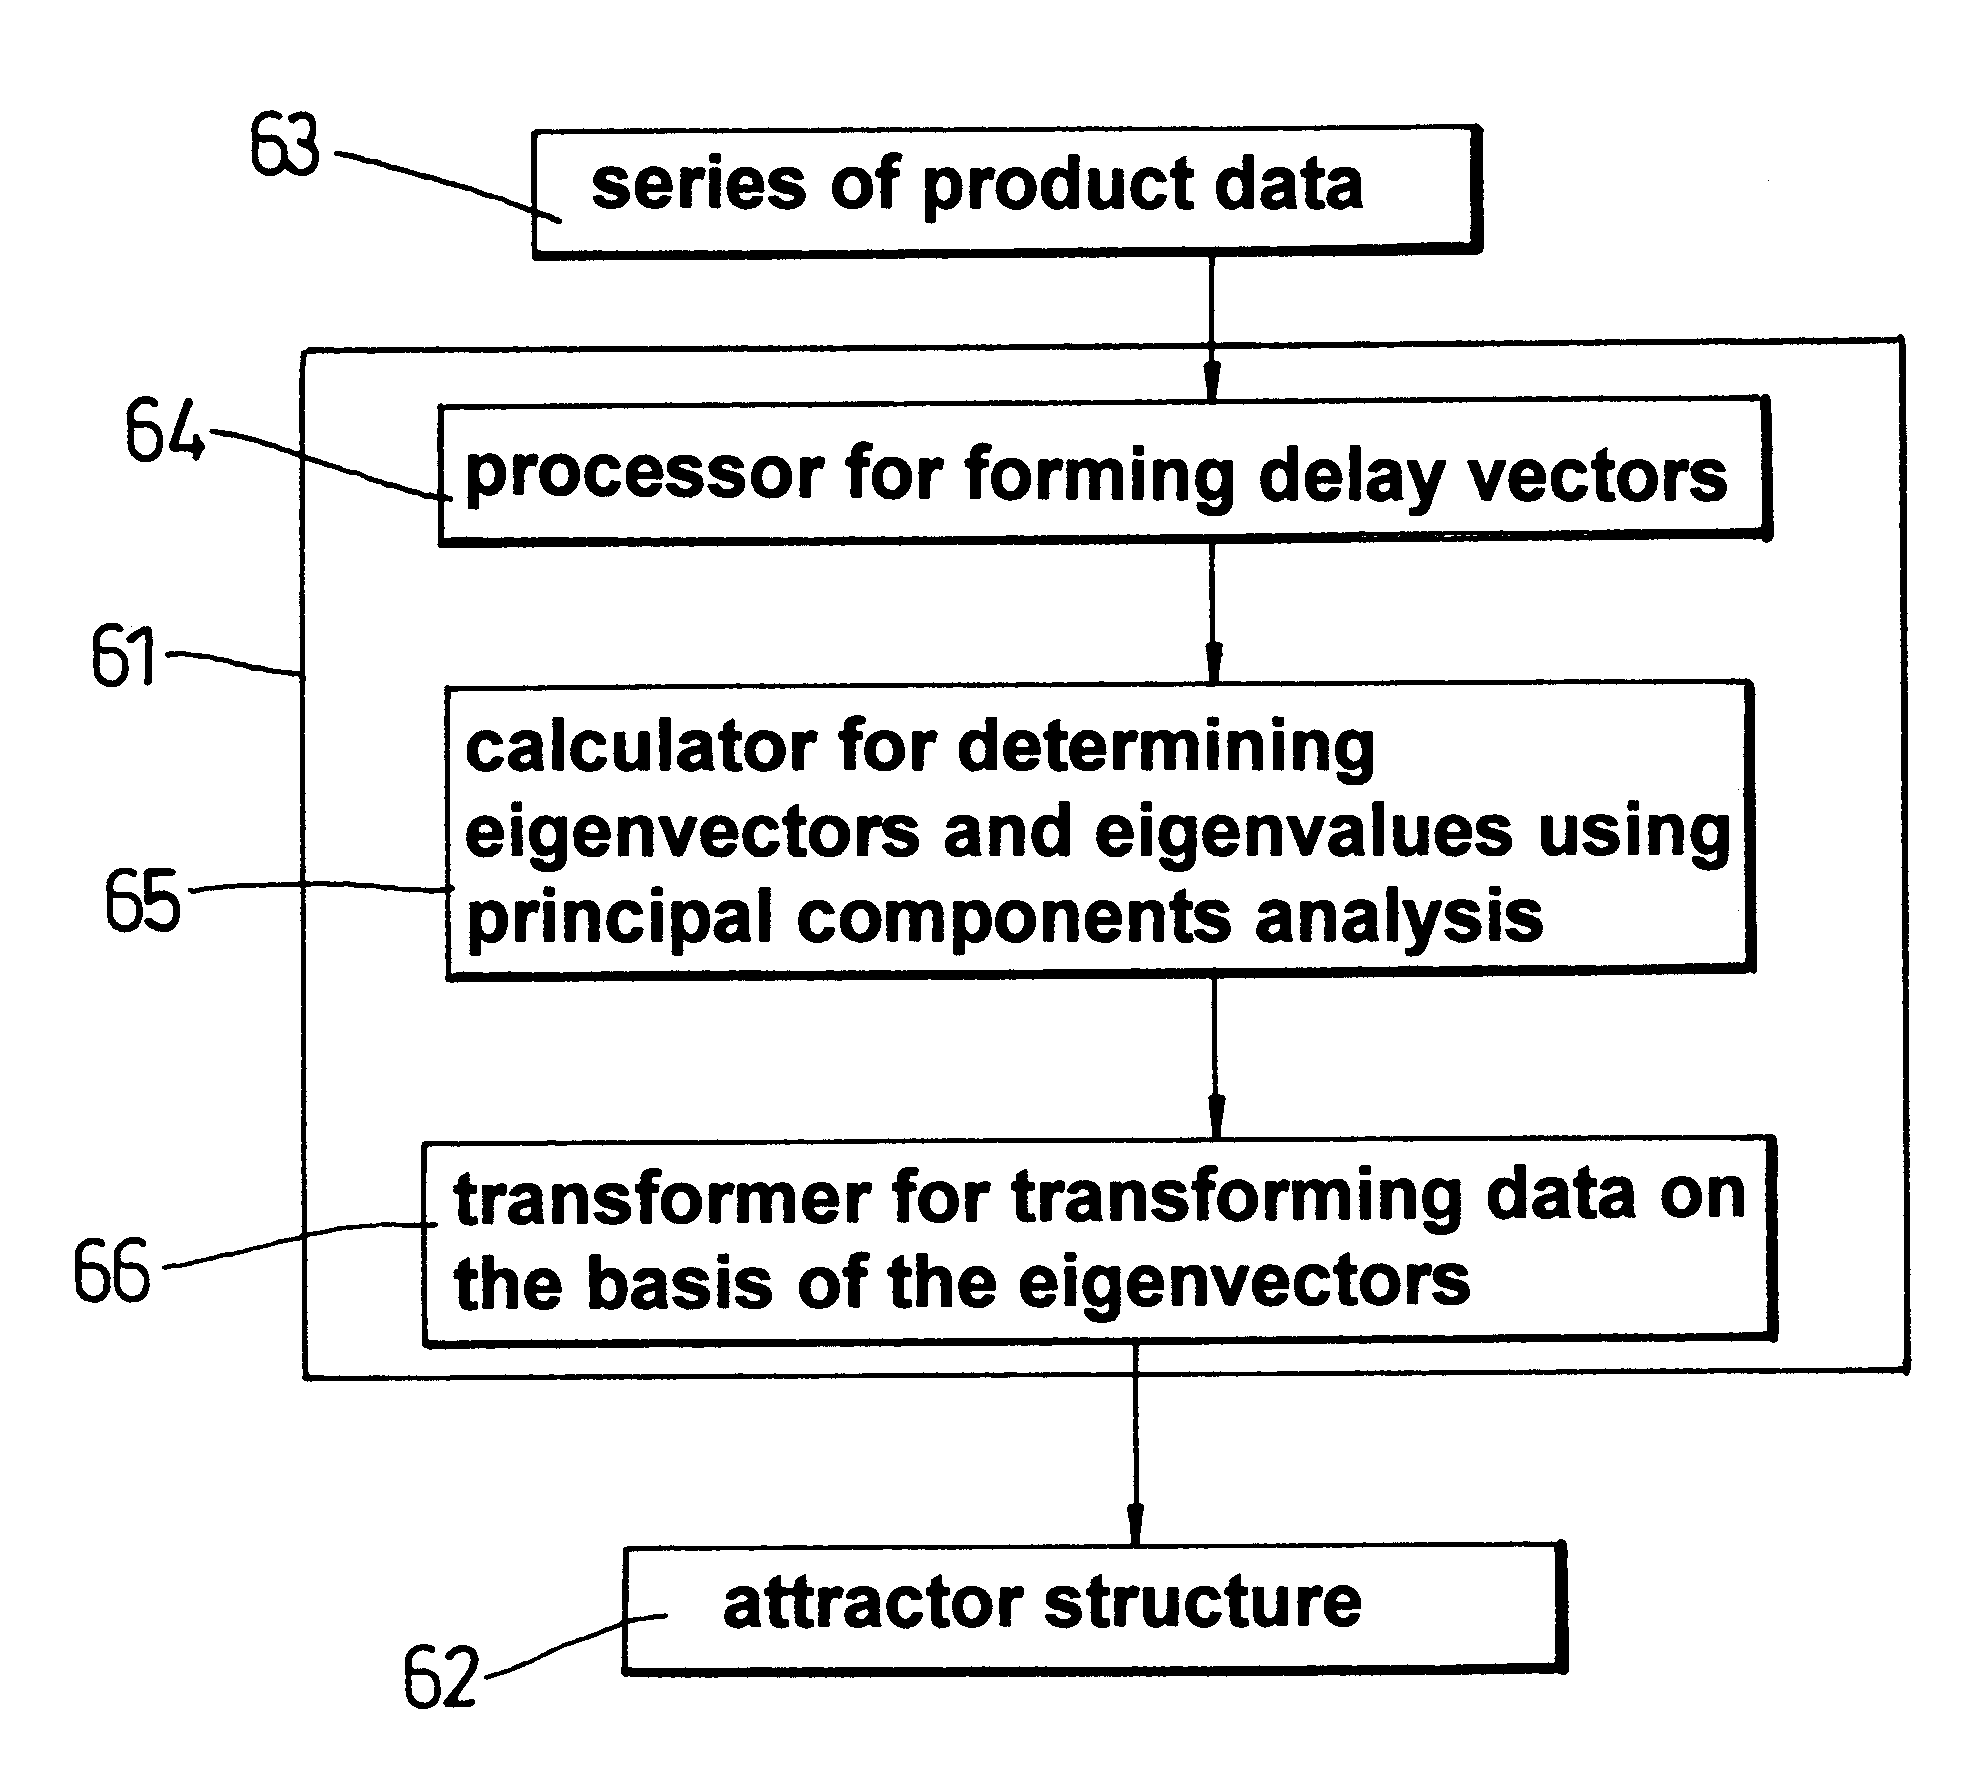
If no effective
attractor structure is identified for a given parameter then this parameter is known not to be a good input for the prediction process.
For these reasons, product data has not previously been thought suitable for successful analysis using methods from
chaotic system analysis.
Chaotic systems are deterministic but are very sensitive to initial conditions.
For example, in a
chaotic system, a small
random error grows exponentially and can eventually completely alter the end result.
Given an initial state for a
chaotic system it becomes essentially impossible to predict where the state will reside in say 40 iterations hence.
A chaotic system typically produces a
time series that appears complex, irregular and random.
However this is not the case in practice where it is found that manufacturing processes are very difficult to control and predict.
In this situation, global stability but local
instability is observed, with sensitive dependence on initial conditions and with
divergence of nearby trajectories in the attractor structure.
Manufacturers obviously aim to reduce the number of warranty returns as far as possible but it is difficult to predict whether a product that passes all the manufacturers tests after it is produced will fail at some future point in time.
If this is the case, the manufacturer is alerted to the fact that future products produced which also relate to that region of the attractor will also be likely to fail in the future.
In this region prediction is difficult.
They will not be independent enough because they are not two independent co-ordinates.
Also
background noise could be misinterpreted as a low-dimensional process if the embedding dimension is too large.
It is known that problems with this method with sensitive dependence on the window length .tau..sub.w exist.
These false crossings arise when we project the attractor into a too low dimensional space.

