
Peak selection in multidimensional data

a multi-dimensional data and peak selection technology, applied in chemical methods analysis, separation processes, instruments, etc., can solve the problems of insufficient effectiveness of existing multi-dimensional peak picking algorithms such as autopsy, and the difficulty of automating peak picking, so as to facilitate the automation of high-throughput analysis

Inactive Publication Date:
View PDF26 Cites 53 Cited by
  • Summary
  • Abstract
  • Description
  • Claims
  • Application Information

AI Technical Summary

Benefits of technology

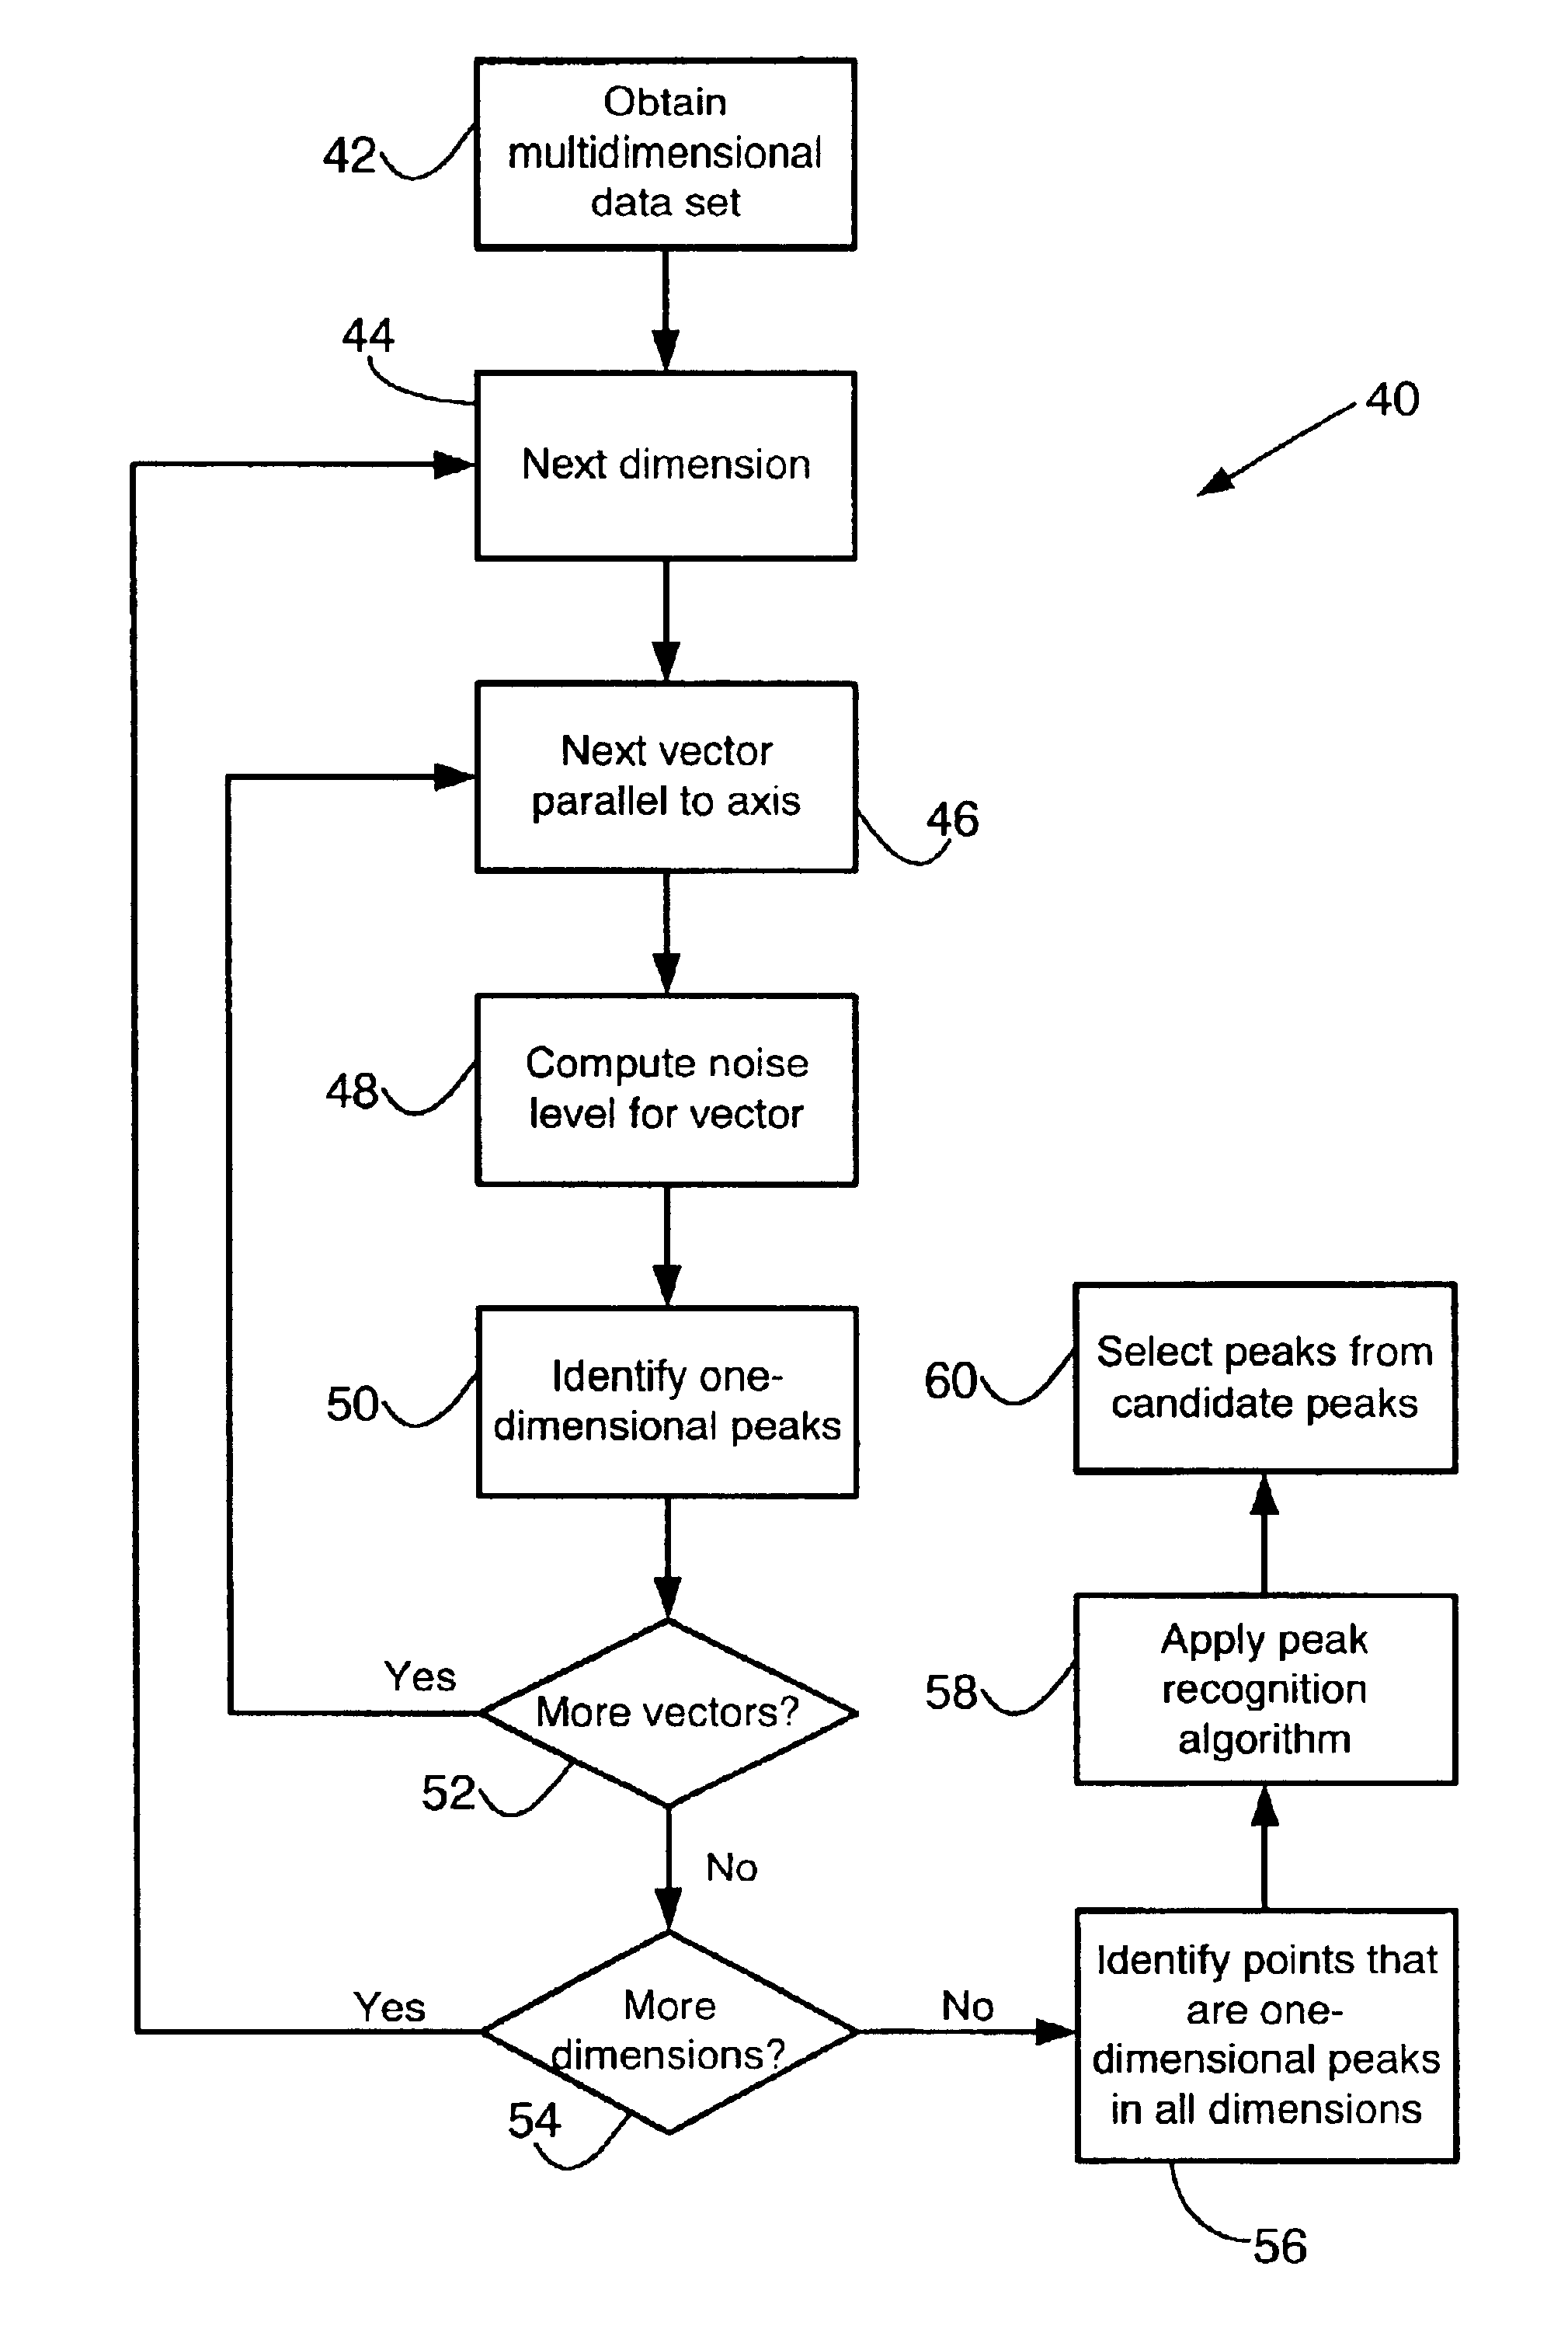
The present invention provides a method for automatic peak selection in multidimensional data. Each point of an n-dimensional data set has up to n different one-dimensional peak selection criteria applied to it, and a point can be selected as a peak only if it satisfies all (or some threshold number) of the applied one-dimensional criteria. The method is effective at selecting peaks in very noisy multidimensional data, as well as in data having non-normally distributed noise or noise levels that differ dramatically in different dimensions. As a result, the method facilitates automation of high-throughput analysis of small volumes of biological fluids by two-dimensional analytical techniques such as liquid chromatography-mass spectrometry.

Problems solved by technology

Because spectra of complex biological samples tend to contain a large number of overlapping peaks and be very noisy, accurate automatic peak picking is a difficult problem to address.
In practice, however, although the peak picking is performed automatically, it is not intended to be fully automated, but rather to serve as an aid to the operator in analyzing and interpreting the data.
Such a method is limited because it does not take advantage of the information provided by the chromatography dimension.
Existing multidimensional peak picking algorithms, such as AUTOPSY, are generally not sufficiently effective at selecting peaks in LC-MS data to allow fully automated peak detection.
Moreover, various aspects of LC-MS data render it not amenable to such analysis.
For example, LC-MS noise arises from a variety of unrelated and, in some cases, poorly understood sources, and is therefore difficult to filter effectively using methods developed for noise with well-known distributions, such as those found in NMR data.
In addition, it is not uncommon for one mass-to-charge ratio to be very noisy, while a single retention time shows little noise.
Such a level may be too low to exclude all of the noise.
This algorithm and other available methods are therefore not optimal for peak peaking in LC-MS data.

Method used


Image

  • Peak selection in multidimensional data
  • Peak selection in multidimensional data
  • Peak selection in multidimensional data

Examples


Embodiment Construction

The present invention provides a method for automatic peak selection in multidimensional data. For illustration purposes, the invention will be described with respect to two-dimensional liquid chromatography-mass spectrometry (LC-MS) data. However, it is to be understood that the invention can be applied to any type of multidimensional data (i.e., two or more dimensions). The invention is particularly well suited to data that has different noise characteristics in different dimensions, or that has non-normally distributed noise, and that therefore cannot be processed effectively using standard multidimensional peak picking algorithms. However, the invention can equally well be applied to data characterized by normally distributed noise in all dimensions.

As used herein, multidimensional data refers to data that can be understood or characterized as having multiple independent variables and a single dependent variable. The dimensionality of the data refers to the number of independent...


PUM

PropertyMeasurementUnit
dimensionaaaaaaaaaa
threshold valueaaaaaaaaaa
thresholdaaaaaaaaaa

Abstract

An automatic peak selection method for multidimensional data that selects peaks from very noisy data such as two-dimensional liquid chromatography-mass spectrometry (LC-MS) data is described. Such data are characterized by non-normally distributed noise that varies in different dimensions. The method computes local noise thresholds for each one-dimensional component of the data. Each point has a local noise threshold applied to it for each dimension of the data set, and a point is selected as a candidate peak only if its value exceeds all of the applied local noise thresholds. Contiguous candidate peaks are clustered into actual peaks. The method is preferably implemented as part of a high-throughput platform for analyzing complex biological mixtures.

Description

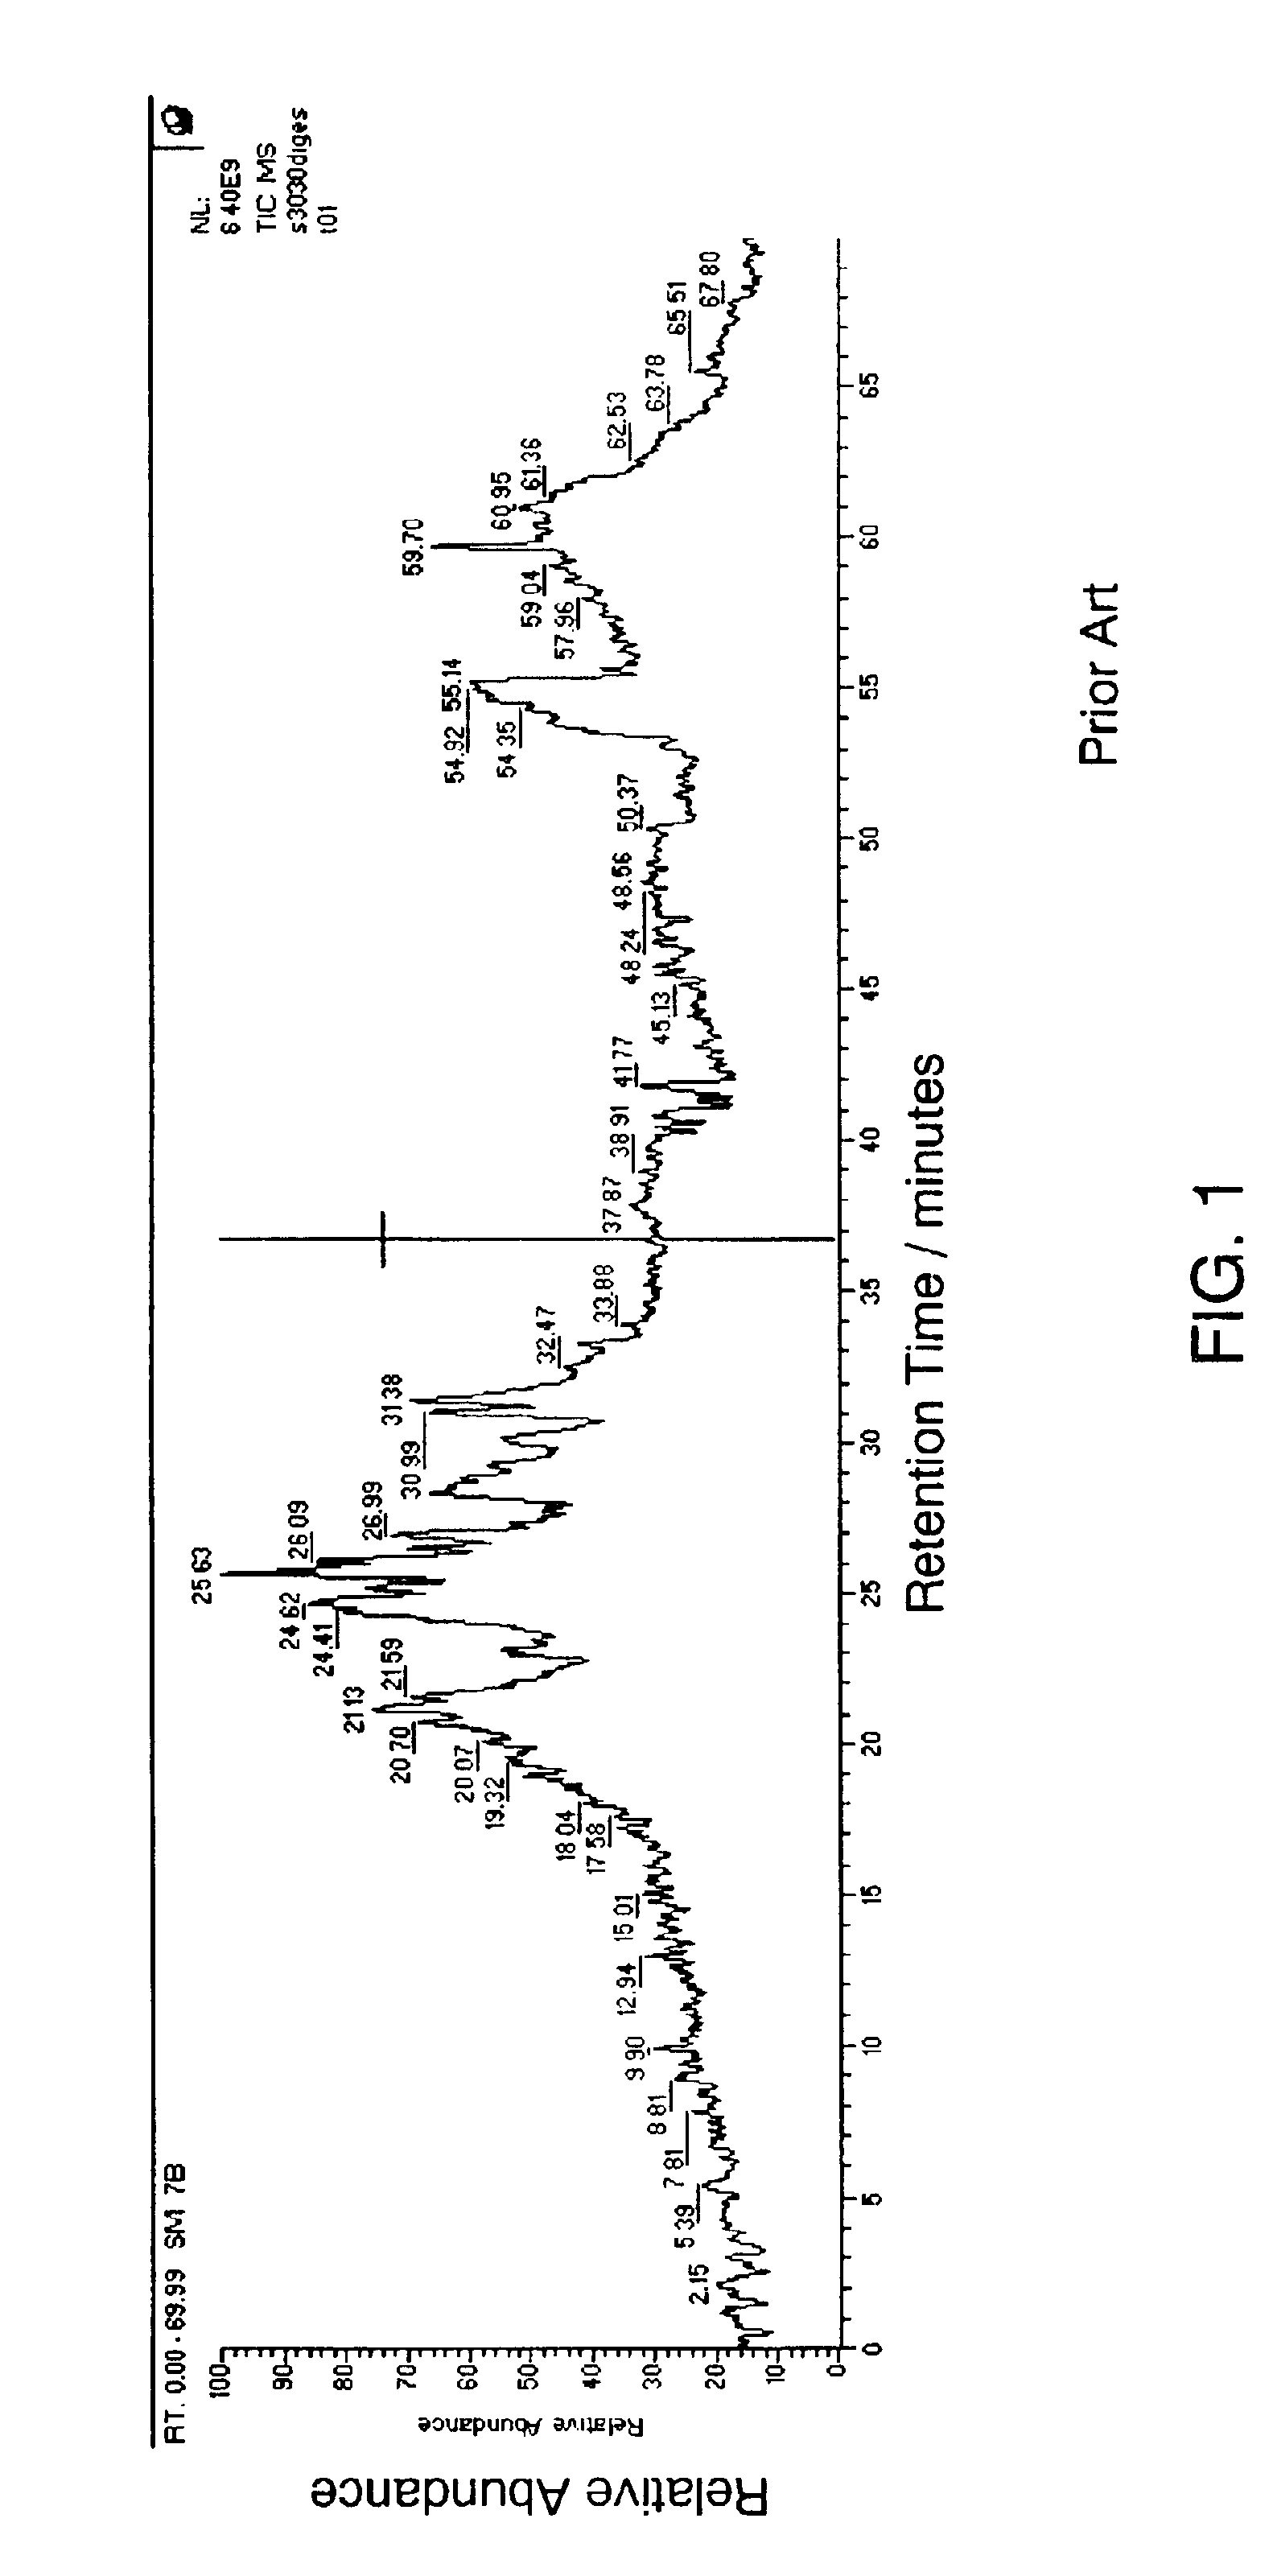
FIELD OF THE INVENTIONThis invention relates generally to analysis of data collected by analytical techniques such as chromatography and spectrometry. More particularly, it relates to a peak detection method for multidimensional data such as liquid chromatography-mass spectrometry (LC-MS) data.BACKGROUND OF THE INVENTIONLiquid chromatography-mass spectrometry (LC-MS) is a well-known combined analytical technique for separation and identification of chemical mixtures. Components of a mixture pass through a chromatographic column at different rates, and the eluent is subjected to mass spectrometric analysis at known time intervals. Data are acquired as a series of time-dependent mass spectra, i.e., ion intensity at varying mass-to-charge ratios (m / z).LC-MS data are typically reported by the mass spectrometer as a total ion current (TIC) chromatogram, the sum of all detected ions at each scan time. A TIC chromatogram of a proteolytic digest of human serum is shown in FIG. 1, with peaks...

Claims


Application Information

Patent Timeline
Patent Type & Authority Patents(United States)
IPC IPC(8): G01N27/447G01N30/86G01N30/00G01N30/72
CPCG01N30/8624H01J49/0036G01N30/72Y10T436/24G01N30/8634G01N30/8631
Inventor HASTINGS, CURTIS A.
Learn More