Design-based monitoring

a design-based monitoring and process monitoring technology, applied in semiconductor/solid-state device testing/measurement, instruments, originals for photomechanical treatment, etc., can solve the problem that the heuristic approach cannot select the optimal set of locations, and achieve the effect of minimizing the impact of testing on process throughput and maximizing the sensitivity of process deviation detection

Active Publication Date: 2006-11-14
APPL MATERIALS ISRAEL LTD
View PDF5 Cites 62 Cited by
  • Summary
  • Abstract
  • Description
  • Claims
  • Application Information

AI Technical Summary

Benefits of technology

[0008]The PDP data are transferred to the fab for use by process engineers in defining the monitoring steps to be performed on each die at each stage in production. Typically (although not necessarily), the PDP data are transferred together with the design of the reticle set to which the data apply. When different dies are combined in a common reticle set (so that multiple different ICs are produced on the same wafer), the PDP data may likewise be combined for monitoring purposes. The PDP data assist the process engineer in determining the appropriate test types and recipes to be used at each production stage and in choosing the locations to test. Judicious use of the PDP data can maximize the sensitivity of detection of process deviations and enable early discovery of process faults, while minimizing the impact of testing on process throughput.

Problems solved by technology

Given the extreme complexity of modern IC designs and production processes, it is almost inevitable that this heuristic approach will fail to select the optimal set of locations for testing.

Method used


Image

  • Design-based monitoring
  • Design-based monitoring
  • Design-based monitoring

Examples


implementation examples

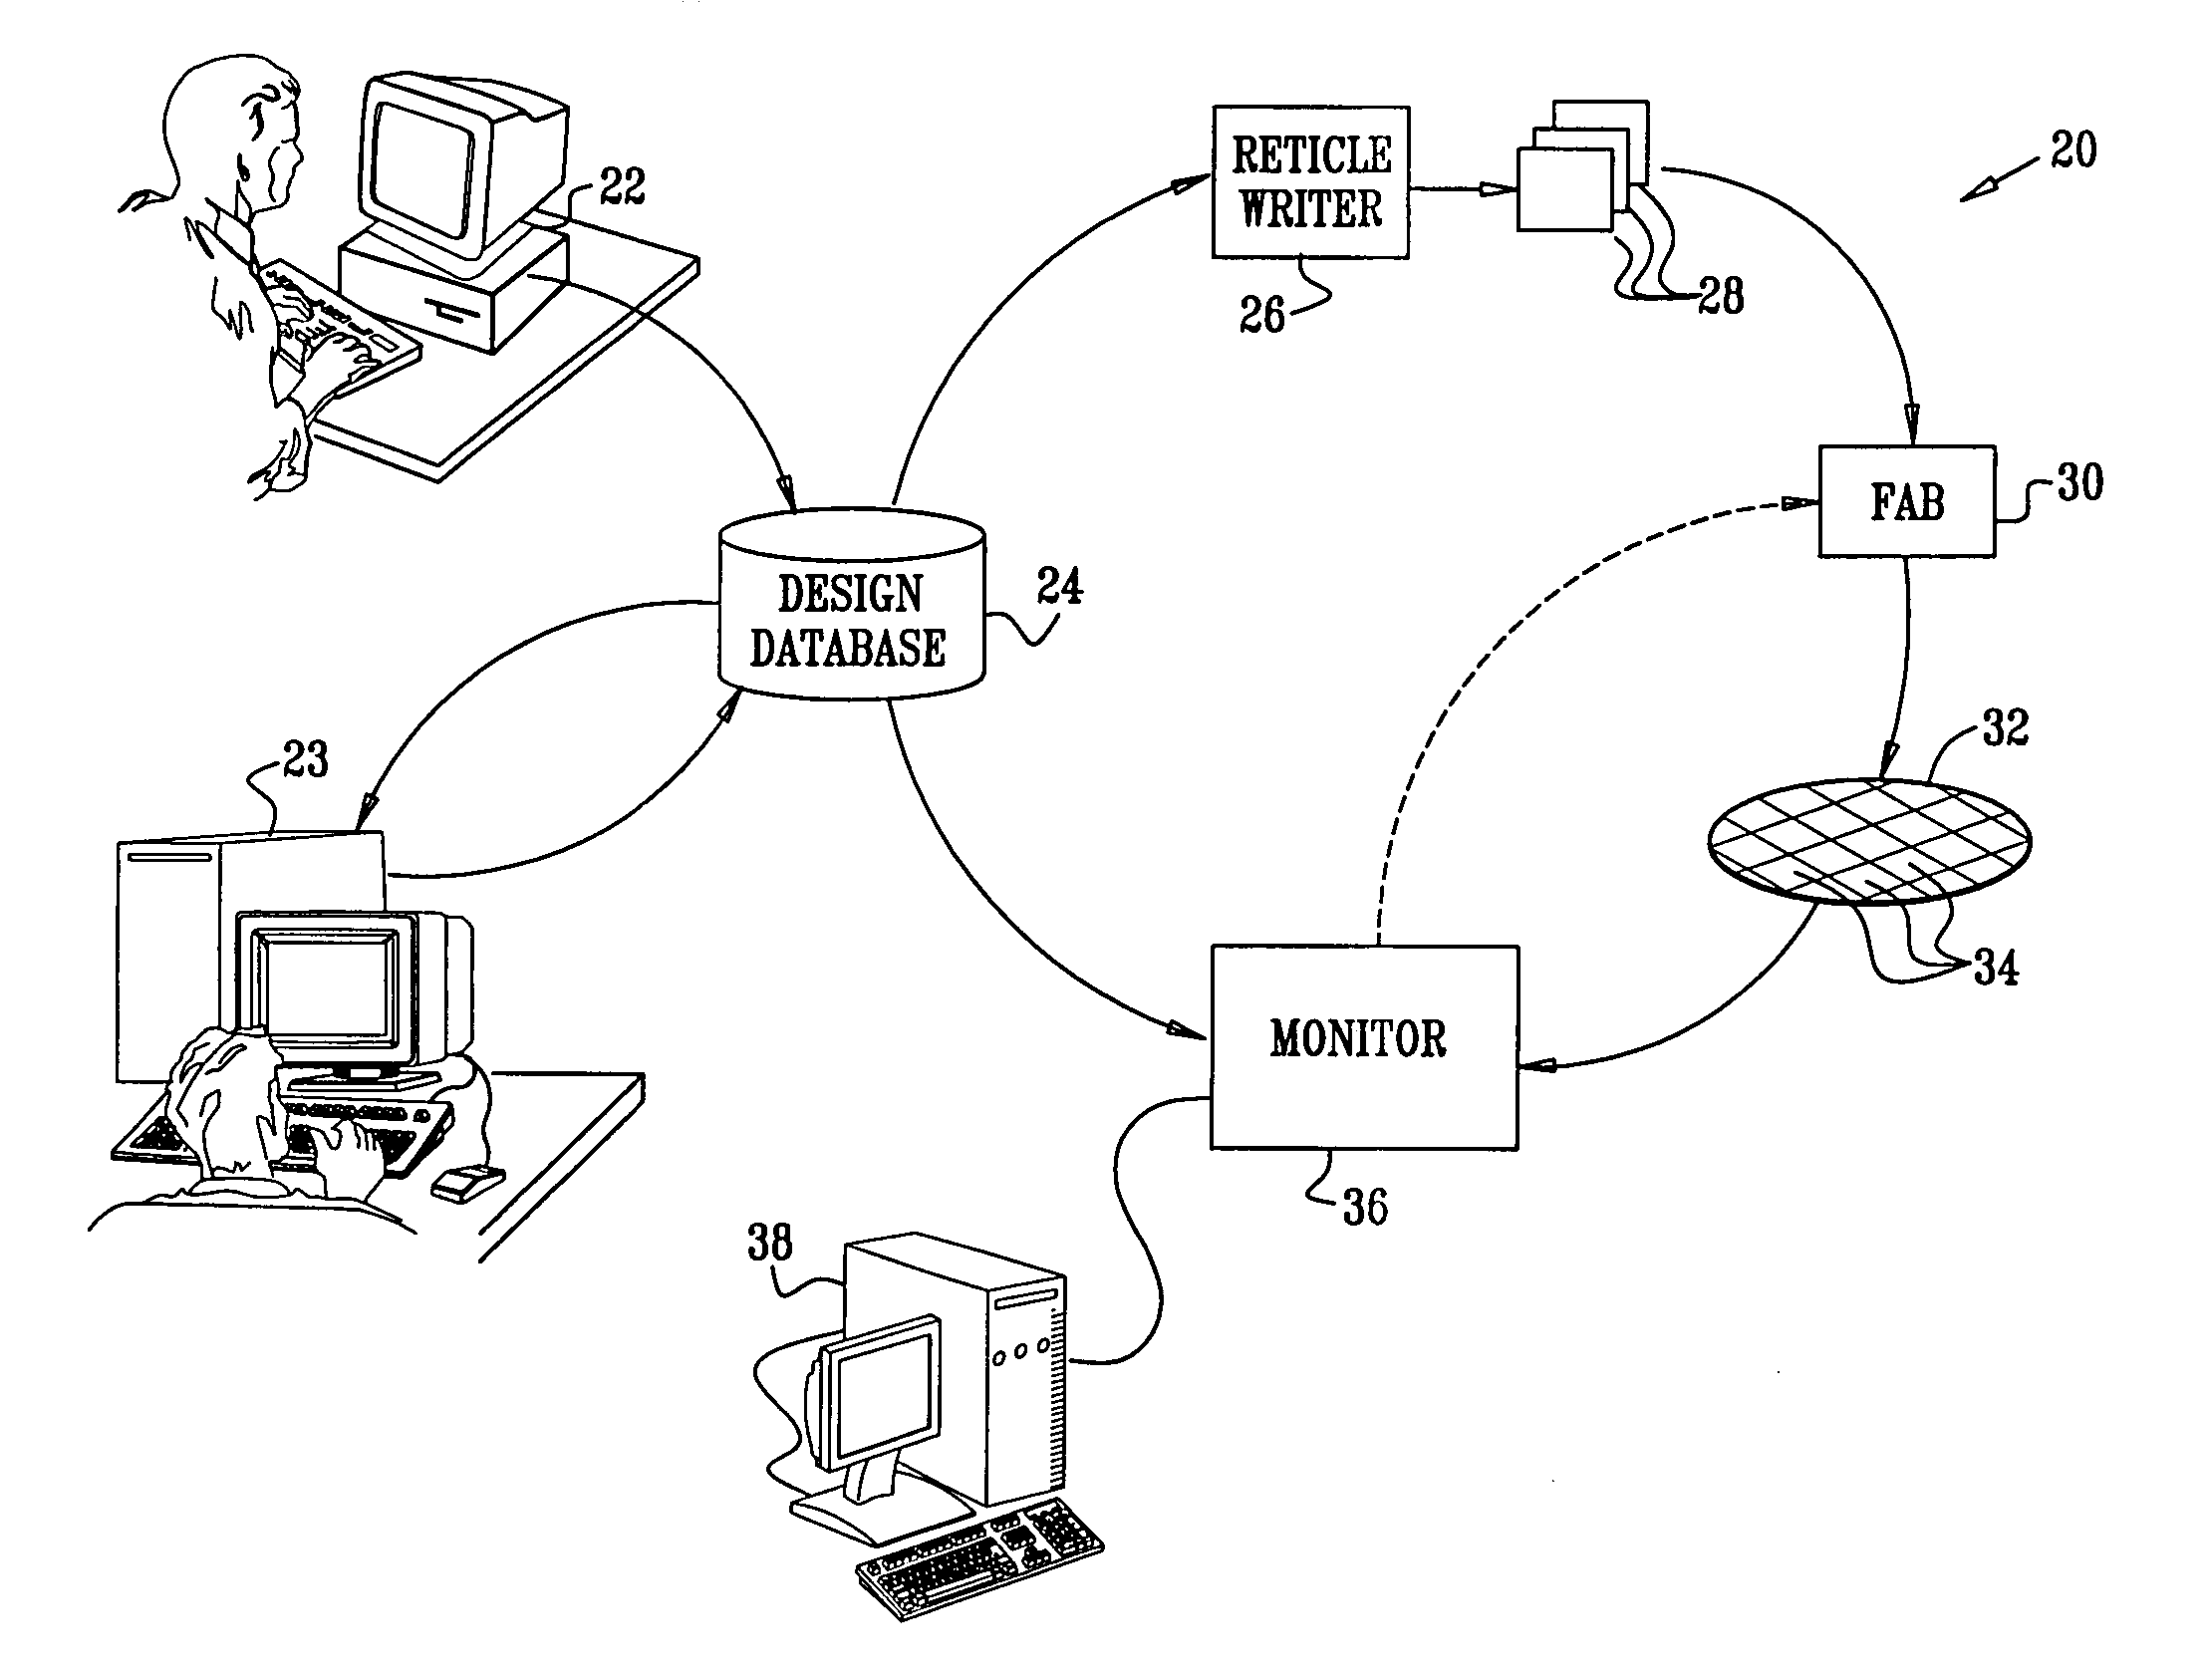
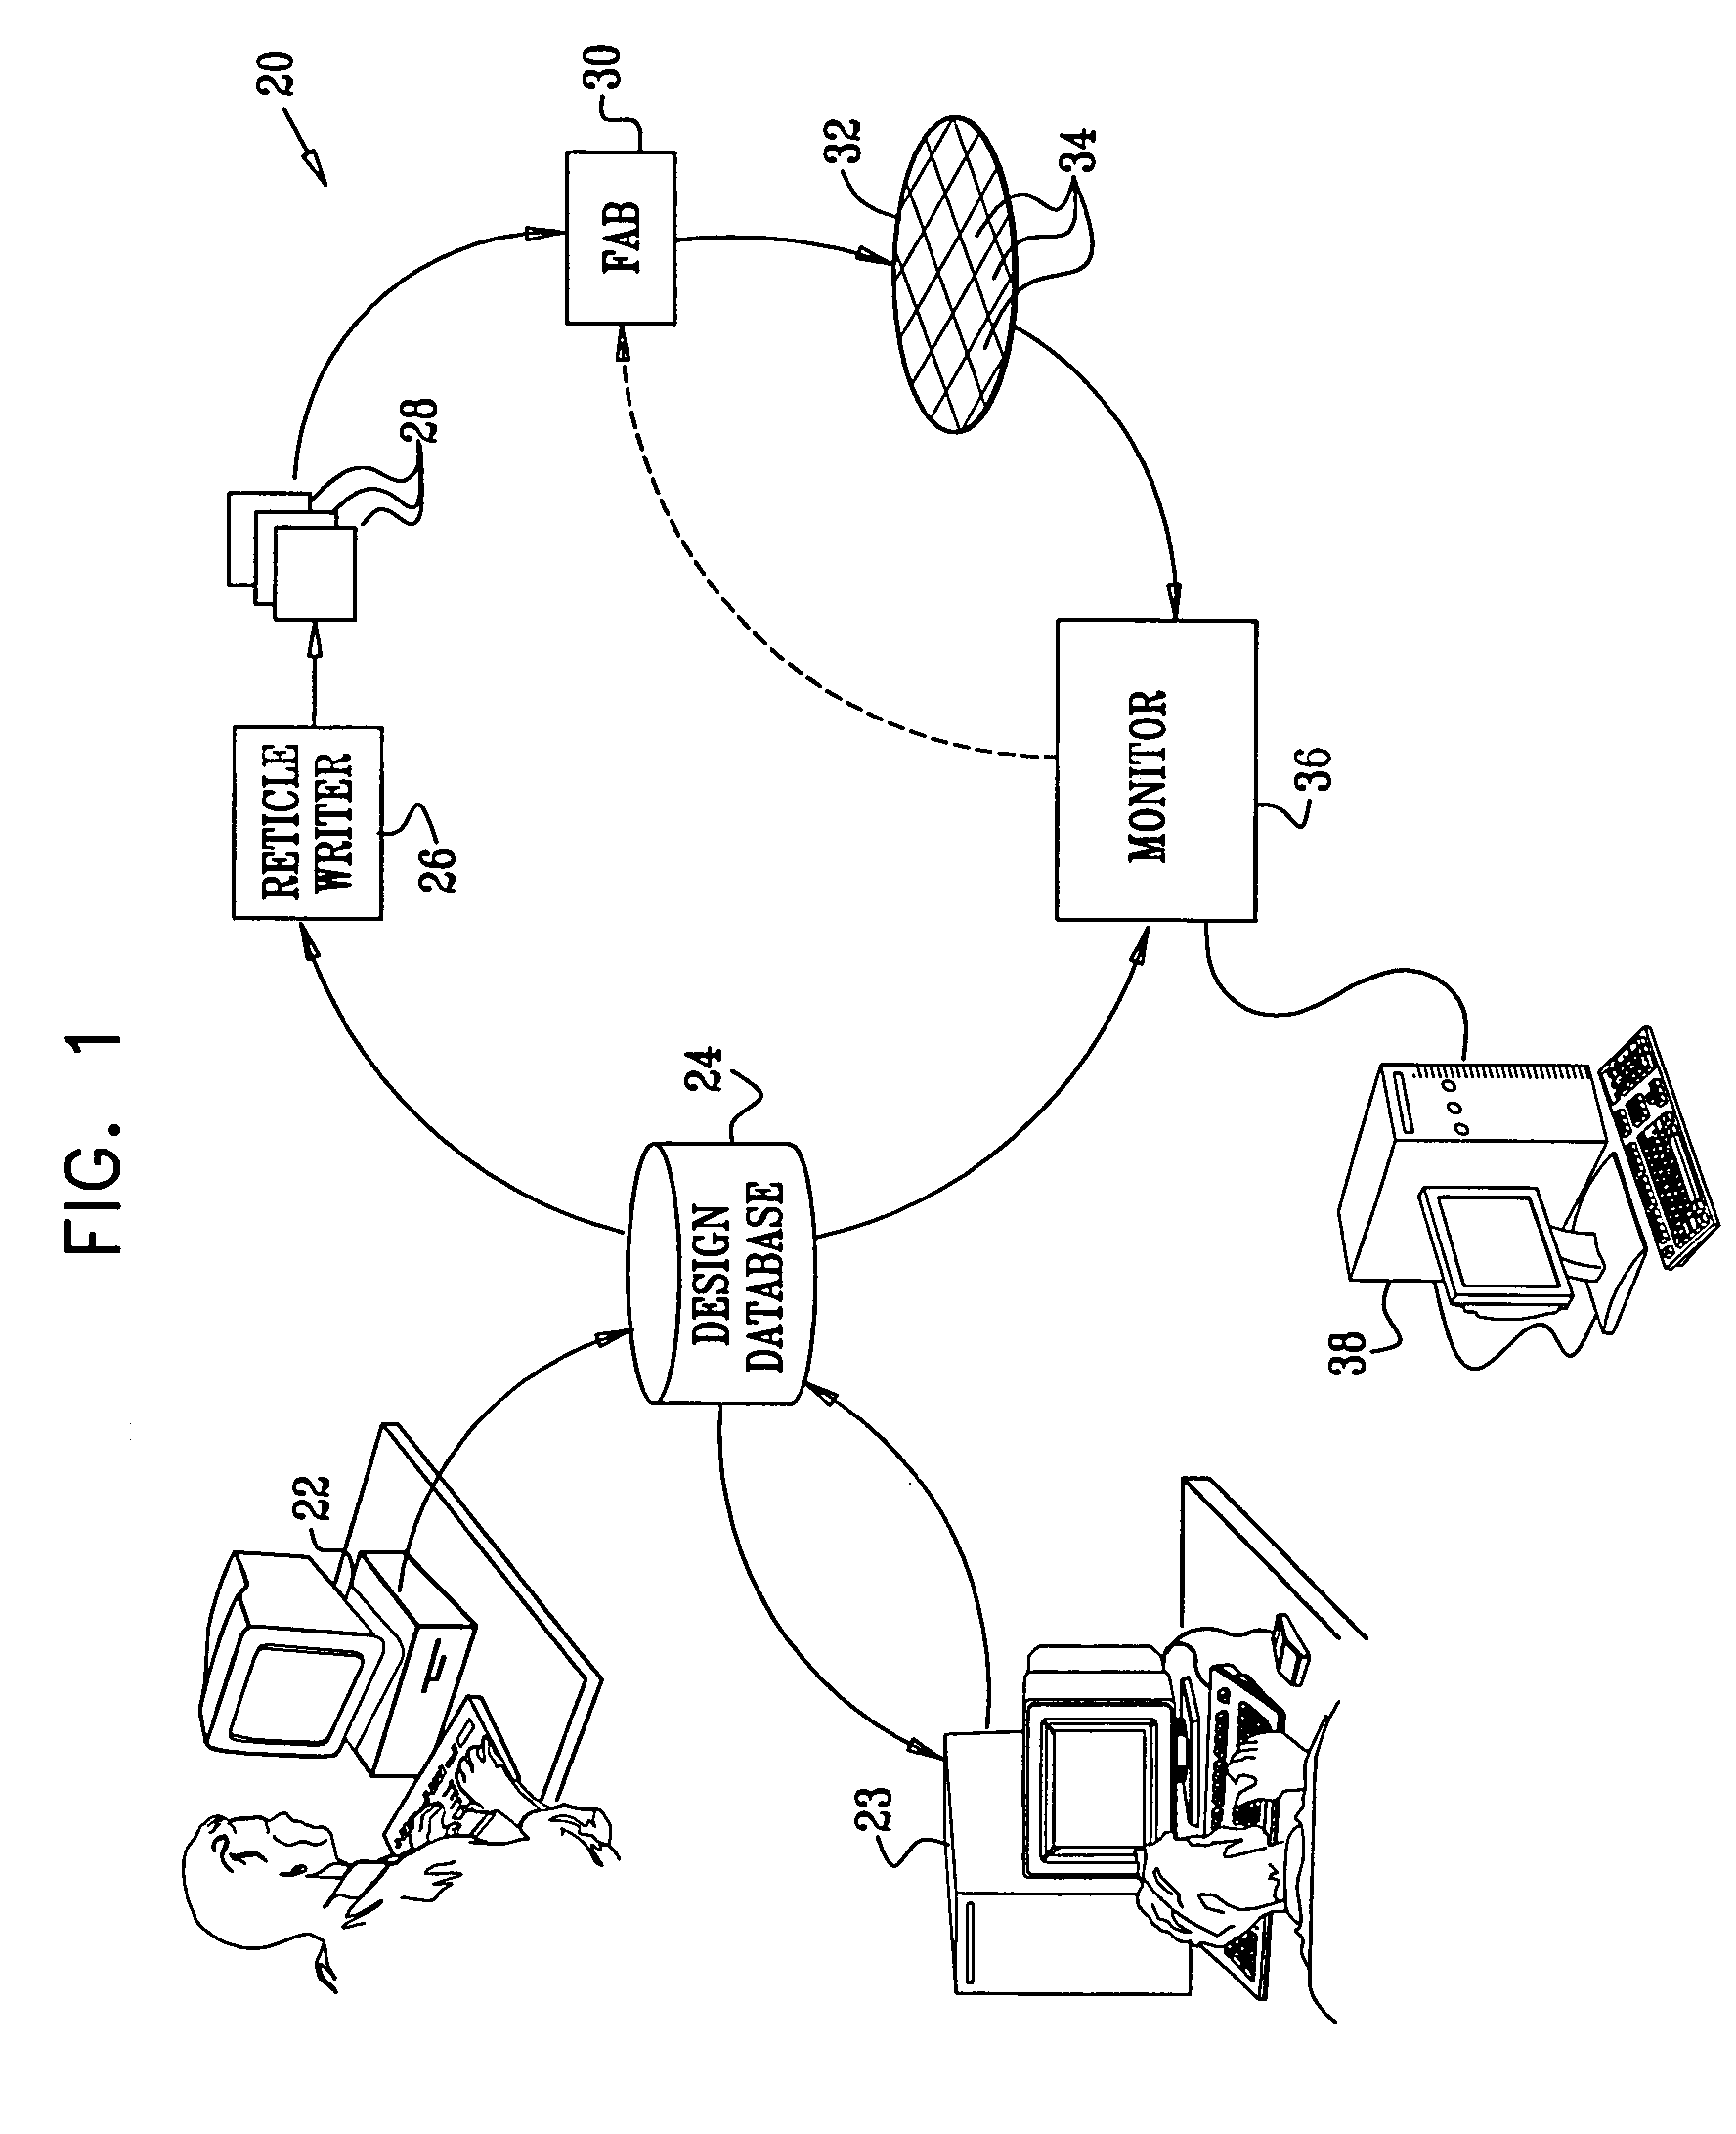
[0149]The following section lists a number of exemplary applications of the use of PDP data generated by EDA workstations 22 and 23 (FIG. 1) in driving process monitor 36. These applications may advantageously use the data structures defined above. Alternatively, the relevant PDP data may be conveyed from the EDA tools or database to the appropriate process monitoring tools in other forms and formats.

Selection of Inspection and Measurement Locations

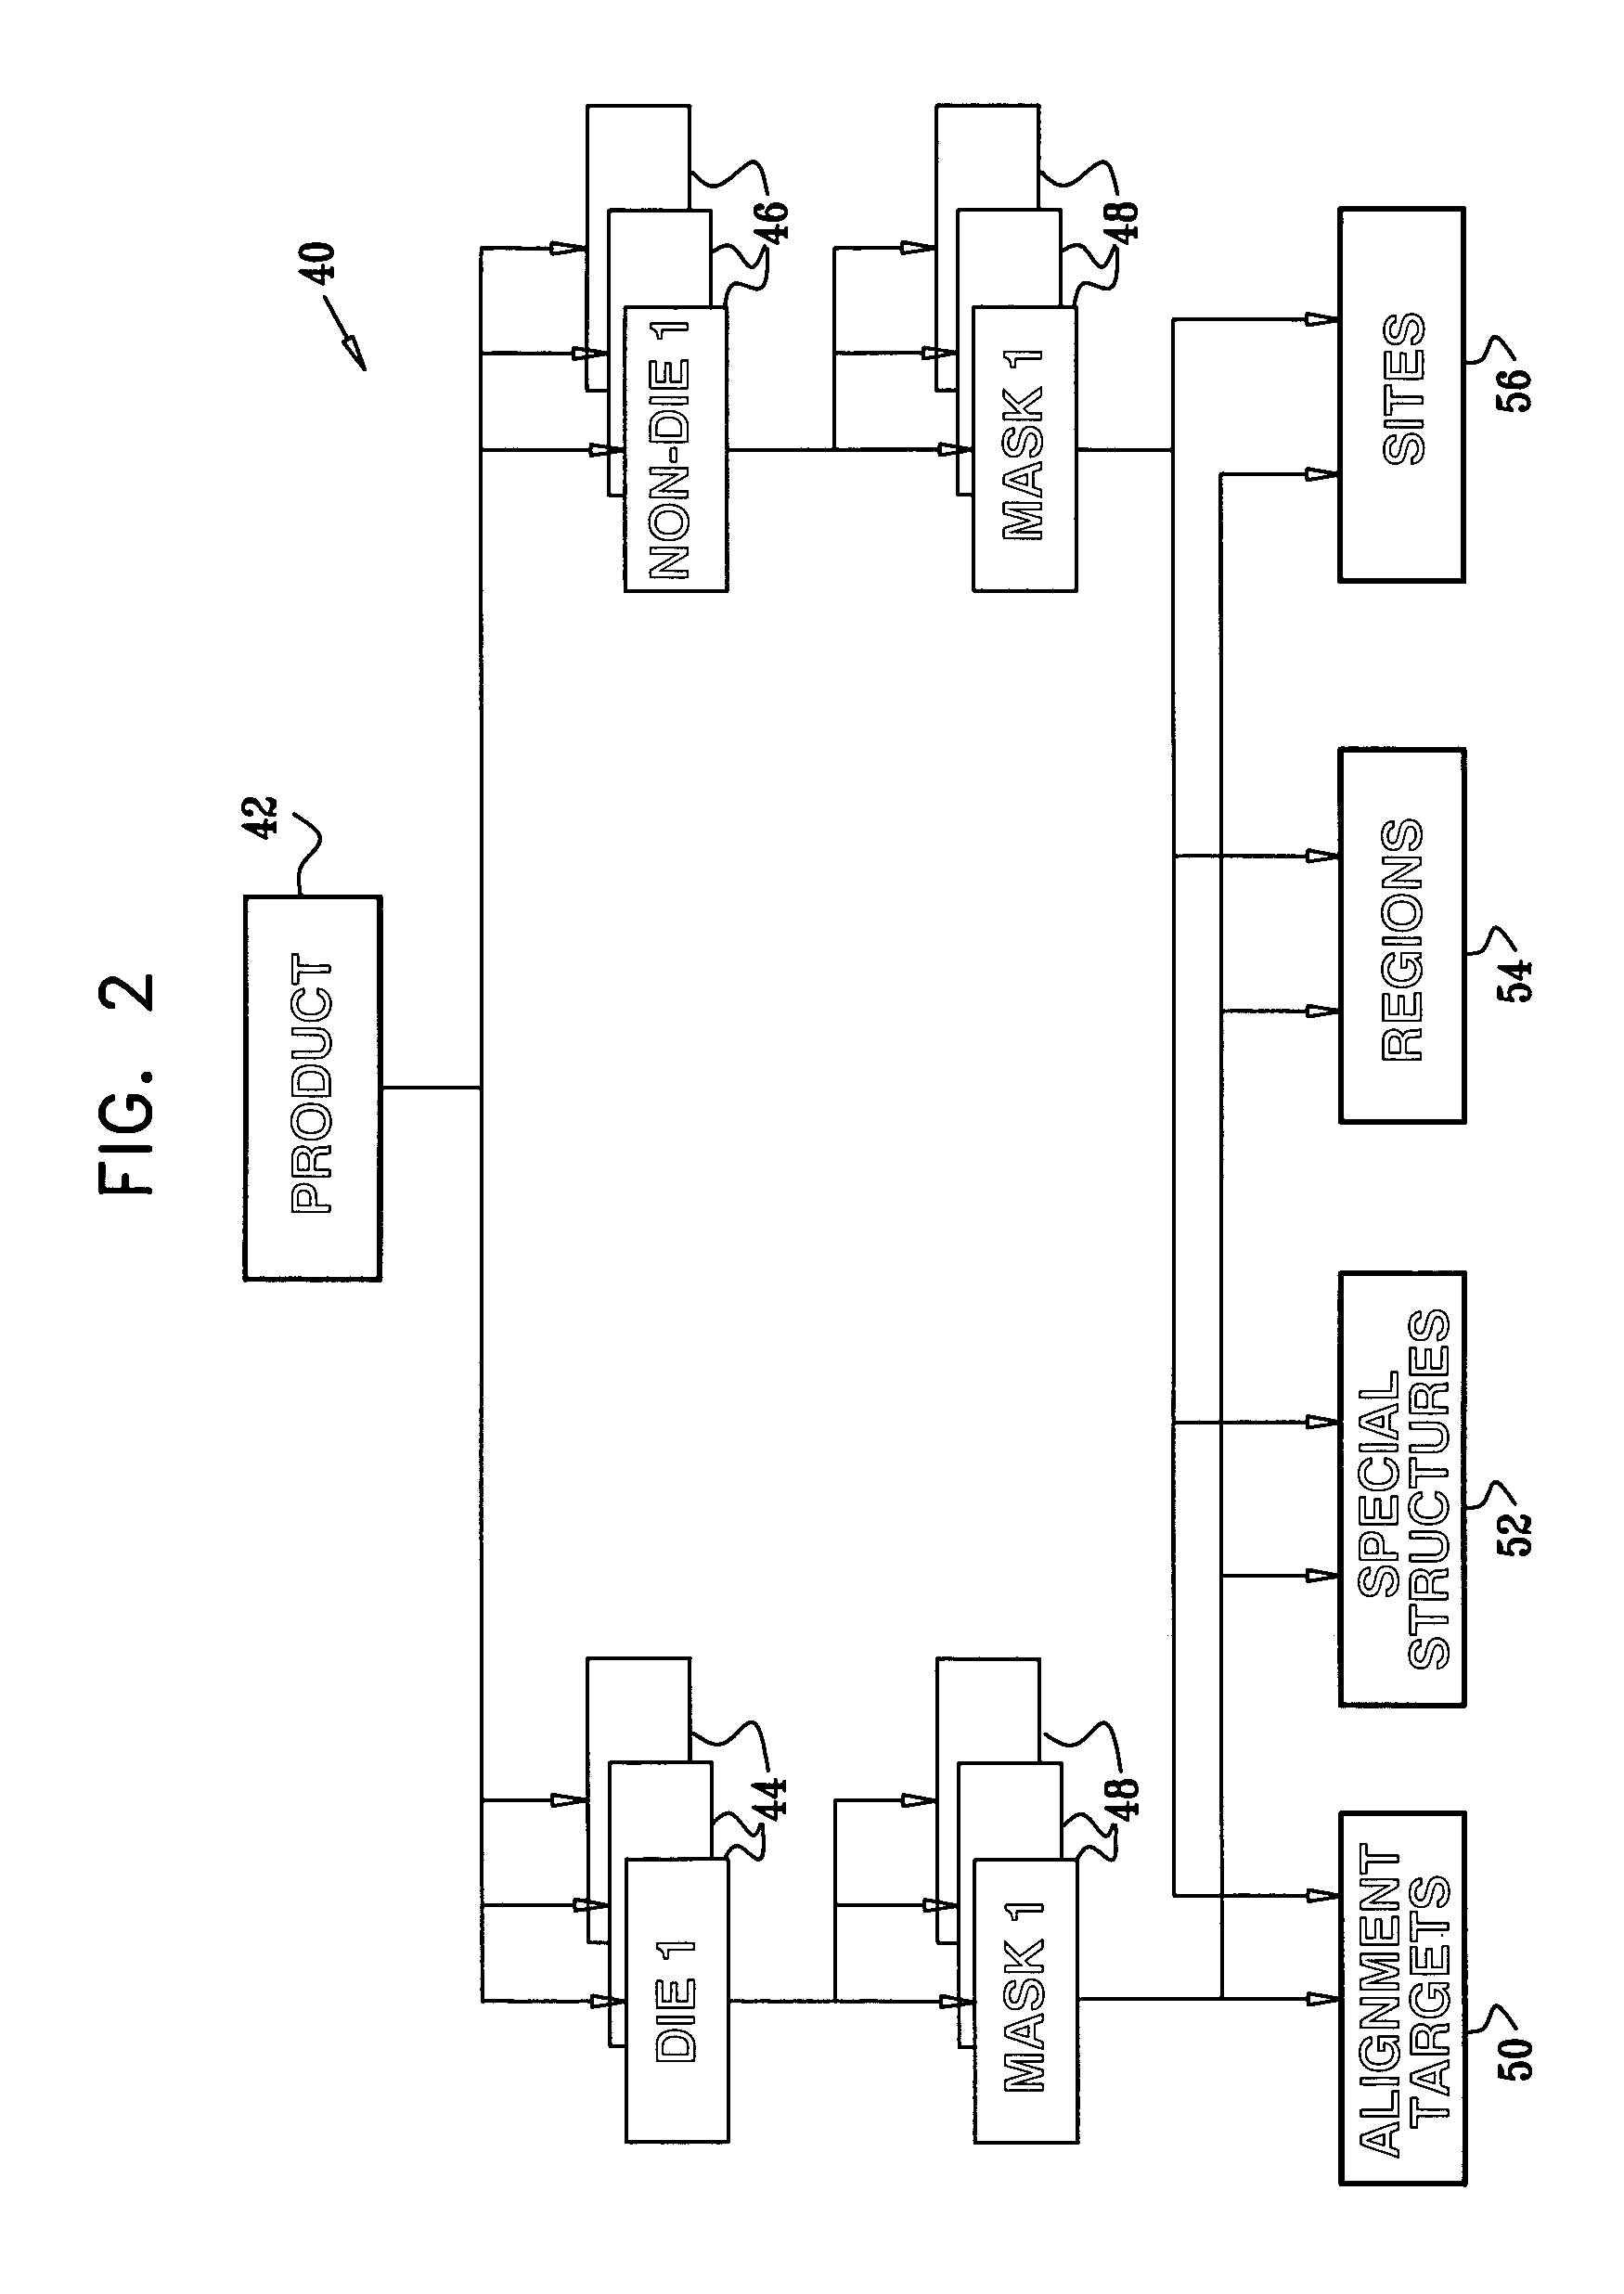
[0150]The PDP data may be used in selecting the locations on die 34 that are to be examined in a given monitoring step. This feature of the present invention is useful, for example, in automatic process inspection using e-beam and optical inspection tools, in critical dimension (CD) measurements and in other process monitoring applications. Typically, the locations for monitoring are those that are most susceptible to process faults, and are selected based on sites 56 that have been designated in the design and verification stages. As a r...


PUM

PropertyMeasurementUnit
dimensionaaaaaaaaaa
densityaaaaaaaaaa
optical inspectionaaaaaaaaaa

Abstract

A method for monitoring fabrication of an integrated circuit (IC) on a semiconductor wafer includes generating a product design profile (PDP) using an electronic design automation (EDA) tool, the PDP comprising an indication of a site in at least one layer of the IC that is susceptible to a process fault. Upon fabricating at least one layer of the IC on the wafer, a process monitoring tool is applied to perform a measurement at the site in at least one layer responsively to the PDP.

Description

CROSS-REFERENCE TO RELATED APPLICATION[0001]This application claims the benefit of U.S. Provisional Patent Application 60 / 486,565, filed Jul. 11, 2003, which is incorporated herein by reference.FIELD OF THE INVENTION[0002]The present invention relates generally to process monitoring, and specifically to methods and apparatus for inspection and testing of semiconductor wafers and reticles in production.BACKGROUND OF THE INVENTION[0003]Electronic design automation (EDA) tools are applied extensively in the design of integrated circuits and in verification of these designs. EDA tools are used, for example, in logic synthesis, placement and routing of circuit elements, circuit layout and design rule checking. At the end of the design process, a set of reticles (also referred to as masks or templates) is generated for use in producing the integrated circuit (IC). Each reticle corresponds to one layer of the thin film structures that will be fabricated on a semiconductor wafer to produce ...

Claims


Application Information

Patent Timeline
Patent Type & Authority Patents(United States)
IPC IPC(8): H01L21/66G03F1/00G03F1/14G06F17/50
CPCG03F1/144G03F1/36G03F1/84
Inventor NEHMADI, YOUVALPHUA, JOSEPHINEORBON, JR., JACOB JOSEPHBEN-PORATH, ARIELLEVIN, EVGENYBOKOBZA, OFER
Owner APPL MATERIALS ISRAEL LTD
Why Eureka
Try Eureka