
Eureka
For R&D, Eureka makes reading and utilizing patents & technical documents easy.
Eureka AIR
Designed for self-driven R&D workflows. Generate viable solutions, solve complex R&D challenges, empower your innovation with AI.

Eureka Materials
Designed for material experts only. Revolutionize your material R&D, from search, analyze, to developing new materials.

TechResearch
Generate reliable direction feasibility study reports for your R&D in just a few steps.

TechSeek
Discover and master advanced knowledge NOW. Basics, ideas, possibilities, all at once.

TechMind
As an expert in R&D Theories, TechMind can generates customized viable solutions instantly.

TechRisk
Analyze your overall solution with one click, know your potential R&D risks in advance.

TechMonitor
Get weekly tech updates, stay abreast of the latest tech innovations and key insights.
Real-time gene quantification with internal standards
- Summary
- Abstract
- Description
- Claims
- Application Information
AI Technical Summary
Benefits of technology
Problems solved by technology
Method used
Image

Examples
example 1
[0092]The following experiment is conducted to confirm that equal concentrations of initial target and competitor template give equal second derivative maxima.
[0093]Equal concentrations of purified target and competitor PCR are mixed together at concentrations ranging from 10 to 106 copies per reaction in 10 fold steps and amplified for 35 cycles. The positions of the second derivative maximum for all of the target and competitor pairs are compared and it is expected that the second derivative maxima are the same for equal concentrations. This experiment is repeated five times and statistical tests are conducted to determine if a zero difference in crossing point is within the 95% confidence interval of Δn. If the difference is not zero, but the difference is consistent, a “ΔΔn” can be used, that is, the difference in curve position less any systematic difference between the two channels.
example 2
[0094]The following experiment is conducted to confirm that the dynamic range of the assay is at least an order of magnitude on either side of the target concentration.
[0095]If either the target or the competitor is present in great excess, the more concentrated product will reach a plateau before the less concentrated product rises above the detection limit of the instrument. The LIGHTCYCLER® has a detection range of approximately two orders of magnitude. This detection range defines the upper limit of the dynamic range. A minimum dynamic range of at least a one order of magnitude difference is desirable.
[0096]The maximum difference in target / competitor ratio that still allows both products to be detected is tested. Target at 104 copies per reaction is mixed with competitor ranging from 102 to 106 copies per reaction in one third log steps. A dynamic range of between one and two orders of magnitude is expected. The target copy number is calculated using the kinetic method and is co...
example 3
[0098]The following experiment is conducted to determine the effect of target copy number on the accuracy and precision of the assay.
[0099]Results of the PCR experiments are analyzed for precision and accuracy. For each starting copy number of target from 101 to 106, a 95% confidence interval is calculated. The inter-assay and intra-assay precision is also calculated by measuring the coefficient of variation (% CV) within and across experiments for each starring copy number of target from 101 to 106. At 101 or 102 copies, it is expected that the % CVs will be around 100%. At the higher copy numbers the % CVs are expected to be around 25%. A 25% CV would allow easy discrimination of two-fold differences.
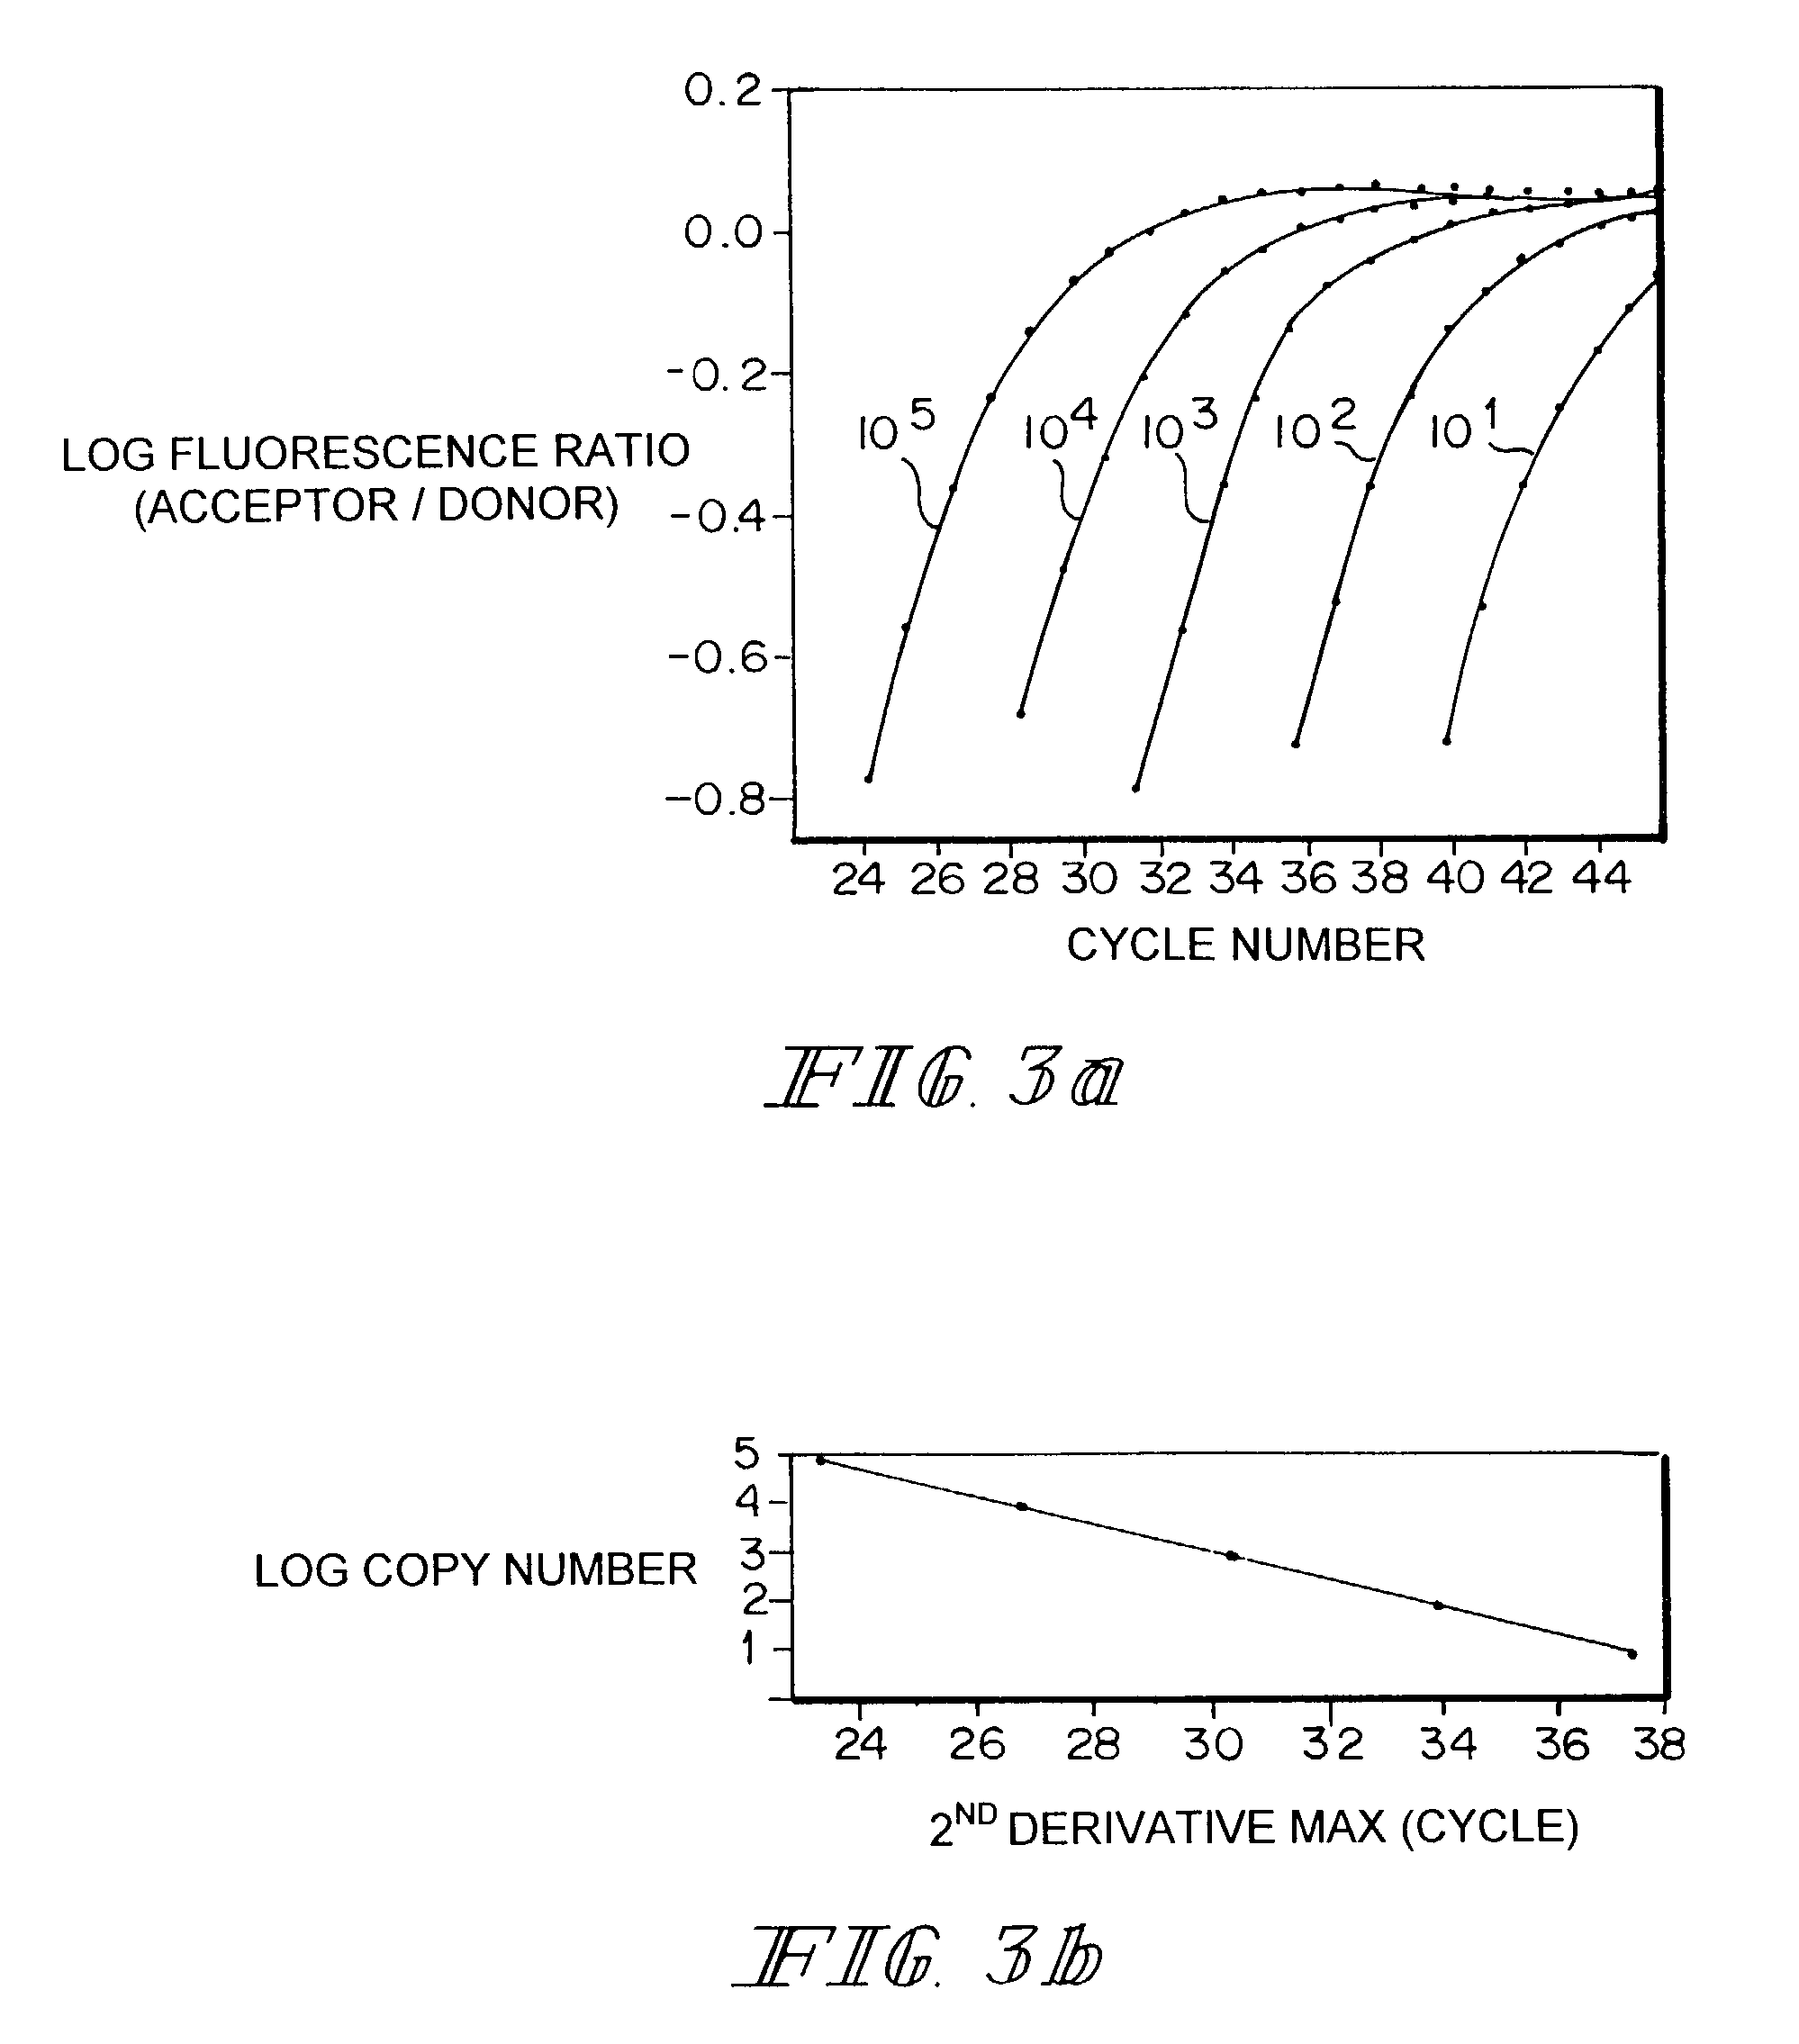
[0100]The curve positions are calculated using the second derivative maximum method. This method, which depends on curve shape and not absolute signal, is believed to be more resistant to differences in signaling efficiency between the channels. The cycle shift is plotted agai...
PUM
| Property | Measurement | Unit |
|---|---|---|
| Fraction | aaaaa | aaaaa |
| Fraction | aaaaa | aaaaa |
| Fraction | aaaaa | aaaaa |
Abstract
Description
Claims
Application Information
 - R&D Engineer
- R&D Manager
- IP Professional
- Industry Leading Data Capabilities
- Powerful AI technology
- Patent DNA Extraction
Browse by: Latest US Patents, China's latest patents, Technical Efficacy Thesaurus, Application Domain, Technology Topic, Popular Technical Reports.
© 2024 PatSnap. All rights reserved.Legal|Privacy policy|Modern Slavery Act Transparency Statement|Sitemap|About US| Contact US: help@patsnap.com