
Method for analysis metabolite difference between biological samples

a biological sample and metabolite technology, applied in chemical methods analysis, instruments, withdrawing sample devices, etc., can solve the problems of difficult quantitative analysis, difficult to acquire a reference standard of all metabolites, and research has not been almost applied in the field of methods for analysing metabolite differences between biological samples

Inactive Publication Date: 2010-03-16
KOREA INST OF SCI & TECH
View PDF4 Cites 3 Cited by
  • Summary
  • Abstract
  • Description
  • Claims
  • Application Information

AI Technical Summary

Benefits of technology

Effectively extracts and analyzes all metabolites, enabling accurate metabolite profiling and disease diagnosis by statistically verifying differences between groups with high discrimination accuracy.

Problems solved by technology

However, there are various metabolites in the organism and it is very difficult in a test to acquire a reference standard of all the metabolites and to conduct a quantitative analysis of it.
However, regarding all the animal samples including human, an extract method and an analysis are complicated, there are differences between the individual organisms and an analysis method which is an indicator does not exist, so that the above research has not been almost applied.

Method used


Image

  • Method for analysis metabolite difference between biological samples
  • Method for analysis metabolite difference between biological samples
  • Method for analysis metabolite difference between biological samples

Examples


embodiment 1

Extracting a Metabolite from a Biological Sample with a Standard Extraction Method and Analyzing it with a Chromatography Analysis Device

[0027]1.1 Obtaining the Fraction 1

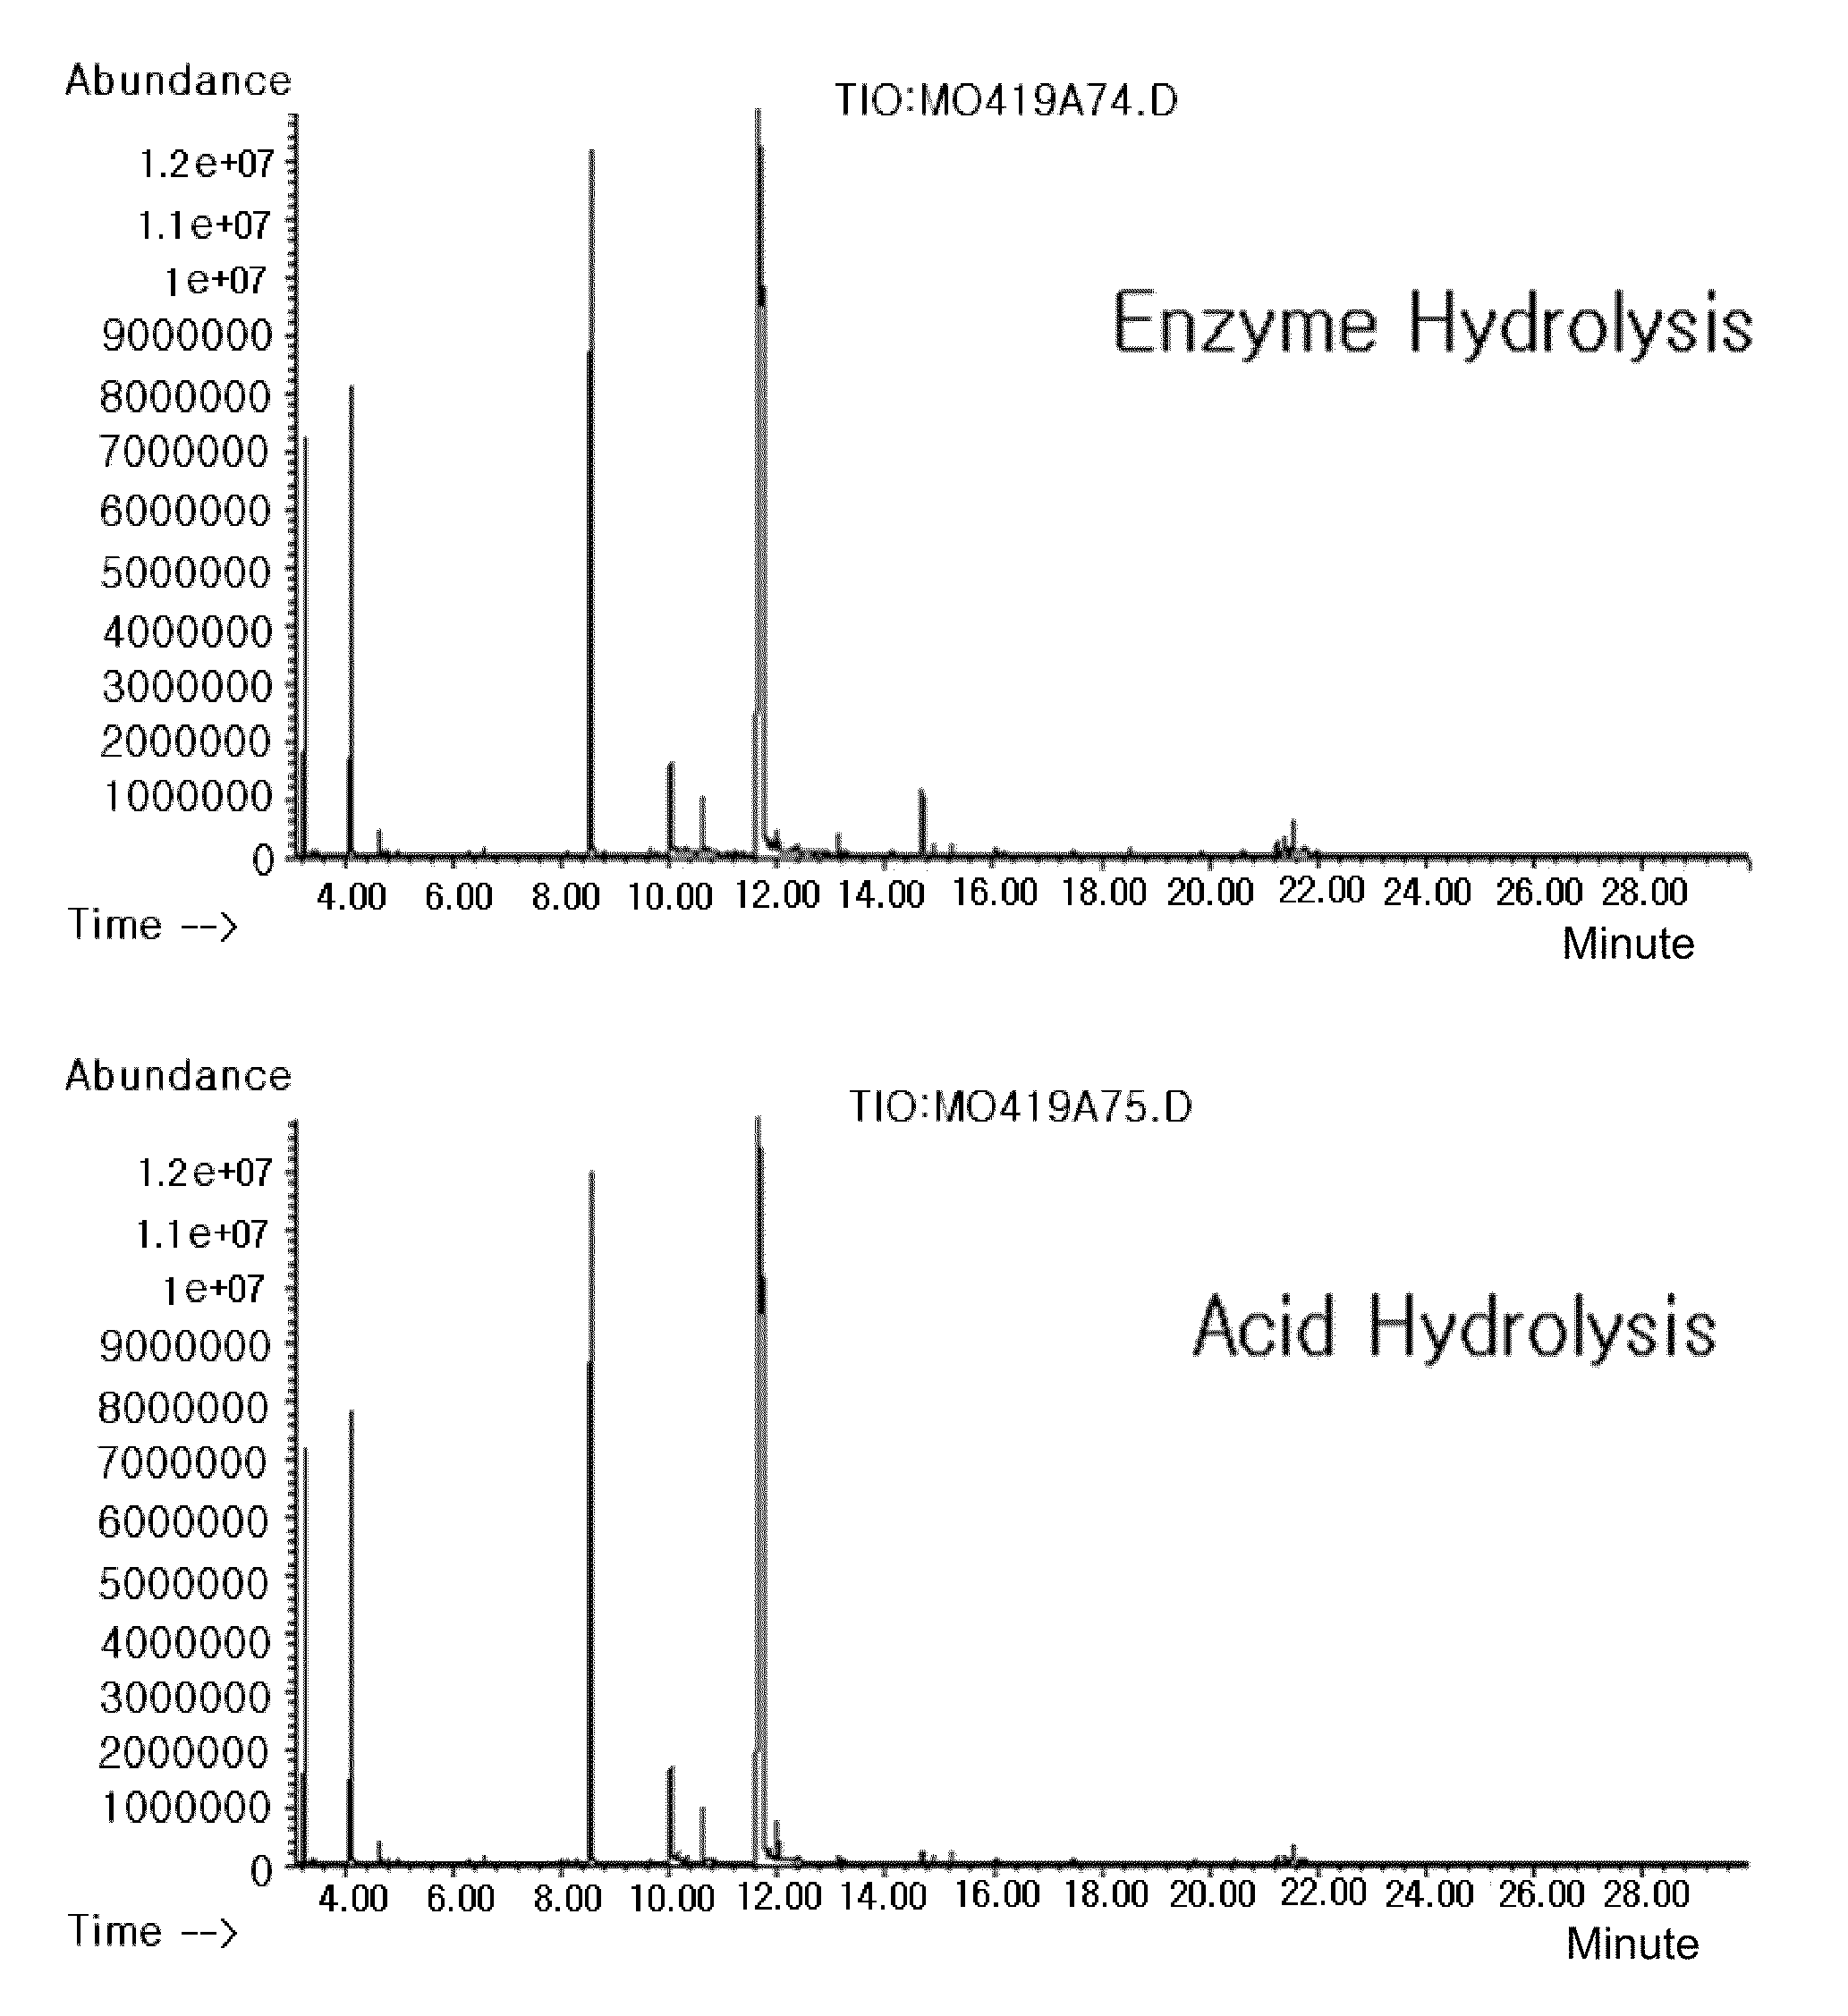
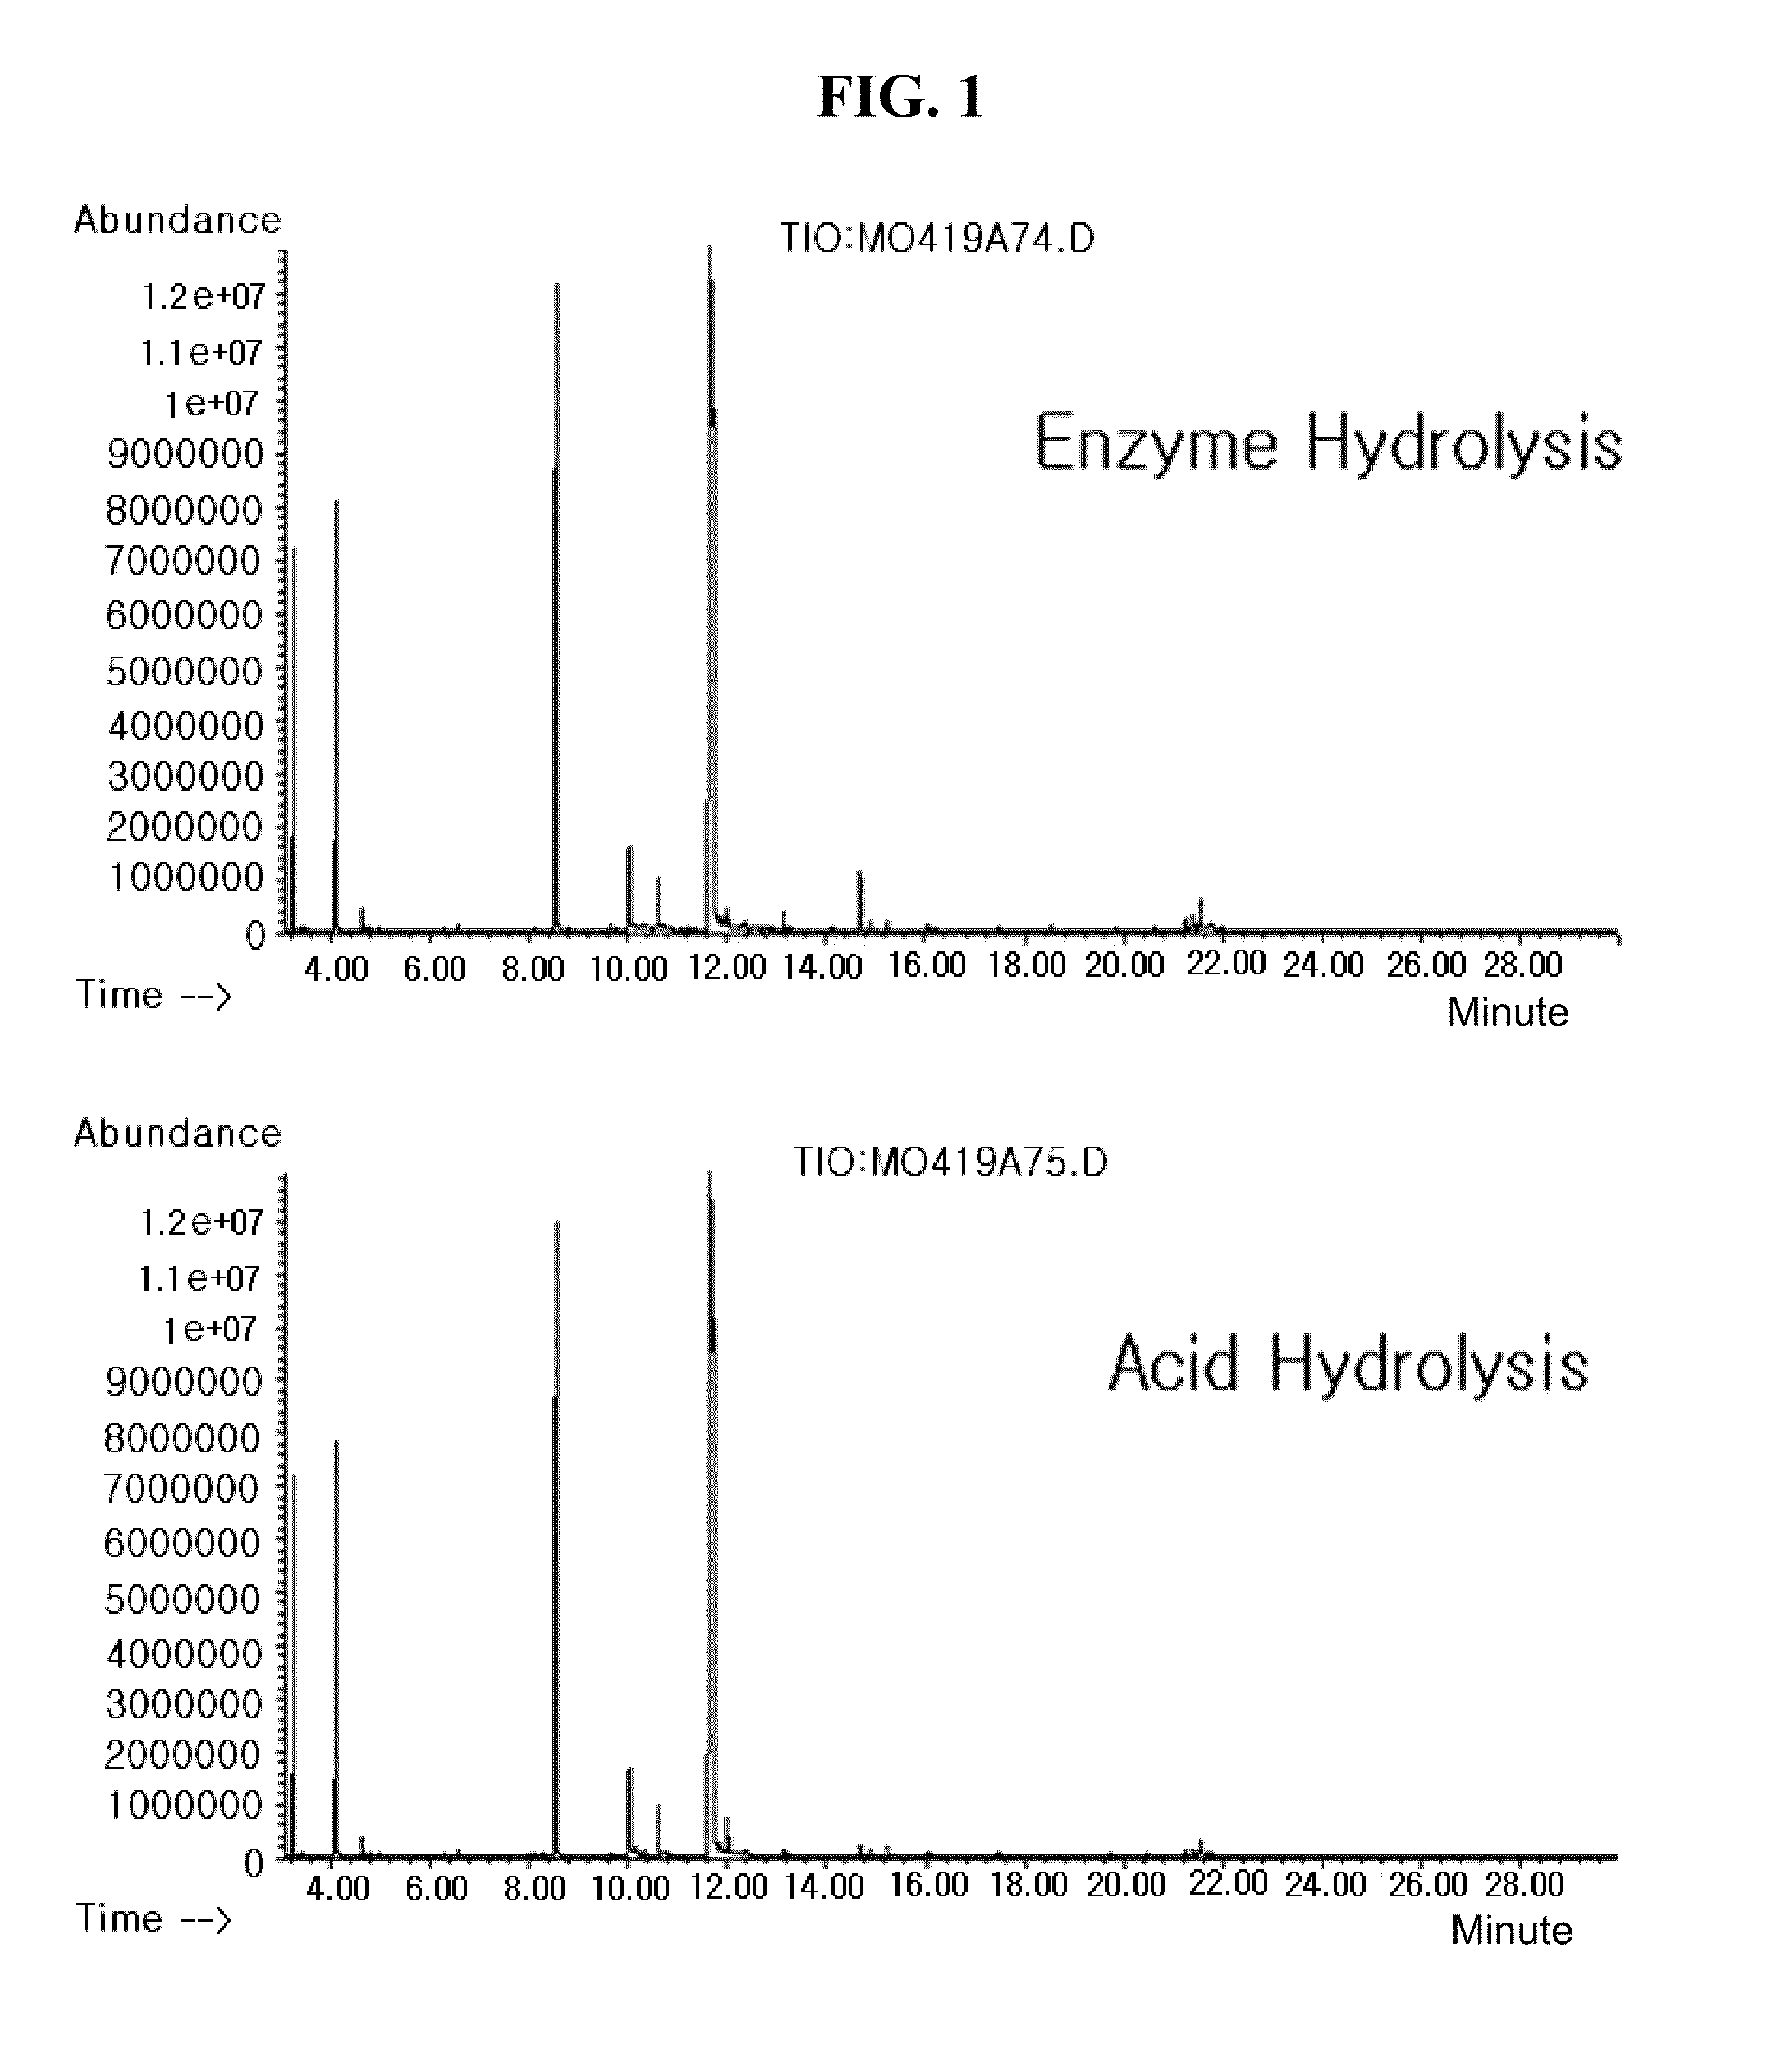
[0028]Strata X® (Phenomenex, Torrance, Canada; styrene-divinyl benzene polymer having a surface specially treated for keeping an analysis material from being discharged from a cartridge using a π-π interaction) cartridge was mounted to a solid phase extraction vacuum manifold, which was added with methanol 1 ml to activate it and then washed with water 1 ml, thereby carrying out a pre-treatment. Urine 1 ml, which was obtained from 10 prostatic hypertrophy patients (average age: 60±5 years) and 10 normal males (average age: 58±7 years) whose age is matched with that of the patients, was loaded to the cartridge, water 1 ml was again added to wash it and then methanol 4 ml was made to flow, thereby discharging an analysis-object material. Among them, only 0.3 ml was taken and evaporated and dried with a vacuum rotary ...

embodiment 2

Converting the Analysis Result of the Chromatography into Numerical Values which can be Statistically Processed

[0039]The areas or heights of the peaks occurring in the chromatograms of the respective fractions represent the concentration or the quantity of the metabolites in the sample. Since the peaks are not always generated as a predetermined number at a fixed time, they cannot be applied to the statistical process in which the number of variables should be constant.

[0040]In order to solve the problem, the total analysis time of 30 minutes were divided at an interval of 1 minute so that the time interval was same, and one of the peaks, which occurred for 1 minute, having the largest area was determined as a representative value, thereby conducting a statistical process.

embodiment 3

Statistically Verifying a Difference Between Two Biological Samples Using the Converted Numerical Values

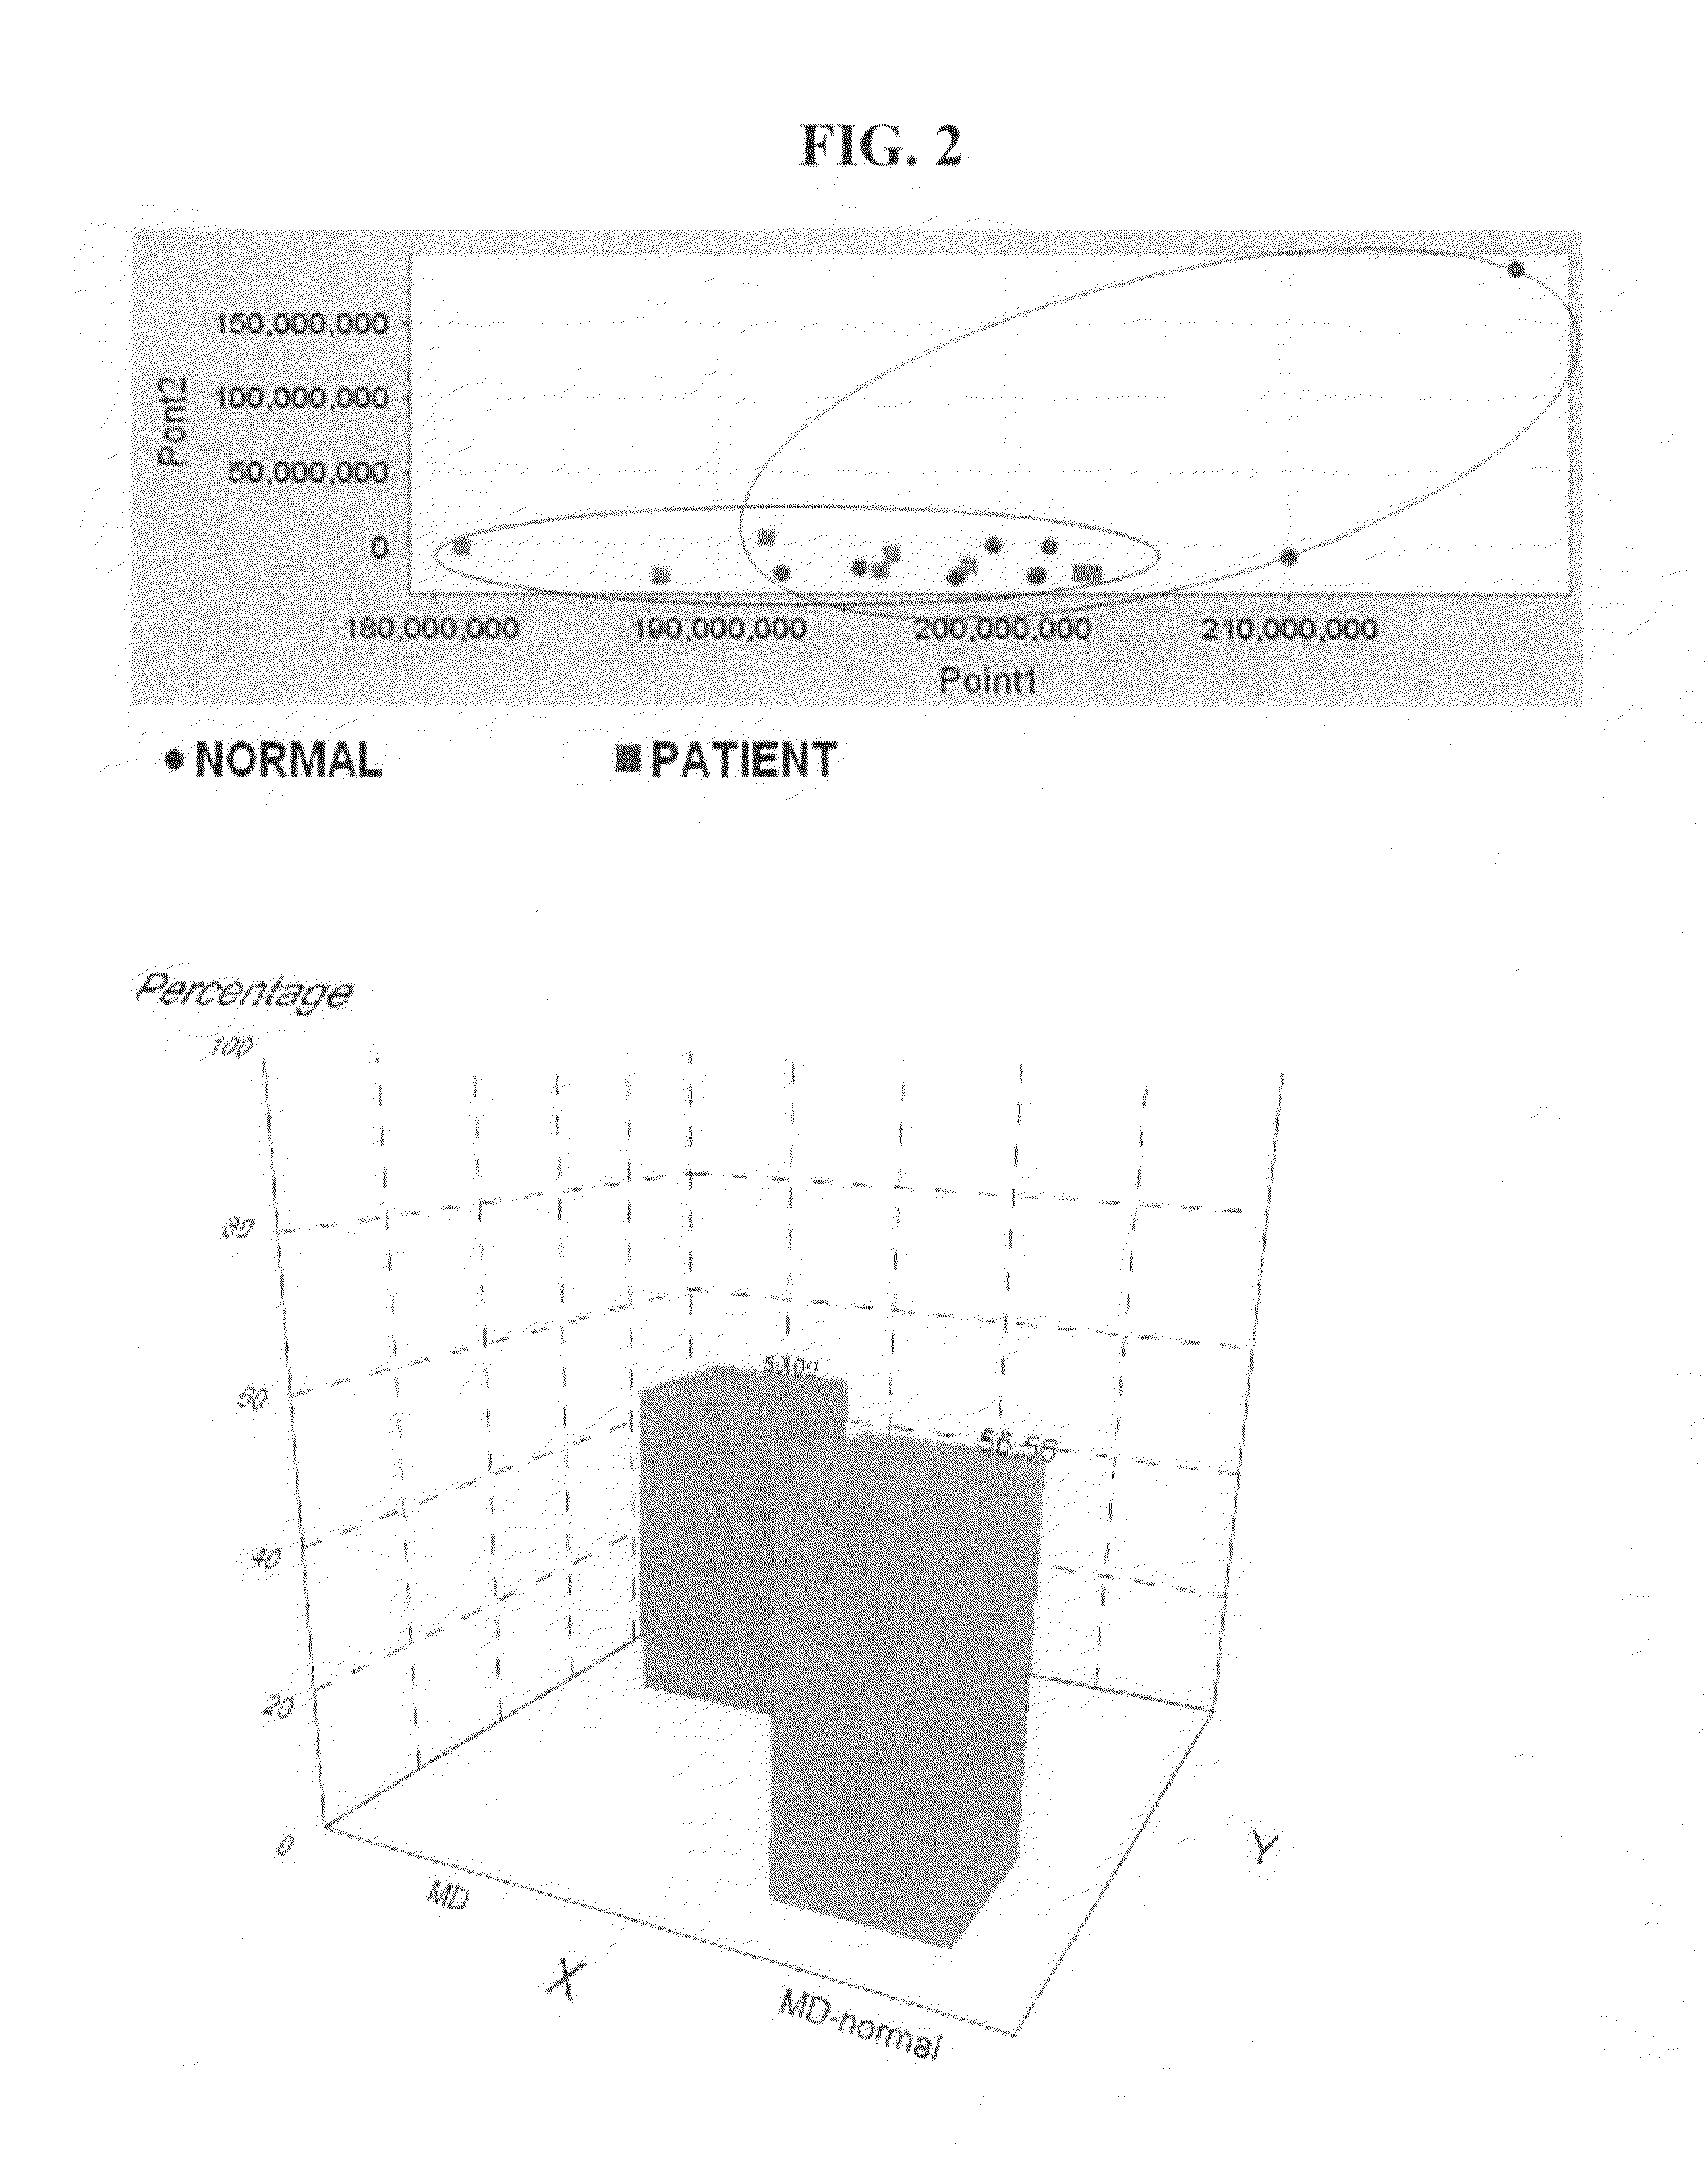
[0041]As the statistical process method for the global metabolomics, the principal component analysis and the discriminant analysis were used. A leave-one out method (when the number of samples is assumed to be 100, a control group is made for the 99 samples and it is determined whether the remaining one sample belongs to a normal group or a disease group) was adopted for the discriminant analysis. It was measured an accuracy in discriminating the unknown sample as a normal person or a prostatic hypertrophy patients with the results obtained from the discriminant analysis.

[0042]As a result, clustering patterns discriminating between the group of the normal people and the group of patients were exhibited in the principal component analysis of the fraction 2 (fraction obtained by the liquid-liquid extraction at pH 5.2 after the solid phase extraction, FIG. 3) and the fraction 3 (fra...


PUM

PropertyMeasurementUnit
pHaaaaaaaaaa
pHaaaaaaaaaa
thicknessaaaaaaaaaa

Abstract

Disclosed is a method of extracting all metabolites existing in a biological sample to detect a comprehensive difference between metabolites of a control group and a test group, thereby verifying significance thereof. More particularly, the invention comprises a first step of analyzing a fraction extracted with a solid phase extraction method, a fraction obtained by extracting the remnant fraction with a liquid-liquid extraction method and fractions extracted with the liquid-liquid extraction method at two pH different from each other after the hydrolysis, with a gas chromatography-mass spectrometry; a second step of converting the chromatogram result into numerical values capable of being statistically processed; and a third step of analyzing the numerical values with a principal component analysis (PCA) and a discriminant analysis (DA) to detect a difference between the control group and the test group. According to the invention, the difference between the two groups can be comprehensively detected with the areas of the peaks on the chromatogram, without a standard material or verified quantitative method. Therefore, it is possible to detect the metabolic change in the organism due to the disease or gene mutation, without an accurate quantitative analysis of the metabolites.

Description

CROSS-REFERENCE TO RELATED APPLICATION[0001]This application claims all benefits of Korean Patent Application No. 10-2006-0094002 filed on Sep. 27, 2006 in the Korean Intellectual Property Office, the disclosures of which are incorporated herein by reference.BACKGROUND OF THE INVENTION[0002]1. Field of the Invention[0003]The invention relates to a method of extracting all metabolites existing in a biological sample to detect a comprehensive difference between metabolites of a control group and a test group, thereby verifying significance thereof. The biological sample being analyzed by the invention includes all materials existing in an organism, such as blood, blood plasma, serum, urine, feces, cerebrospinal fluid, tissue, hair, serous fluid, gastric juice and the like.[0004]2. Description of the Related Art[0005]Until now, a research using metabolite is mainly concentrated on a targeted metabolomics research of quantitatively analyzing a reference standard of a specific metabolome...

Claims


Application Information

Patent Timeline
Patent Type & Authority Patents(United States)
IPC IPC(8): G01N30/02G16B40/30
CPCG06F19/24G01N33/6848G01N30/7206Y10T436/255G16B40/00G16B40/30G01N30/8675G01N2030/8813
Inventor JUNG, BYUNG HWACHUNG, BONG CHUL
Owner KOREA INST OF SCI & TECH
Learn More