
Quantification of analytes using accelerator mass spectrometry

a mass spectrometry and accelerator technology, applied in the direction of radiation measurement, particle separator tubes, railway signalling, etc., can solve the problems of incomplete plasma, unextracted unknown amount, complicated quantification in this way,

Inactive Publication Date: 2011-07-26
XCELERON INC
View PDF6 Cites 11 Cited by
  • Summary
  • Abstract
  • Description
  • Claims
  • Application Information

AI Technical Summary

Benefits of technology

This approach significantly reduces errors associated with binding and experimental losses, enabling precise quantification of low concentrations of analytes by compensating for losses and improving the accuracy of AMS analysis.

Problems solved by technology

Quantification in this way, however, is complicated by the following:1. Extraction of the target molecule from, for example, plasma may not be complete and an unknown amount may be left unextracted.
Accordingly, it is not possible to quantify by mass spectrometry without reference to a standard.
However, deuterated standards are not always available.
Nevertheless, the uncertainties associated with sample extraction and possible losses on the chromatography column still apply (i.e. items 1 and 2 discussed above).
In addition radiotracer techniques such as liquid scintillation (LSC) suffer from an innate insensitivity.
Depending upon their specific properties, however, some compounds may exhibit significant amounts of binding and so losses can occur during extraction and HPLC analysis.
This is particularly problematic when it is desired to analyse very small amounts of compound by AMS due to binding effects and experimental losses during extraction and purification for example.
As a result the inherent ability of AMS to detect small quantities of AMS isotopically labelled target molecules may be considered to be associated with increasing errors when quantifying small amounts of material.

Method used


Image

  • Quantification of analytes using accelerator mass spectrometry
  • Quantification of analytes using accelerator mass spectrometry
  • Quantification of analytes using accelerator mass spectrometry

Examples


example 1

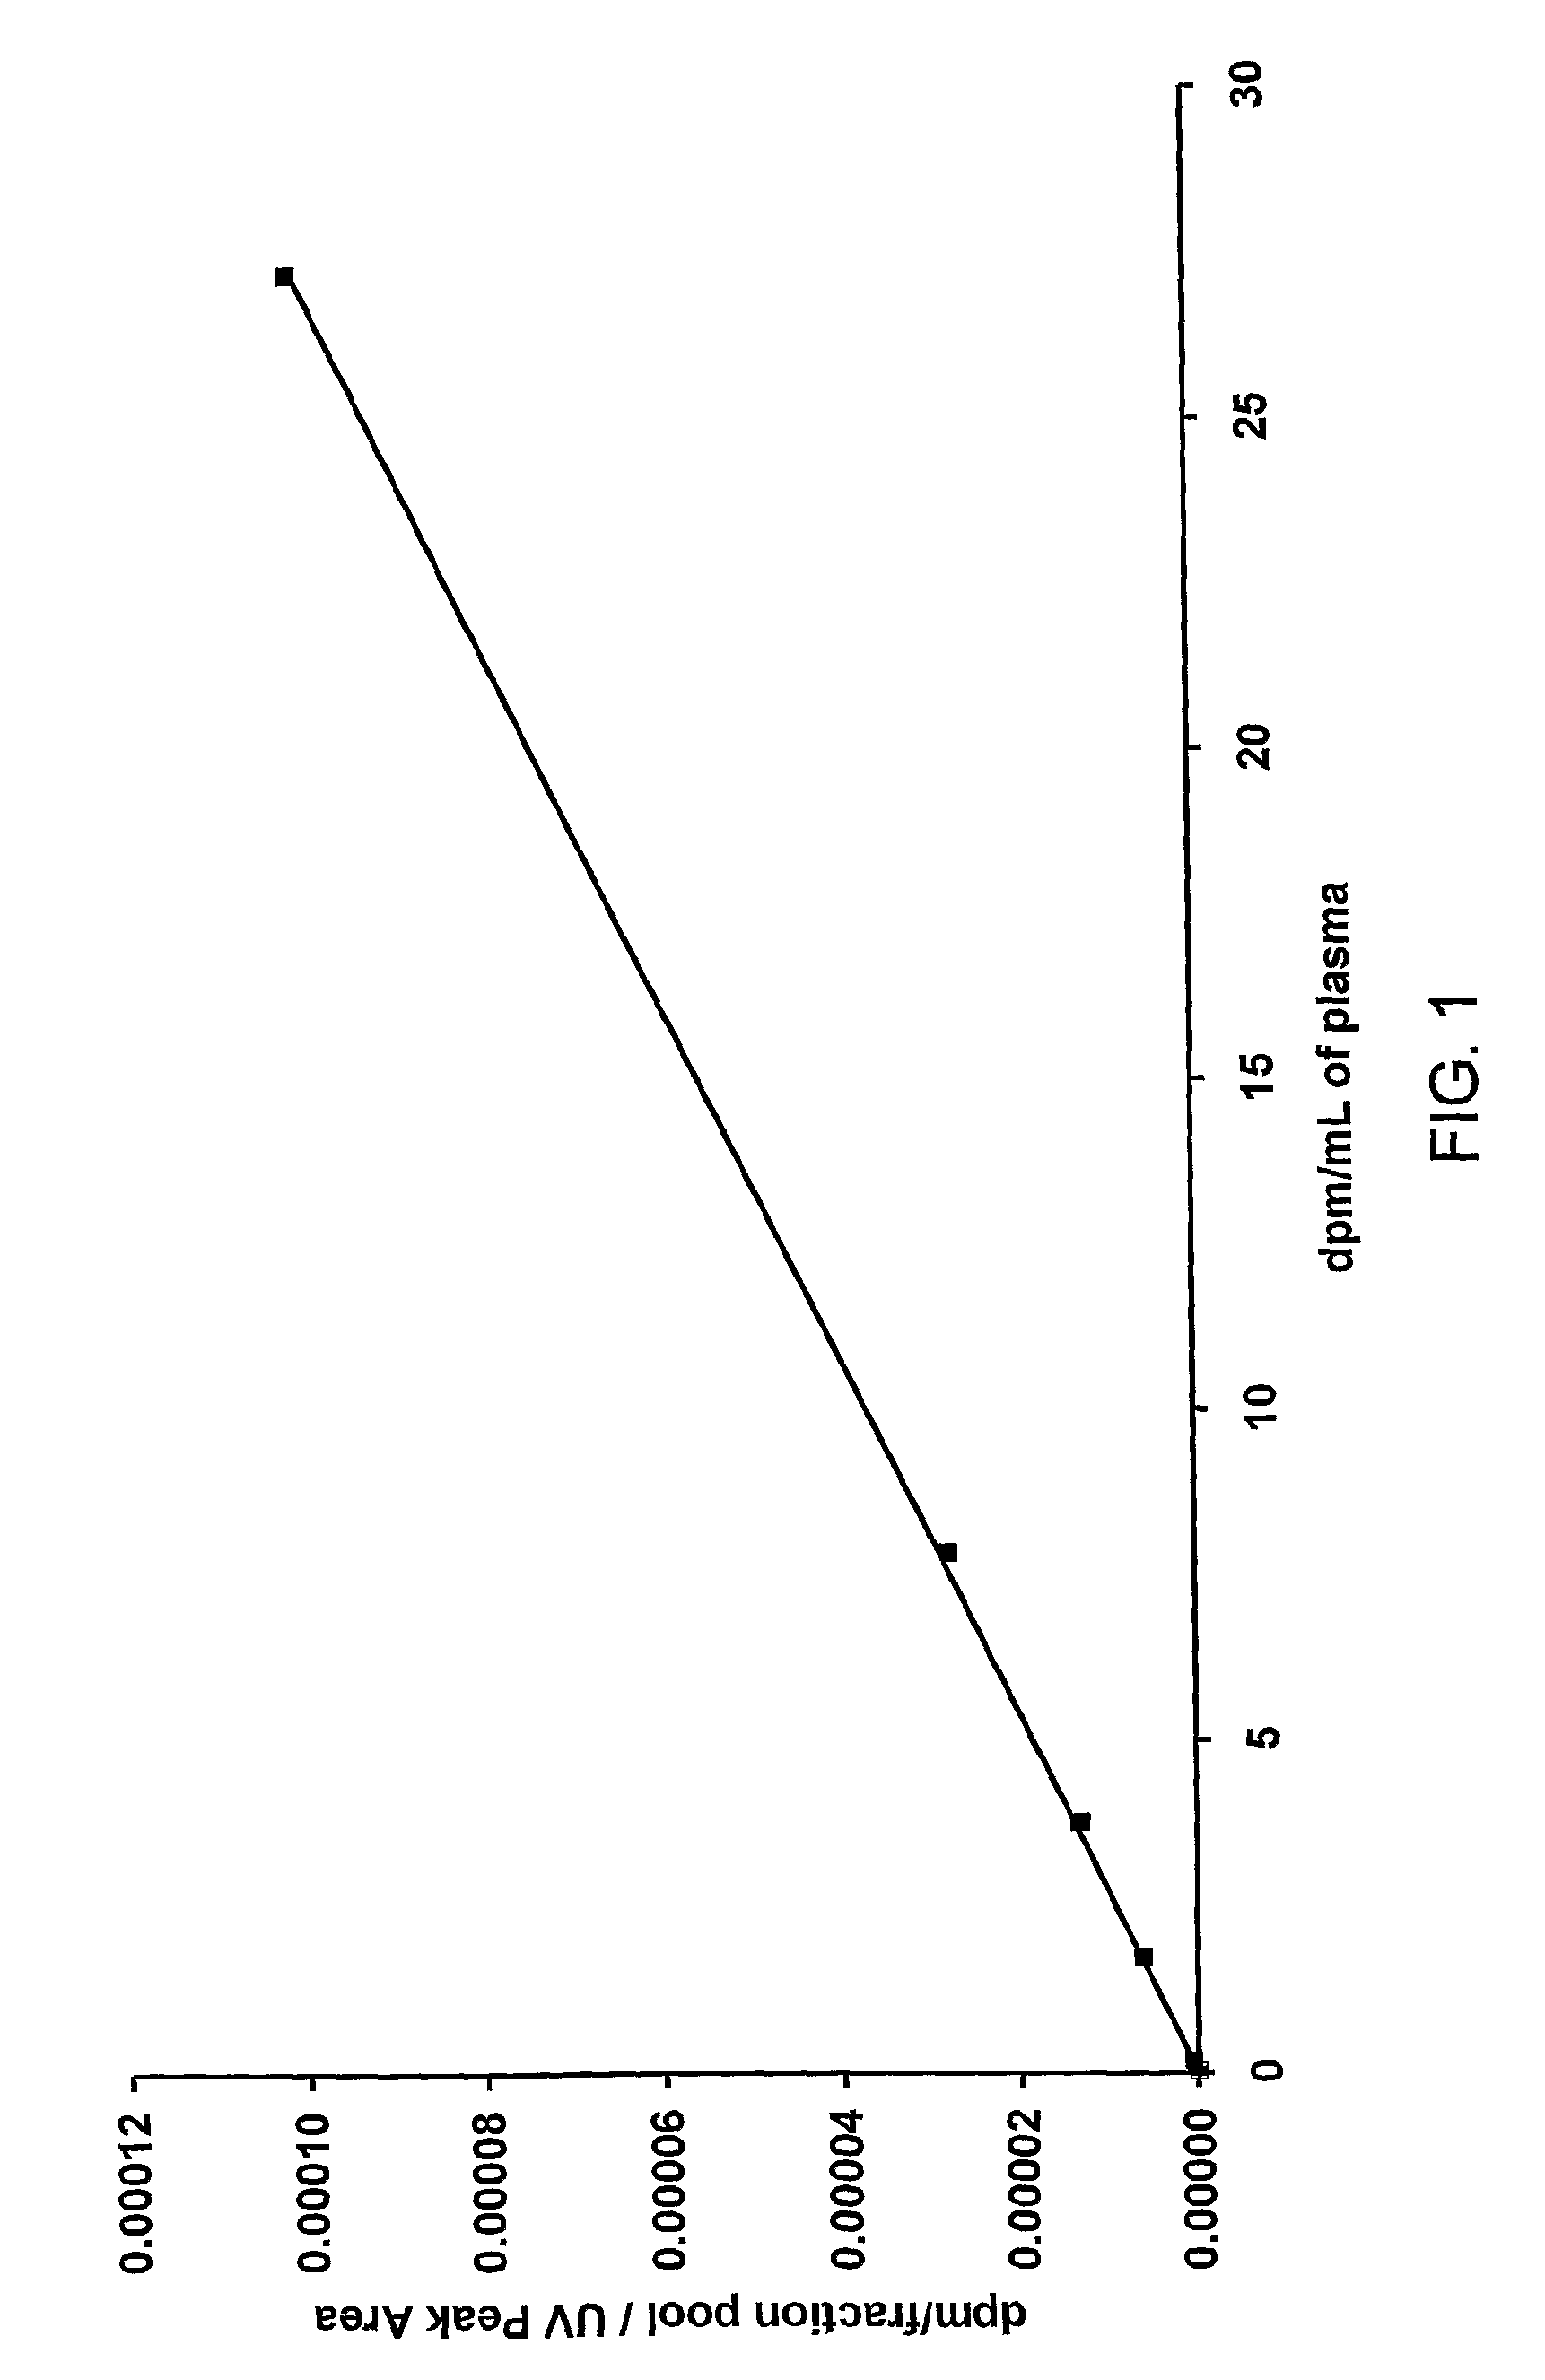
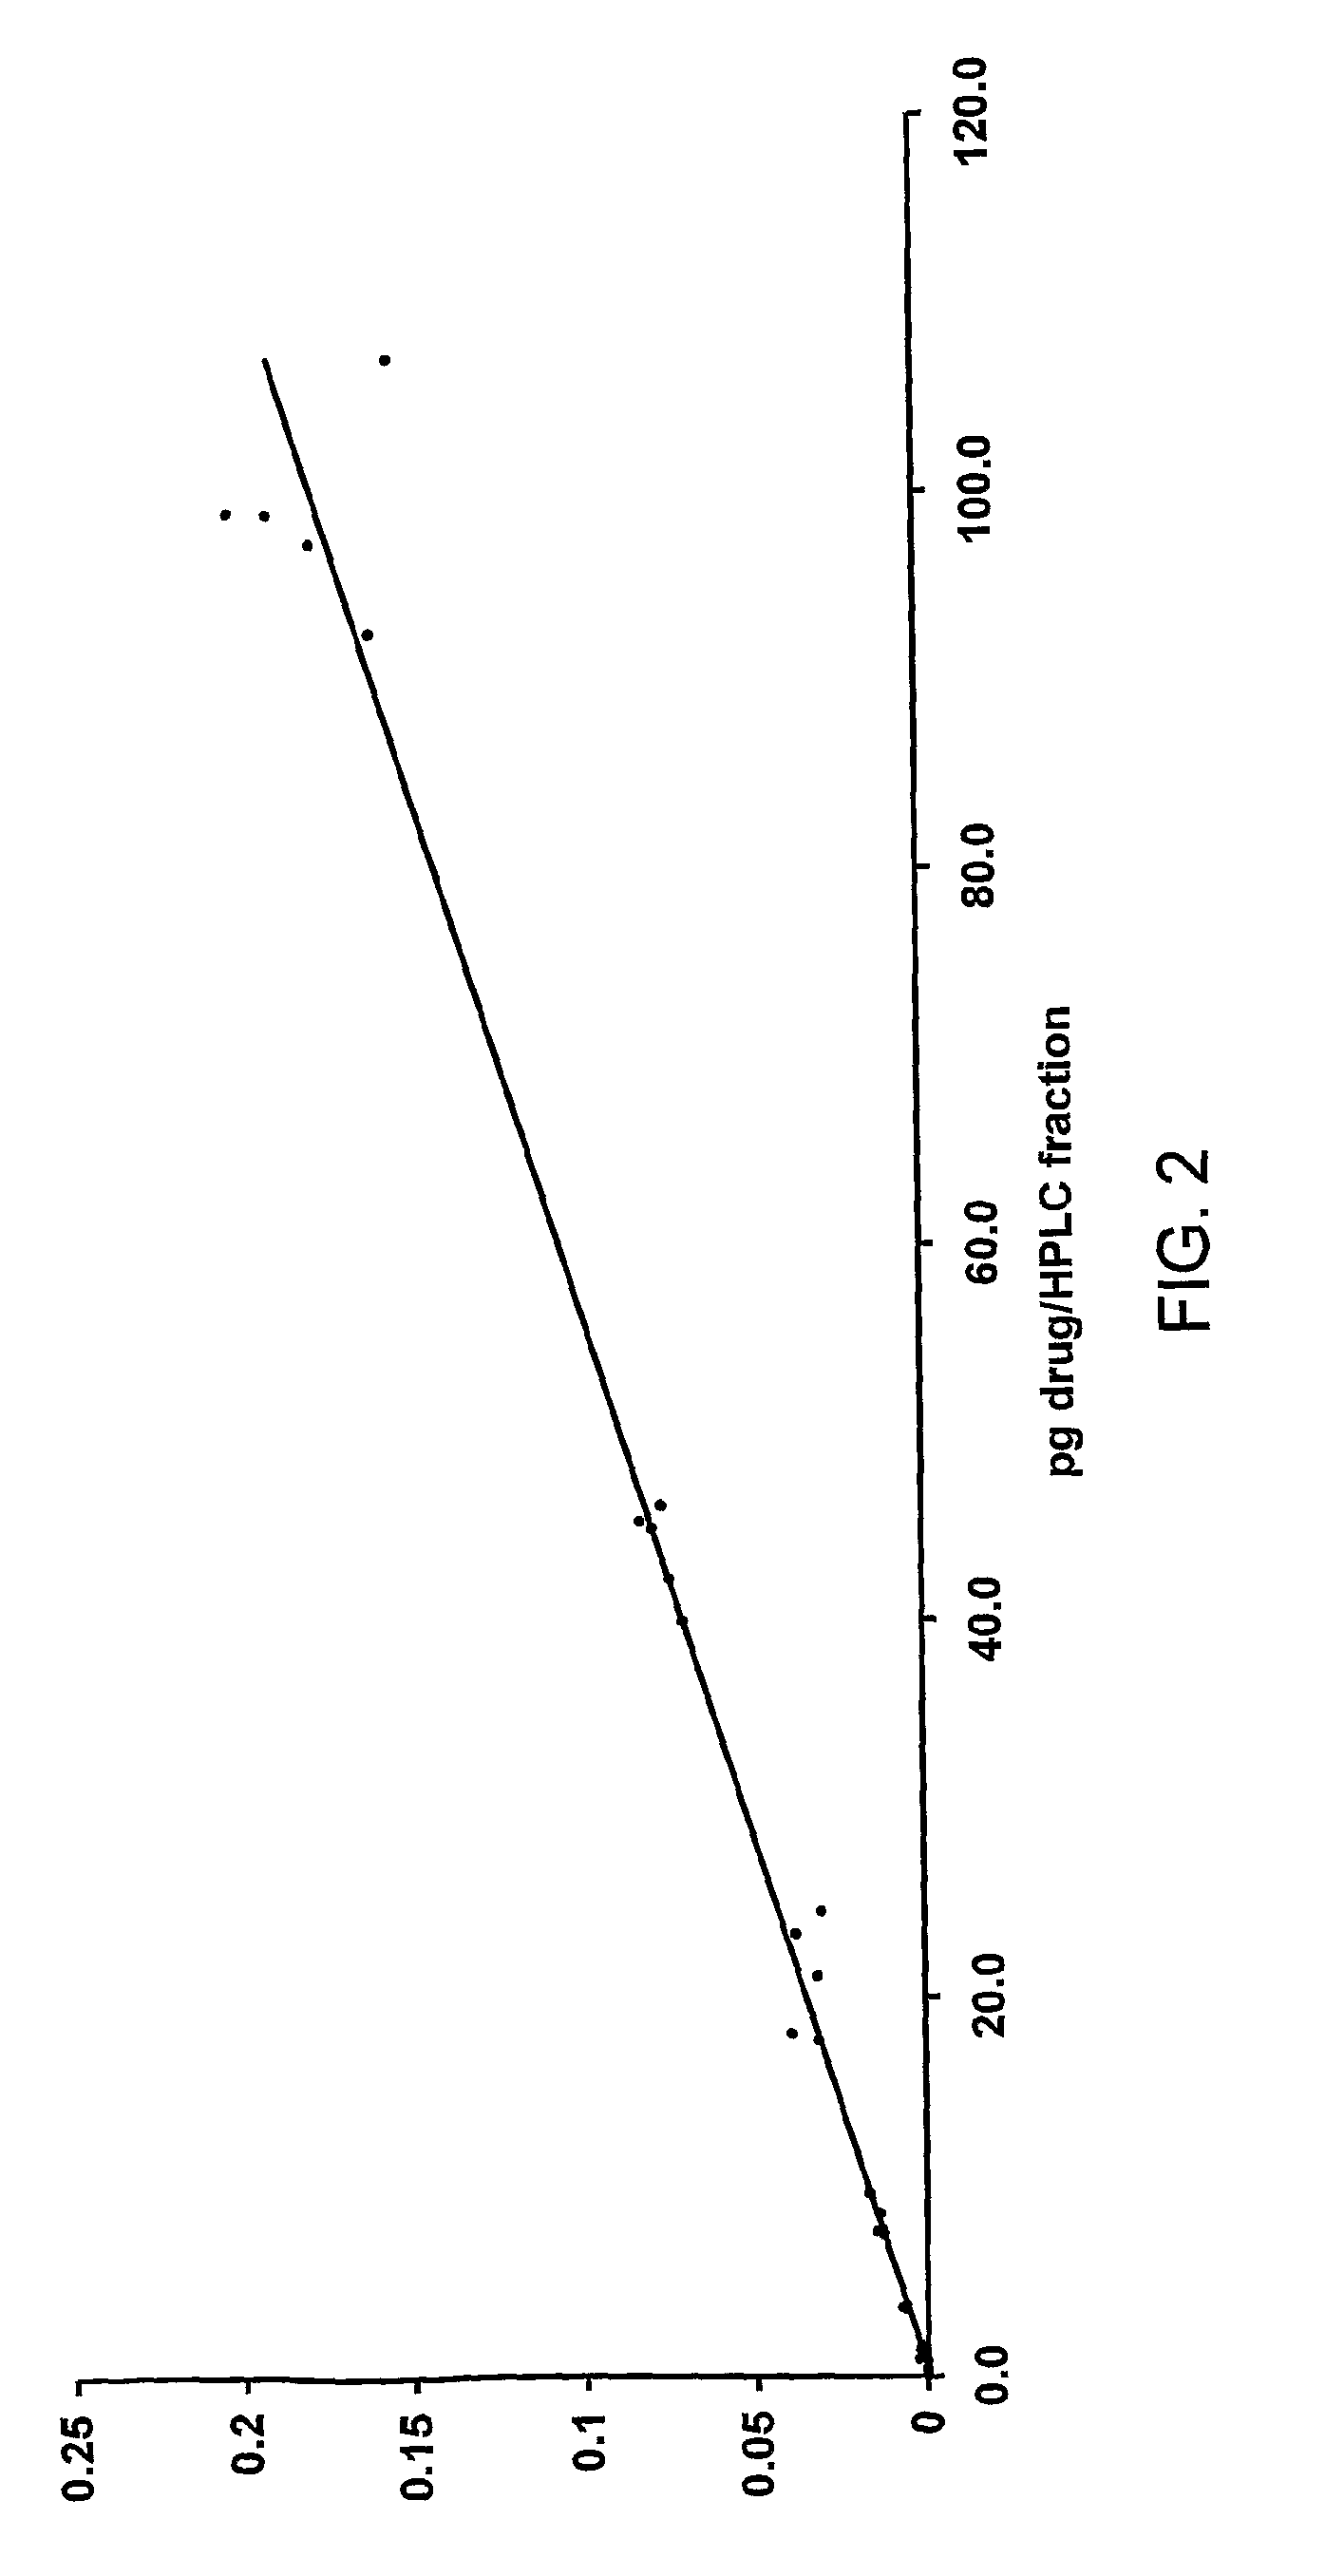
Construction of a Calibration Curve

[0135]Six 1 mL samples of control plasma (human plasma from donors that have never been exposed to the drug being analysed) were taken in separate tubes. Into each tube an amount of 14C-drug was added to achieve the target concentrations shown in Table 1.

[0136]Aliquots were taken from each tube and analysed directly using AMS as described below. The AMS results determined the actual concentrations achieved for each tube as shown in Table 1.

[0137]

TABLE 1Radioactive concentrations for the calibration curve.TargetAchievedconcentrationconcentrationTube(dpm / mL)(dpm / mL)13027.2010287.8429343.7710411.731050.10.17310

[0138]The six plasma samples (200 μL aliquots from each) were then extracted using an exact amount of organic solvent which contained 40 μg / mL non-labelled drug. The extracts were taken to dryness over a stream of nitrogen and reconstituted in 200 μL of solvent.

[0139]Aliquots (50 μL) of each of the reconstituted samples were injected onto a HPLC...

example 2

Test Sample Measurement

[0156]A plasma sample was prepared so that it contained 6.9498 dpm / mL of drug. The sample was extracted (200 μL) using extraction solvent containing 40 μg / mL non-labelled drug. The extract was taken to dryness and reconstituted in 200 μL solvent and 50 μL was injected onto the HPLC. The peak area for the drug was recorded by UV absorbance. The eluate was collected as a series of fractions and the fraction corresponding to the drug was analysed for 14C by AMS. The analysis was conducted twice. Results of the analysis of this sample are shown in Table 6.

[0157]

TABLE 6results of the analysis of a test sampledpm / mL plasmaRatio dpm / mLdpm / mL fromdpm / (conventionalUV peakplasma tocalibrationDuplicatefractionmethod)*areapeak areacurve10.22464.4928165.820.00002850497.4320.20094.128156.610.00002463036.65Mean0.212754.3068161.220.0000265677.04*50 μL from a 200 μL extract was injected onto HPLC, therefore the concentration in the plasma is 20 times that measured in the HPLC ...


PUM

PropertyMeasurementUnit
concentrationaaaaaaaaaa

Abstract

The invention provides a calibrating method for use in a method of determining the quantity of an analyte labeled with an accelerator mass spectrometry (AMS) isotope in a test sample. The samples can include, for example, urine, faeces, plasma or blood. The analyte can be, for example, a drug or metabolite of a drug.

Description

[0001]This application is a continuation of International Application No. PCT / GB2008 / 002464, filed on Jul. 18, 2008, which claims priority to Great Britain Application No. 0714040.3, filed Jul. 19, 2007, the disclosures of all of which are incorporated by reference in their entirety.[0002]This invention relates to a method for improving upon the accuracy with which the quantity of certain isotopically labelled analytes may be determined in a sample of interest. More particularly the invention allows internal standardisation when quantifying analytes using Accelerator Mass Spectrometry (AMS).INTRODUCTION[0003]Bioanalysis, typically conducted using Liquid-Chromatography Mass-Spectrometry (LC-MS), is routinely performed during clinical studies (phase I, II and III) and sometimes on animal samples from toxicology studies.[0004]In LC-MS, analytes are separated using conventional HPLC methods and the eluant from the HPLC passed into the ion source of a mass spectrometer. Here the analytes...

Claims


Application Information

Patent Timeline
Patent Type & Authority Patents(United States)
IPC IPC(8): G01N37/00G01N33/48B01D59/44
CPCG01N33/60G01N33/6848H01J49/0009H01J49/0086Y10T436/13Y10T436/25375Y10T436/25125Y10T436/10Y10T436/25Y10T436/24
Inventor GARNER, RONALD COLINLAPPIN, GRAHAM JOHN
Owner XCELERON INC
Learn More