
Method for detecting discriminatory data patterns in multiple sets of data and diagnosing disease

a data pattern and discriminatory technology, applied in the field of methods and systems for analyzing data, can solve the problems of inability to completely characterize the dataset, inability to effectively screen for early stage ovarian cancer, and inability to apply hidden patterns found in one dataset to other datasets

Inactive Publication Date: 2013-07-02
THE RES FOUND OF STATE UNIV OF NEW YORK
View PDF5 Cites 10 Cited by
  • Summary
  • Abstract
  • Description
  • Claims
  • Application Information

AI Technical Summary

Benefits of technology

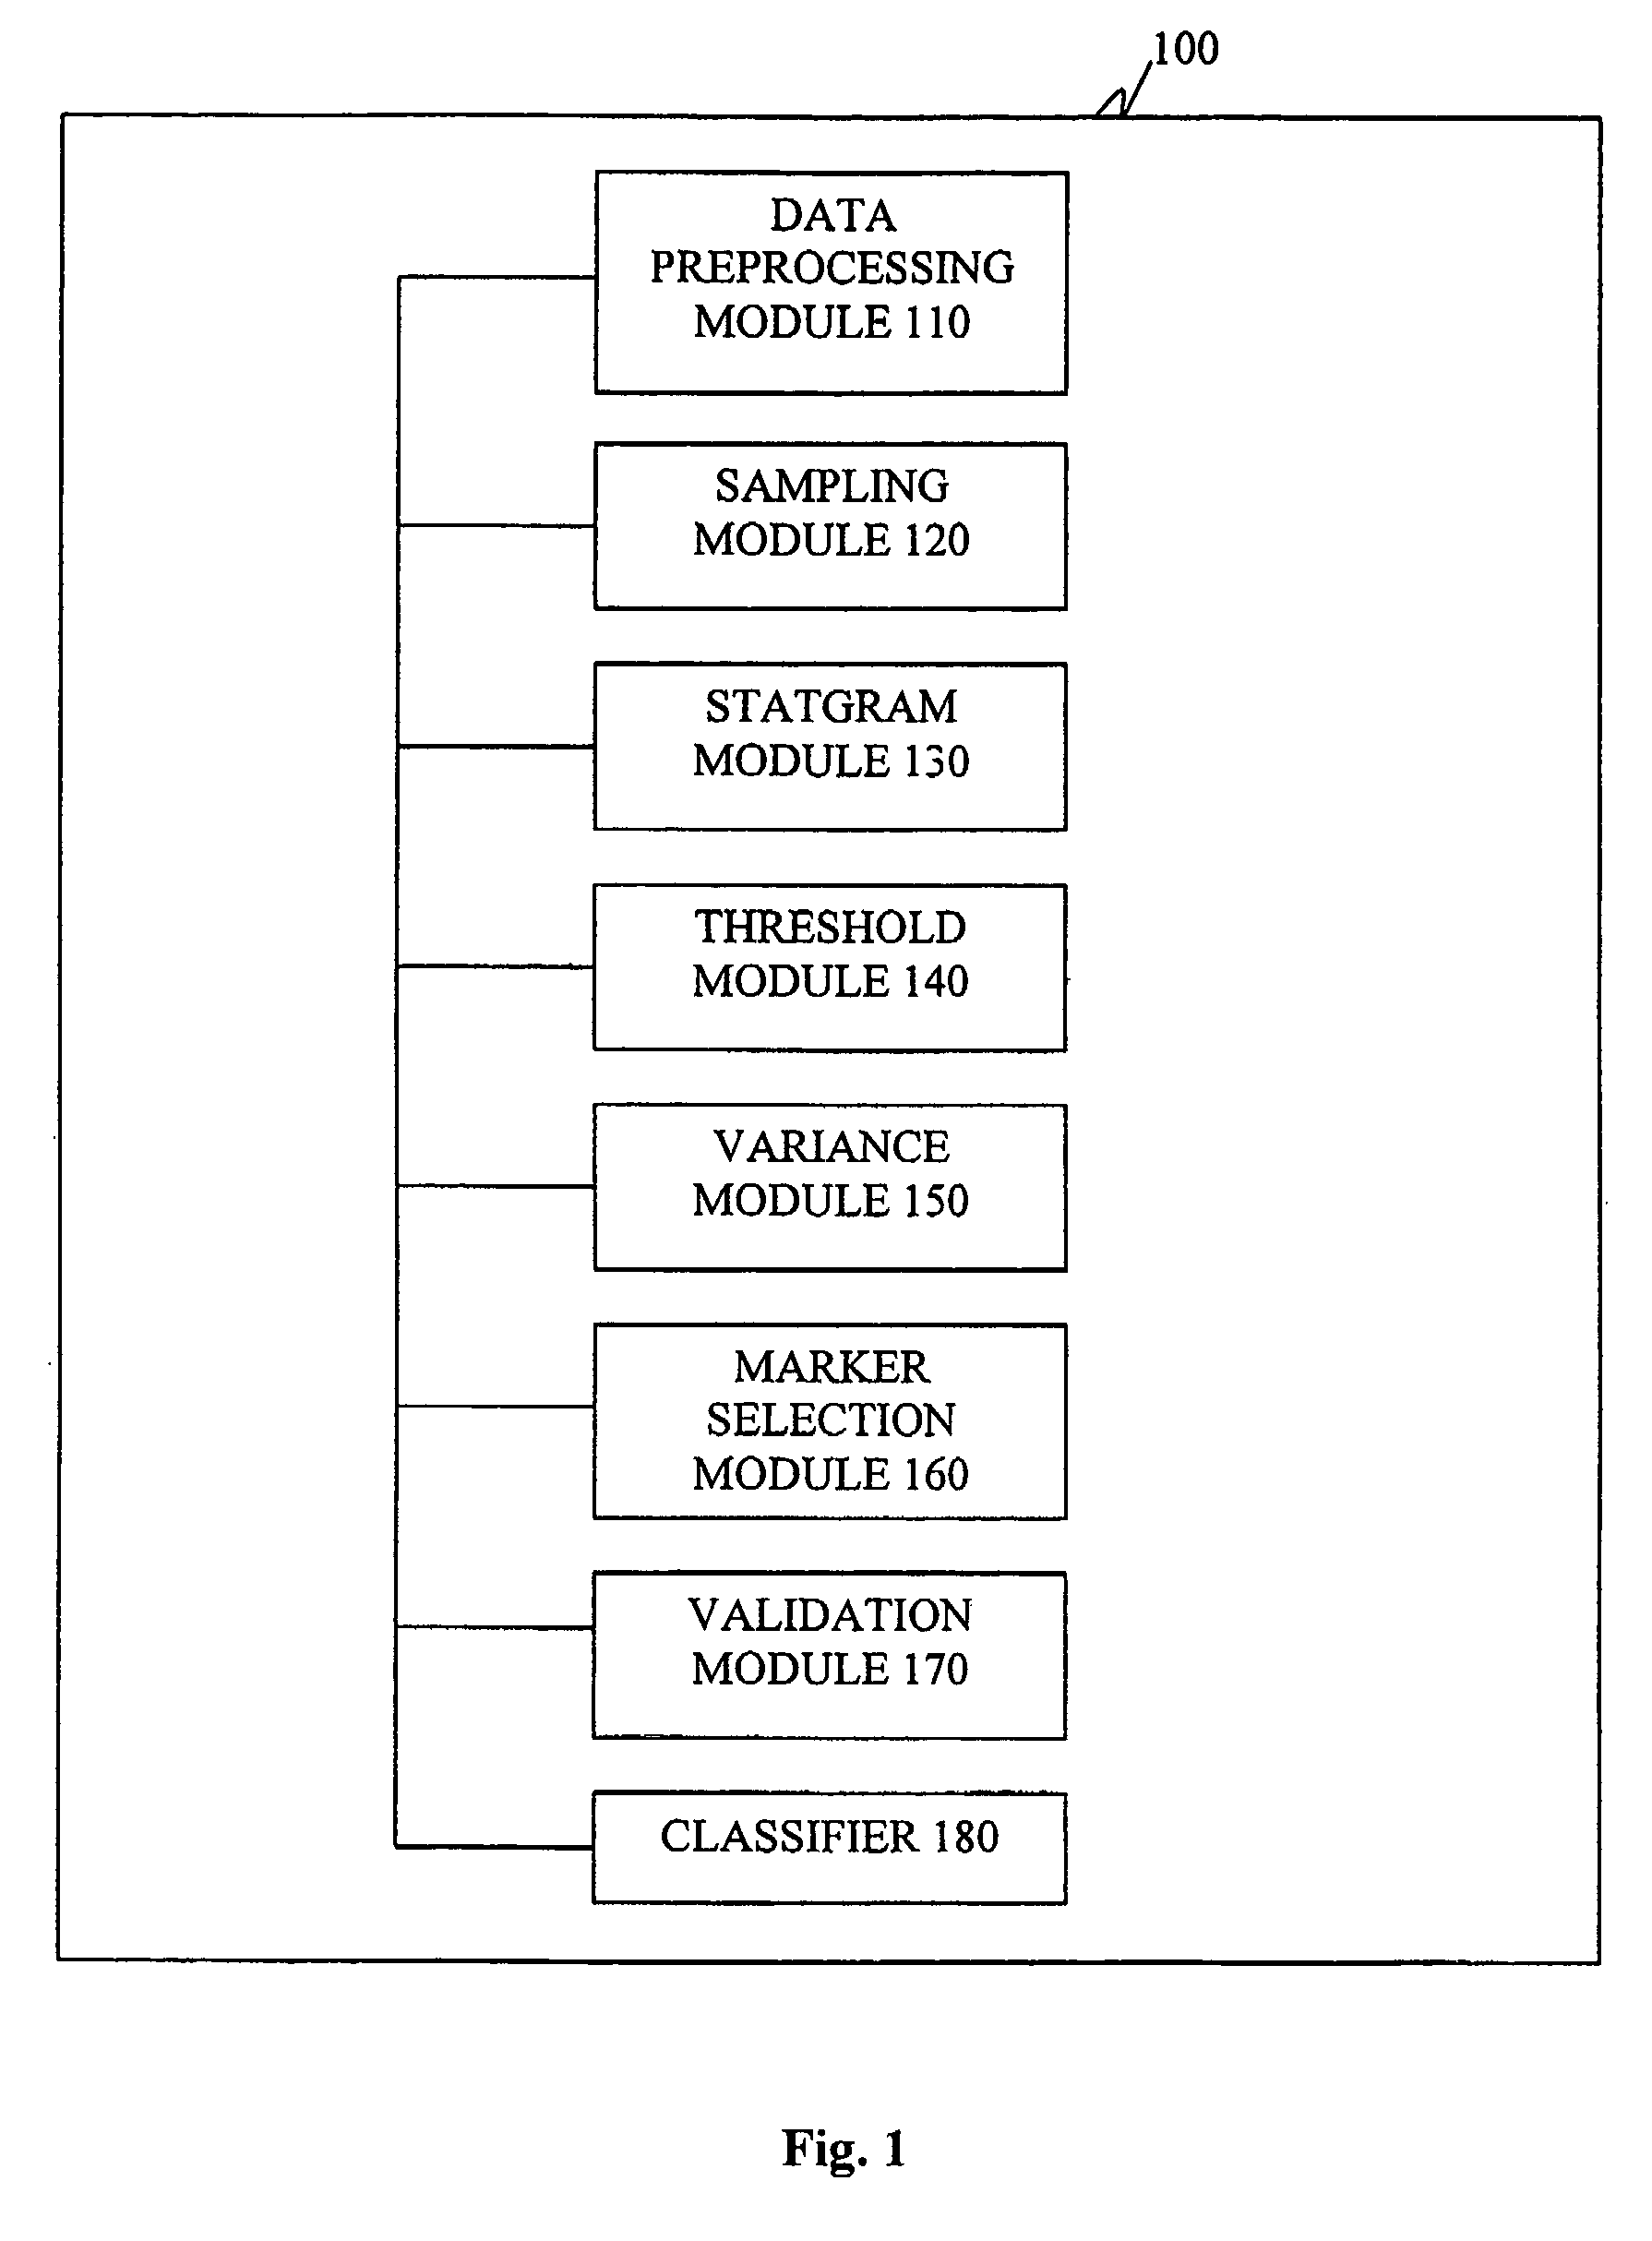
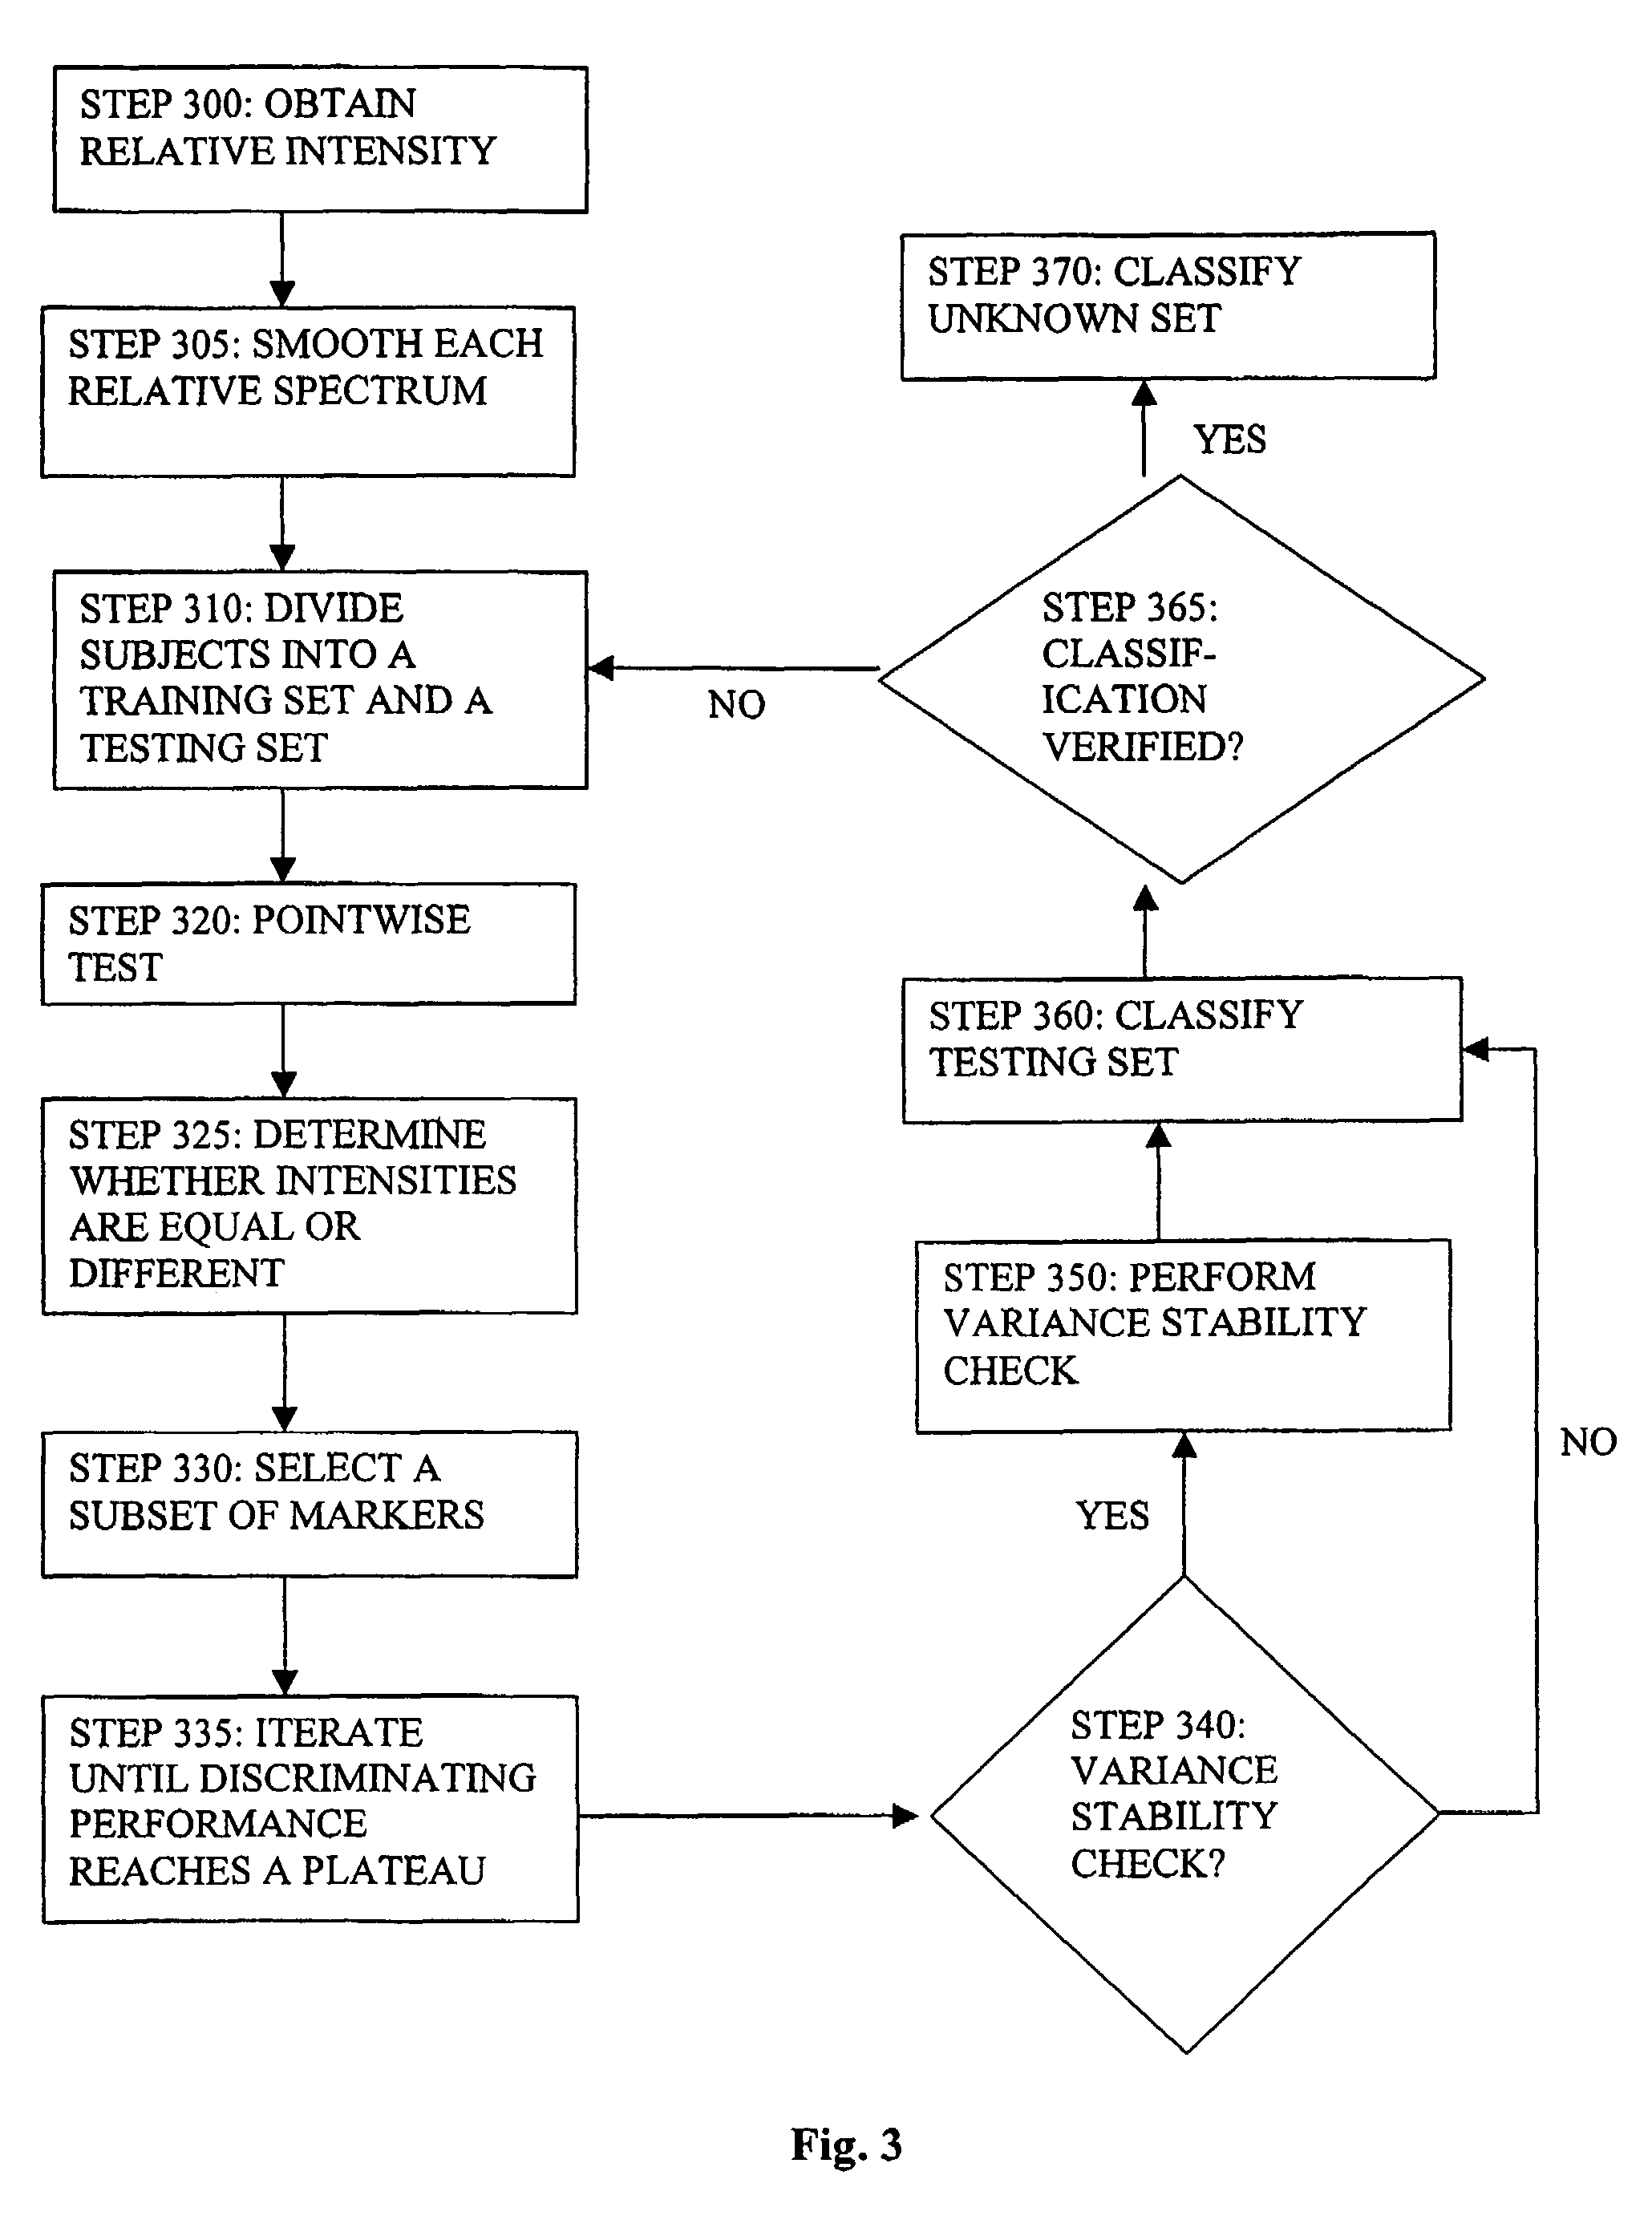
[0016]The present invention provides a method and system for analyzing multiple sets of data, more particularly a comprehensive method and system for detecting subtle hidden differences among multiple sets of data. The comprehensive method and system obtains best discrimination between multiple sets of data that can be expressed with one or more common coordinates. The inventive method and system performs a point by point assessment of the data, thereby enabling the present invention to detect subtle differences in the data that cannot be detected by current analytical methods.
[0024]Another object of the present invention is to provide a comprehensive analytical method and system for detecting discriminatory data patterns between sets of data where each data element can be described by one or more coordinates.
[0025]A still other object of the present invention is to provide a comprehensive analytical method and system as aforesaid, which performs a point by point assessment of the data to detect subtle differences in the datasets without retraining on each dataset.
[0027]A still further object of the present invention is to provide a comprehensive analytical method and system for analyzing and comparing sample data (e.g., tissue and body fluids, such as serum) of affected (i.e., subjects having a disease or disorder or a predisposition for a disease or disorder) and control (unaffected) subjects e.g., via analysis of protein mass spectra. The inventive method identifies a best subset of “k” elements or markers, where “k” is any positive integer, found in the sample data (e.g., serum) to allow for optimal discrimination between two or more groups.
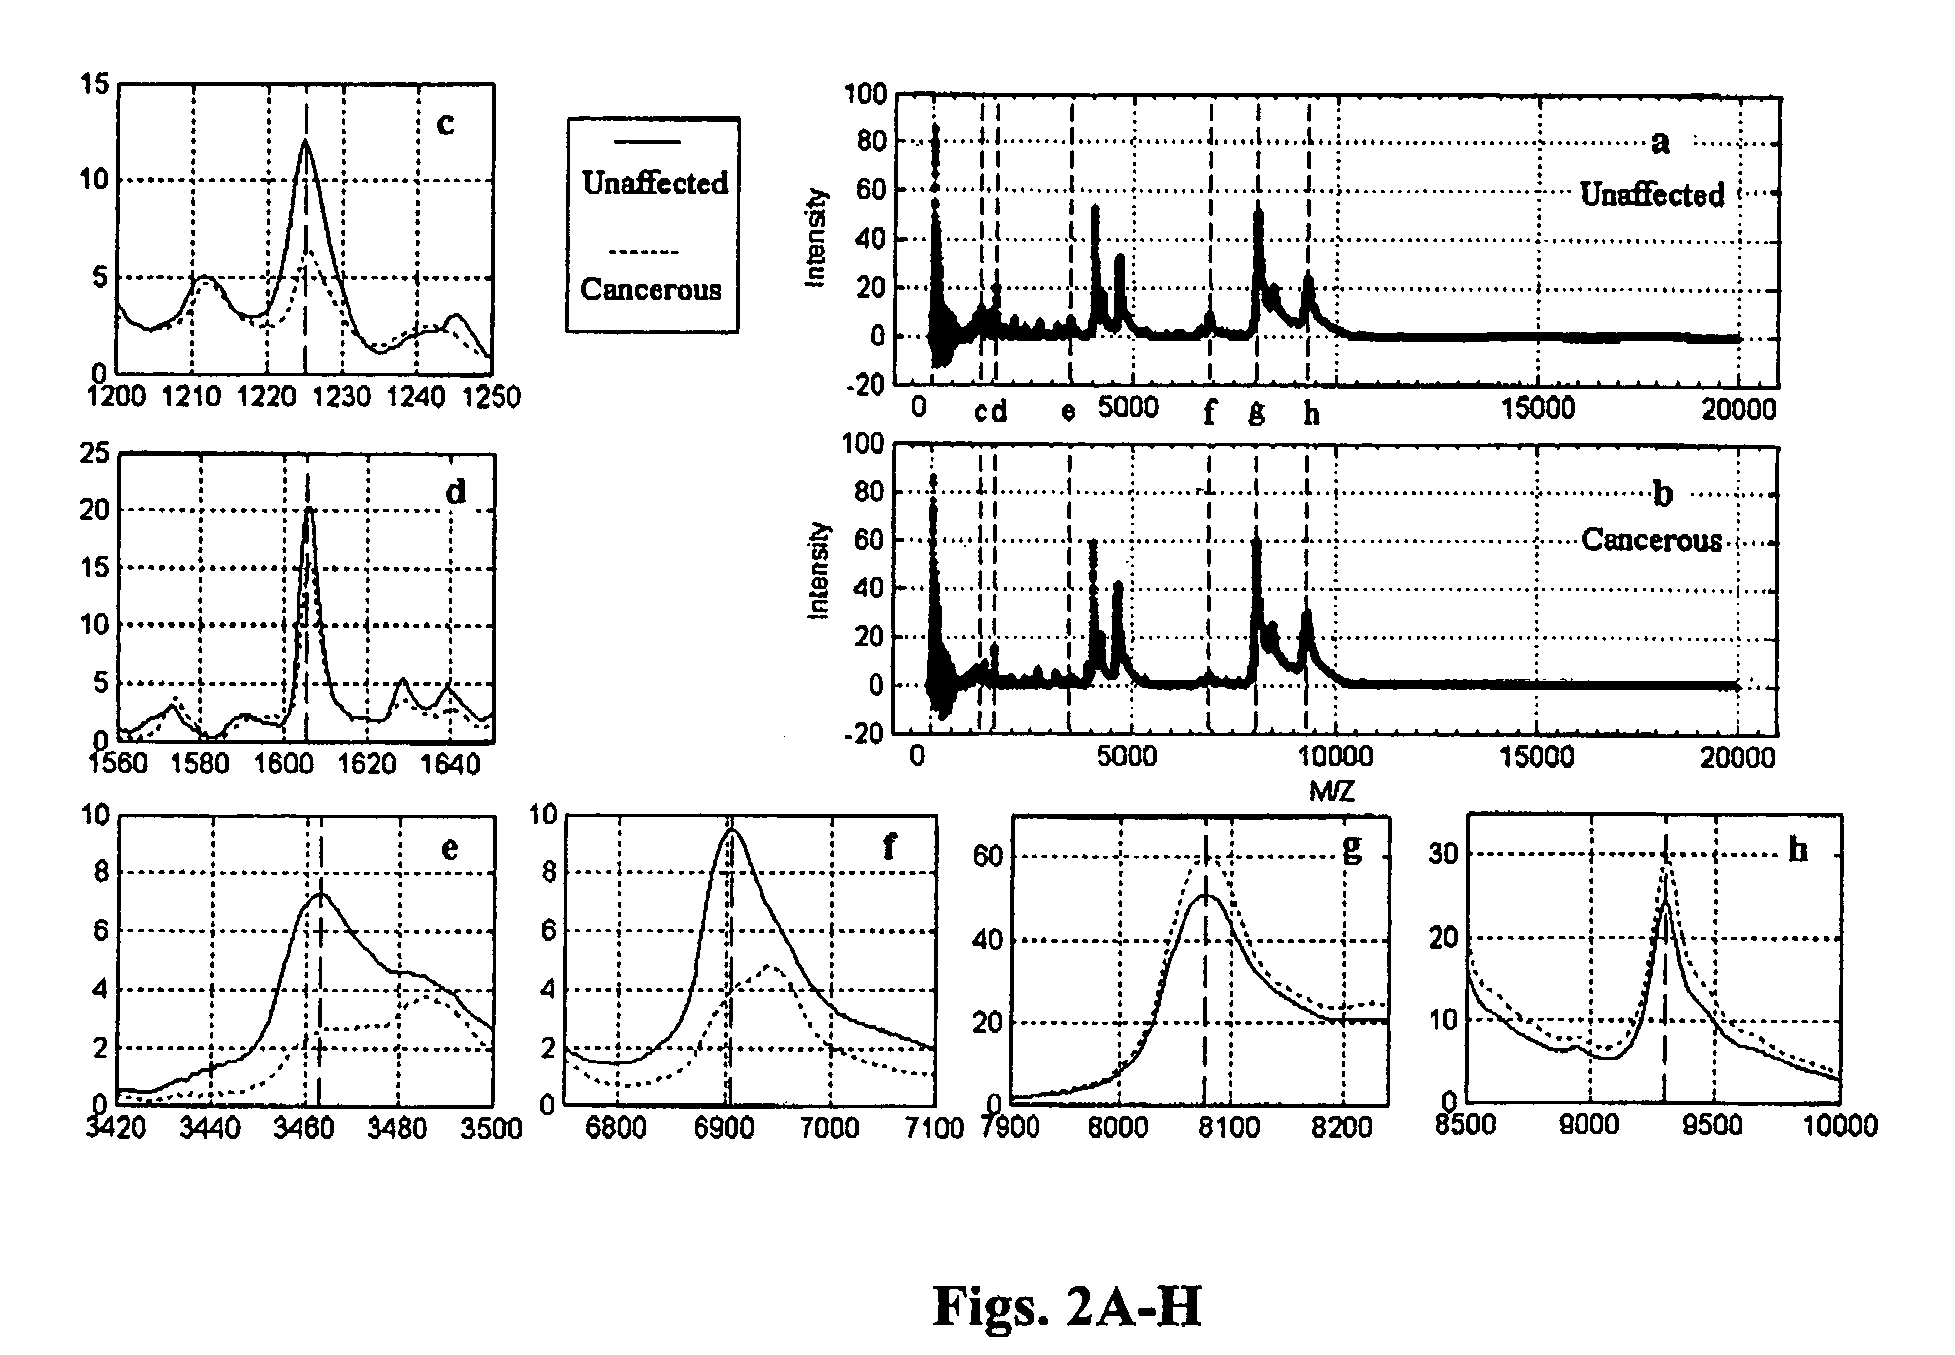
[0029]In accordance with an embodiment of the present invention, the comprehensive analysis method and system examines and quantifies the role of each protein marker along the mass spectrum. All markers with significantly different expression levels between the affected and unaffected subsets, at a given experimentwise error rate, are selected for the ensuing best-subset discriminant analysis to determine the optimal set of markers for diagnosis of the disorder or disease, such as cancer. The inventive method is highly effective for, e.g., ovarian cancer detection, as it achieved perfect discrimination between diseased and normal subjects (including benign cases).

Problems solved by technology

A hidden pattern found in one dataset is generally not applicable to another dataset.
That is, these systems generally require “retraining” on each new set of data and cannot completely characterize the dataset.
For example, current classification systems cannot effectively screen for early stage ovarian cancer.
Ovarian tumors may grow to a size of about 10-12 cm before impinging on adjacent organs, resulting in symptoms, such as increased urinary frequency and rectal pressure.
An effective screening program for early stage ovarian cancer has been elusive, however, due to factors which include the lack of a highly specific screening test.
With the rapid development of proteomics, new screening strategies utilizing modern proteomic technology and bioinformatics are emerging, but none have shown sufficient specificity to be an effective diagnostic tool.
A drawback to Petricoin et al.
Conversely, many of the biomarkers predicted by such known methods will not be statistically significant, so that in many cases, efforts to determine the underlying molecular identity and subsequent cell and molecular biology will be fruitless.
Another challenge when analyzing proteomic data (or genomic data, in general) is to draw robust conclusions from high-dimensional data based on relatively few subjects.

Method used


Image

  • Method for detecting discriminatory data patterns in multiple sets of data and diagnosing disease
  • Method for detecting discriminatory data patterns in multiple sets of data and diagnosing disease
  • Method for detecting discriminatory data patterns in multiple sets of data and diagnosing disease

Examples


Embodiment Construction

[0040]The comprehensive statistical method of the present invention can be applied to analyze any type of raw data, including clinical or environmental data where the sample may be, e.g., water, air, soil, serum, blood, saliva, plasma, nipple aspirate, synovial fluid, cerebrospinal fluid, sweat, urine, fecal matter, tears, bronchial lavage, swabbings, needle aspirant, semen, vaginal fluid, pre-ejaculate, etc., to carry out, e.g., screening for contaminants, pathologic diagnosis, toxicity status, efficacy of a drug, screening or prognosis of a disease. In fact, the present invention can be used to analyze any data that can be expressed with common coordinates. That is, the multiple sets of data can be mapped into the same coordinate system, thereby enabling comparison between multiple sets of data. Moreover, the present invention can analyze data from mass spectroscopy, liquid chromatography, two-dimensional gel chromatography, gas chromatography, etc.

[0041]In accordance with an embo...


PUM

PropertyMeasurementUnit
sizeaaaaaaaaaa
mass spectrometeraaaaaaaaaa
massaaaaaaaaaa

Abstract

A comprehensive analysis procedure for analyzing and comparing multiple sets of data to detect hidden discriminatory data patterns. The inventive procedure identifies a best subset of markers for optimal discrimination between two or more sets of data. A point-wise test on two or more sets of data is performed to calculate test statistic values and to generate a statgram, a two- or higher- dimensional map of the test statistic values along the range of data. A threshold is then determined for isolating critical regions of the statgram at each significance level to provide candidate markers. A subset of markers from the candidate markers is then selected to discriminate among the sets of data. The two or more sets of data are classified using the subset of markers.

Description

RELATED PATENT APPLICATIONS[0001]The present application claims priority from U.S. Provisional Patent Application No. 60 / 477,529 filed on Jun. 11, 2003 and from U.S. Provisional Patent Application No. 60 / 553,433 filed on Mar. 15, 2004, each of which is entitled A METHOD AND SYSTEM FOR DETECTING DISCRIMINATORY DATA PATTERNS BETWEEN MULTIPLE SETS OF DATA and each of which is incorporated herein by reference in its entirety.FIELD OF THE INVENTION[0002]The present invention relates to methods and systems for analyzing data, particularly for detecting patterns that distinguish multiple sets of data.BACKGROUND OF THE INVENTION[0003]In many systems or phenomena, naturally occuring or otherwise, distinctive patterns of data are often buried within the highly complex data sets that are created to characterize such systems or phenomena. Such patterns have been observed, for example, in the study of a wide variety of systems and phenomena such as diseases, environmental conditions, and financi...

Claims


Application Information

Patent Timeline
Patent Type & Authority Patents(United States)
IPC IPC(8): G01N33/50C12NG06F9/44G16B20/00G16B40/10
CPCG06F19/24G06F19/3443G06K9/6217G06K9/6262H01J49/0036G06F17/18G06F19/18G16H50/70G16B20/00G16B40/00Y02A90/10G16B40/10G06F18/21G06F18/217
Inventor ZHU, WEIWANG, XUENAKOVACH, JOHN S.
Owner THE RES FOUND OF STATE UNIV OF NEW YORK
Learn More