
Immunoassay methods

a technology of immunoassay and method, applied in the field of diagnostic or prognostic assay, can solve the problems of high false negative rate, difficulty in scoring true positive, and difficulty in devising a standardised assay methodology, so as to reduce the incidence of false positive and high specificity and sensitivity

Active Publication Date: 2014-05-13
ONCIMMUNE
View PDF70 Cites 8 Cited by
  • Summary
  • Abstract
  • Description
  • Claims
  • Application Information

AI Technical Summary

Benefits of technology

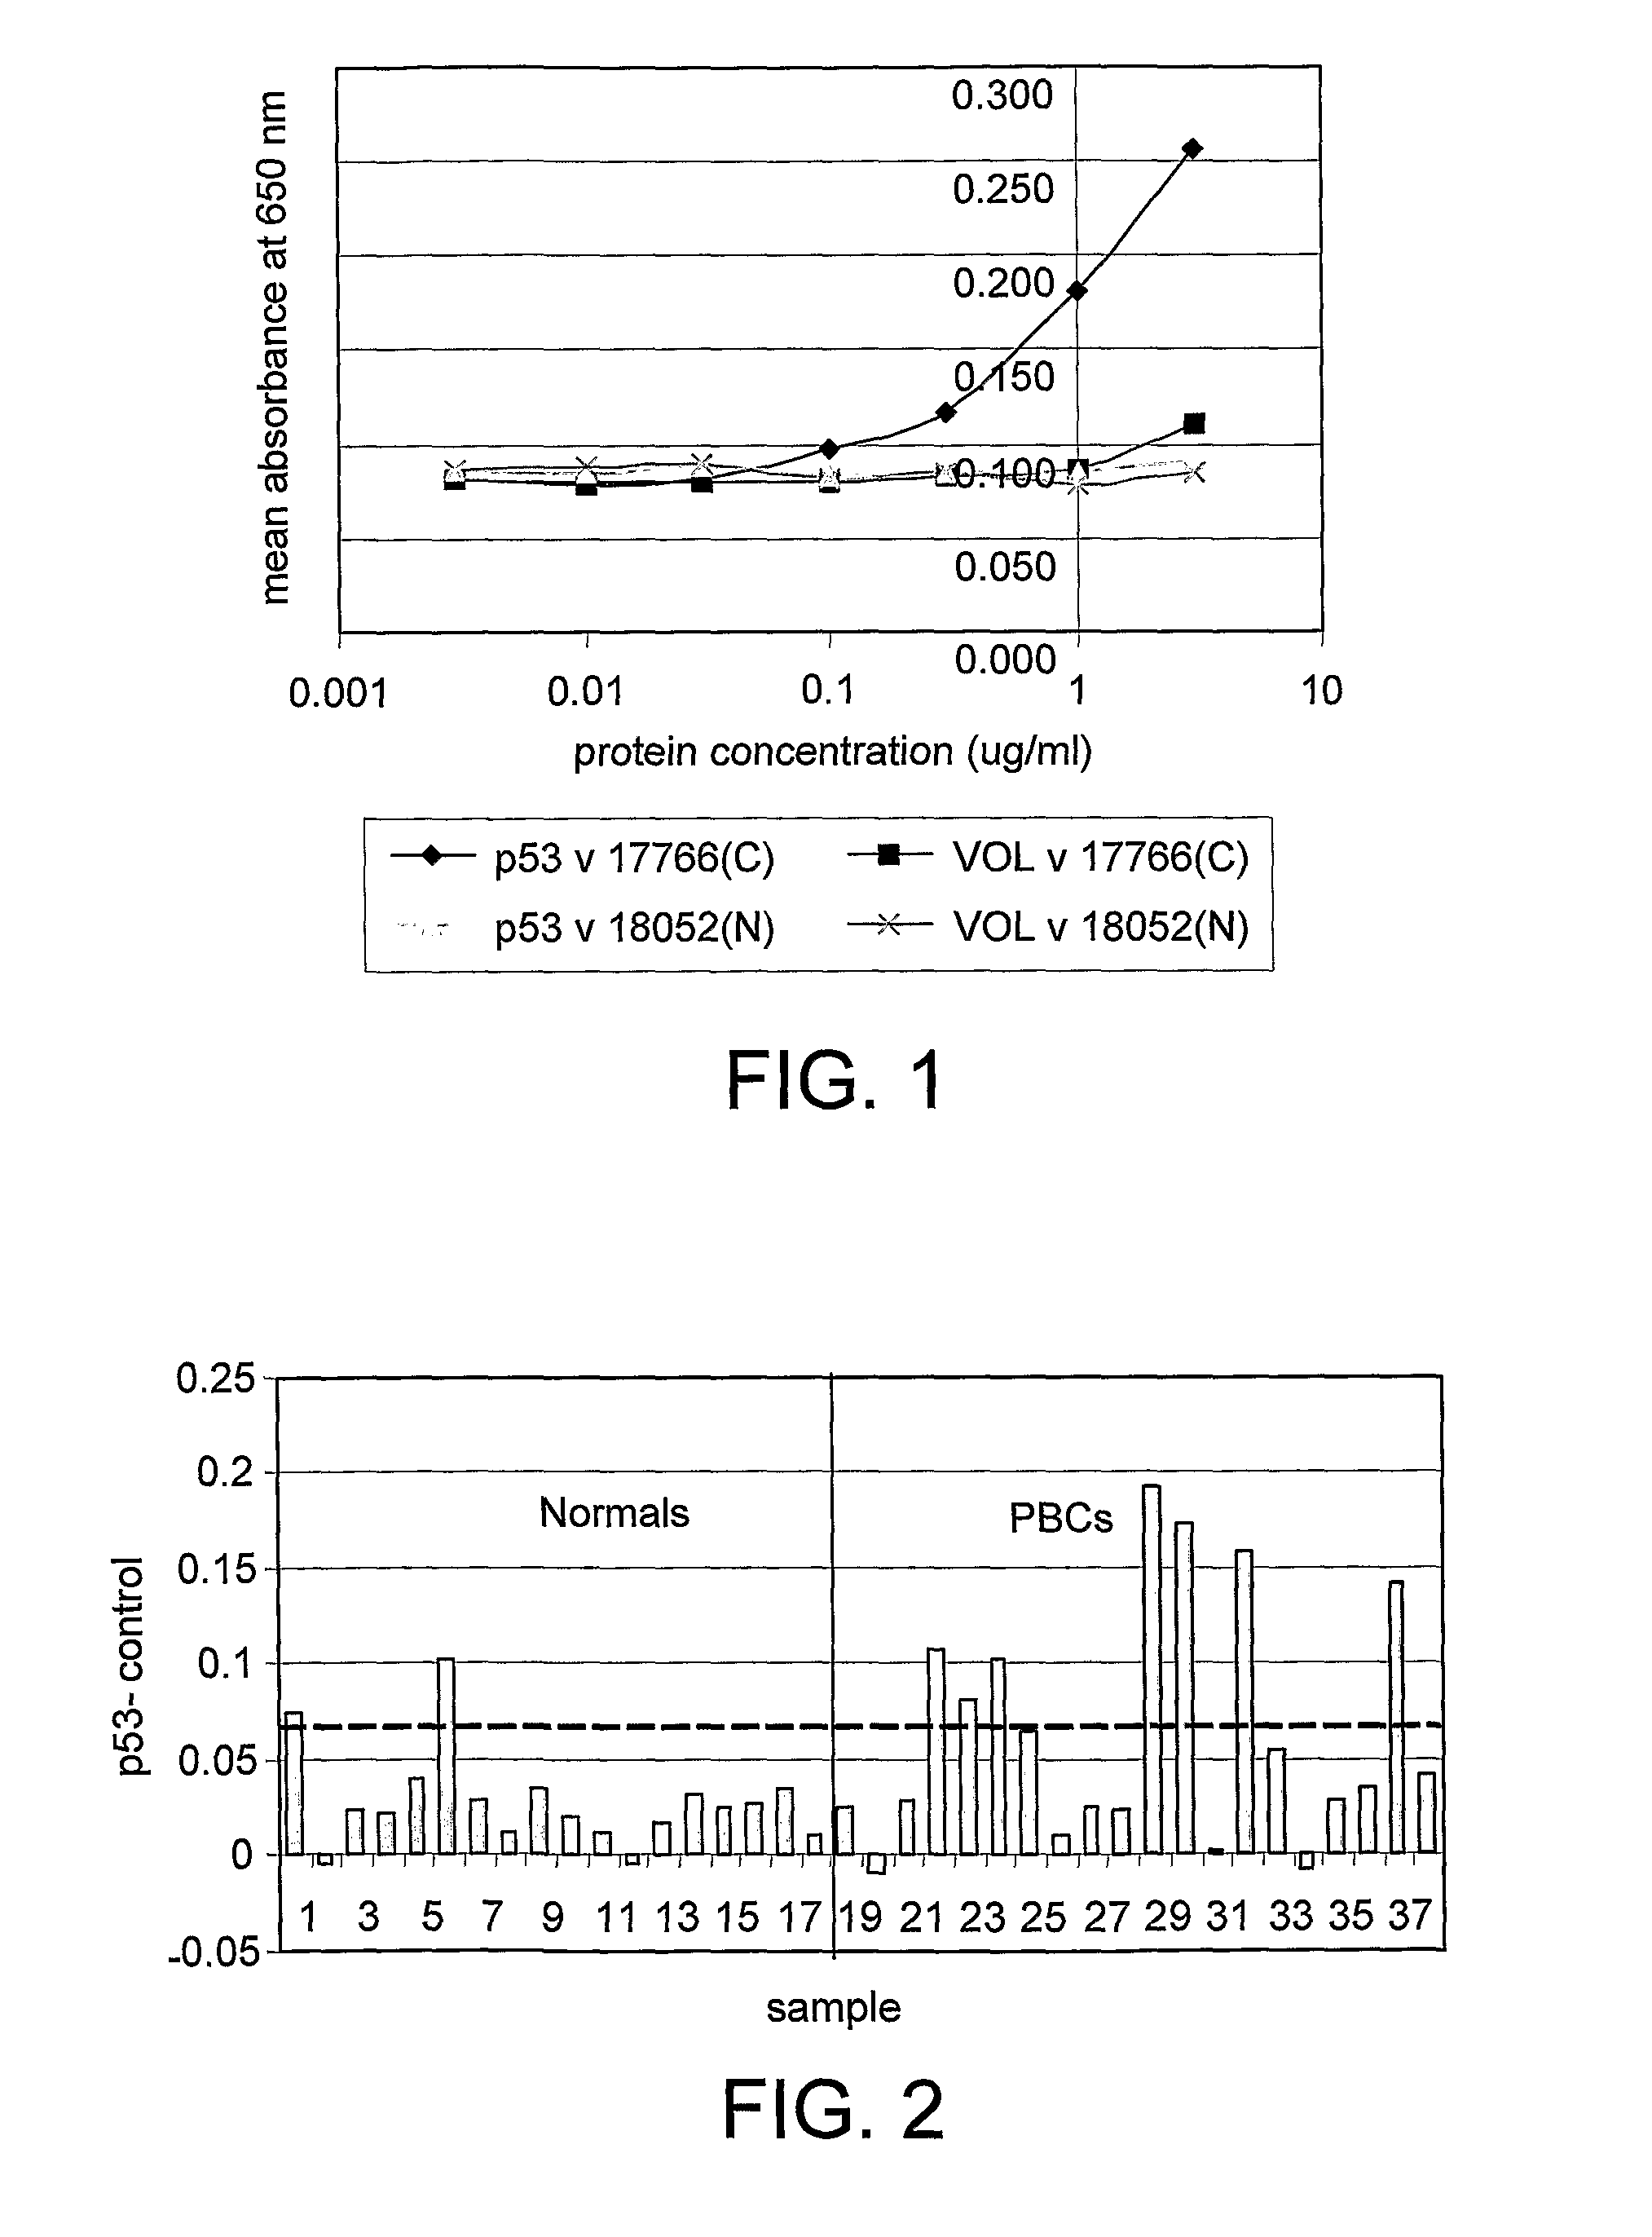
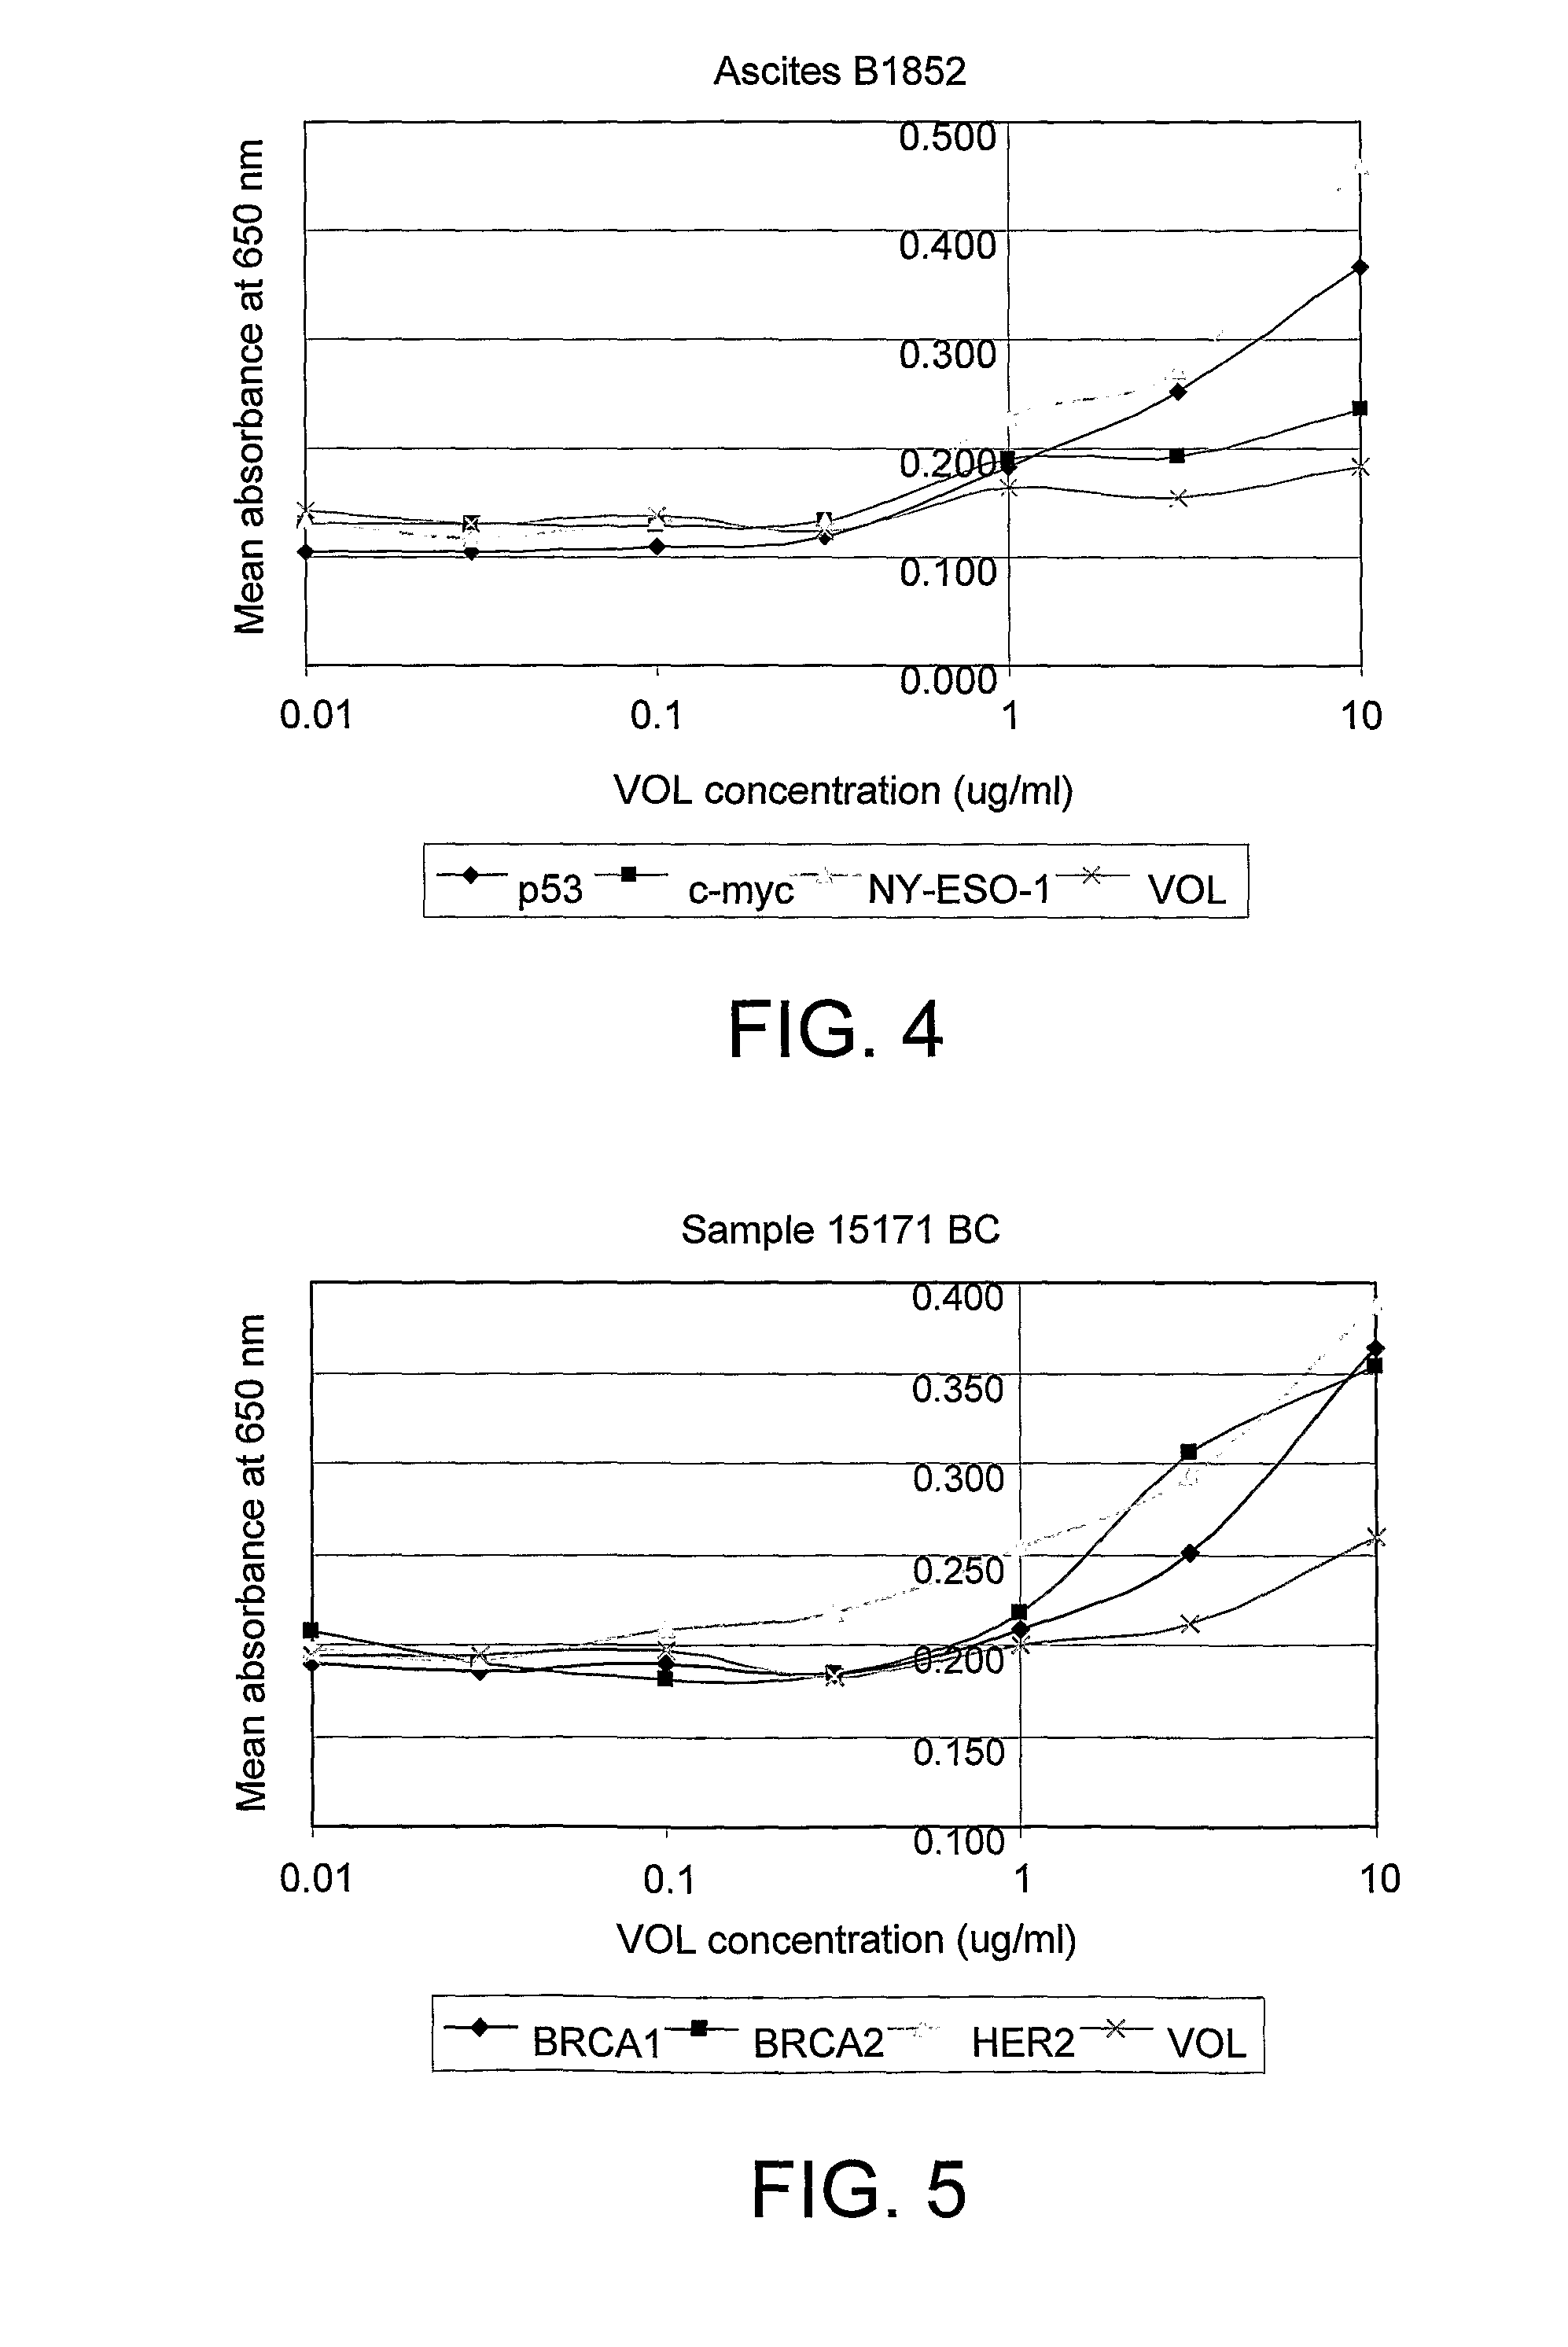
[0015]A particular feature of the invention in all its aspects is that the judgement as to whether the relevant antibody is or is not present in the test sample is based upon the amount of specific binding observed at each different antigen concentration tested, in other words the collective values, rather than just a reading at a single concentration. Thus, the determination of the presence or absence of disease state or disease susceptibility or antibodies to a foreign substance in a patient sample can follow based directly on these collective values. Preferably, the judgement is made on the basis of the showing of a generally S-shaped or sigmoidal curve when the amount of specific binding is plotted against the amount of antigen. As will be apparent from the Examples herein the inventors have observed that the antigen titration methods of the invention have higher specificity and sensitivity than methods of diagnosis or detection based upon a single reading and reduce incidence of false positive and false negative determinations.

Problems solved by technology

The present inventors have recognised that when assays based on detection of antibodies are used diagnostically or prognostically to assess the disease state, disease progression or disease susceptibility of an individual within a population, difficulties can arise in devising a standardised assay methodology appropriate for the whole population of subjects to be screened because the absolute amounts of antibody present vary dramatically from individual to individual.
This can produce a high incidence of false negative results, for example amongst individuals having a low amount of antibody.
Similarly there is a difficulty in scoring true positive results because the variation in absolute amounts of antibody from individual to individual means that it is difficult to set a threshold for a positive assay result that is appropriate for all individuals within the population screened.
Thus, these methods will not allow for variation in amounts of the antibody to be detected from individual to individual resulting in the incidence of false positives and false negatives as discussed.

Method used


Image

  • Immunoassay methods
  • Immunoassay methods
  • Immunoassay methods

Examples


example 1

General Protocol for Titration of Antigen in an Autoantibody Assay

[0103]Samples of (biotinylated) tumour marker antigens may be prepared by recombinant expression, following analogous methods to those described in WO 99 / 58978.

[0104]Briefly, cDNAs encoding the marker antigens of interest were cloned into the pET21 vector (Invitrogen) which has been modified to encode a biotin tag and a 6× histidine tag to aid in purification of the expressed protein. The resulting clones are grown in a suitable bacterial host cell (in inclusion bodies), the bacteria lysed and denatured and the expressed antigens recovered via Nickel chelate affinity columns-(Hi-trap, commercially available from Amersham, following manufacturer's protocol). The expressed antigens were renatured by dialysis in appropriate buffer and the yield of expressed protein assessed by SDS-PAGE, western blot and ELISA and quantitated prior to storage.

[0105]The negative control VOL is empty vector (i.e. no cloned cDNA) which still...

example 2

Detection of Autoantibodies in Primary Breast Cancer

[0118]The following data were obtained from a pilot study to assess the sensitivity and reproducibility of a panel of titration autoantibody assays in primary breast cancer (PBC). The study included serum from 17 women with no evidence of cancer and pre-operative serum samples from 20 women with primary breast cancer. Normal and cancer samples were age matched. One normal and three cancer samples had to be removed from the study because they showed evidence of anti-biotin antibody responses and therefore could not be assessed using the assay in its present format.

Approximately 10% of the population is thought to develop an immune response against biotin.

[0119]The assay was carried out according to the protocol given in example 1 using the antigens p53, c-myc, NY-ESO-1 and BRCA2

[0120]FIG. 1 gives examples of curves obtained when the antigen titration assay was used to measure p53 autoantibodies in serum. It can be seen that the canc...

example 3

Detection of Autoantibodies in Lung Cancer

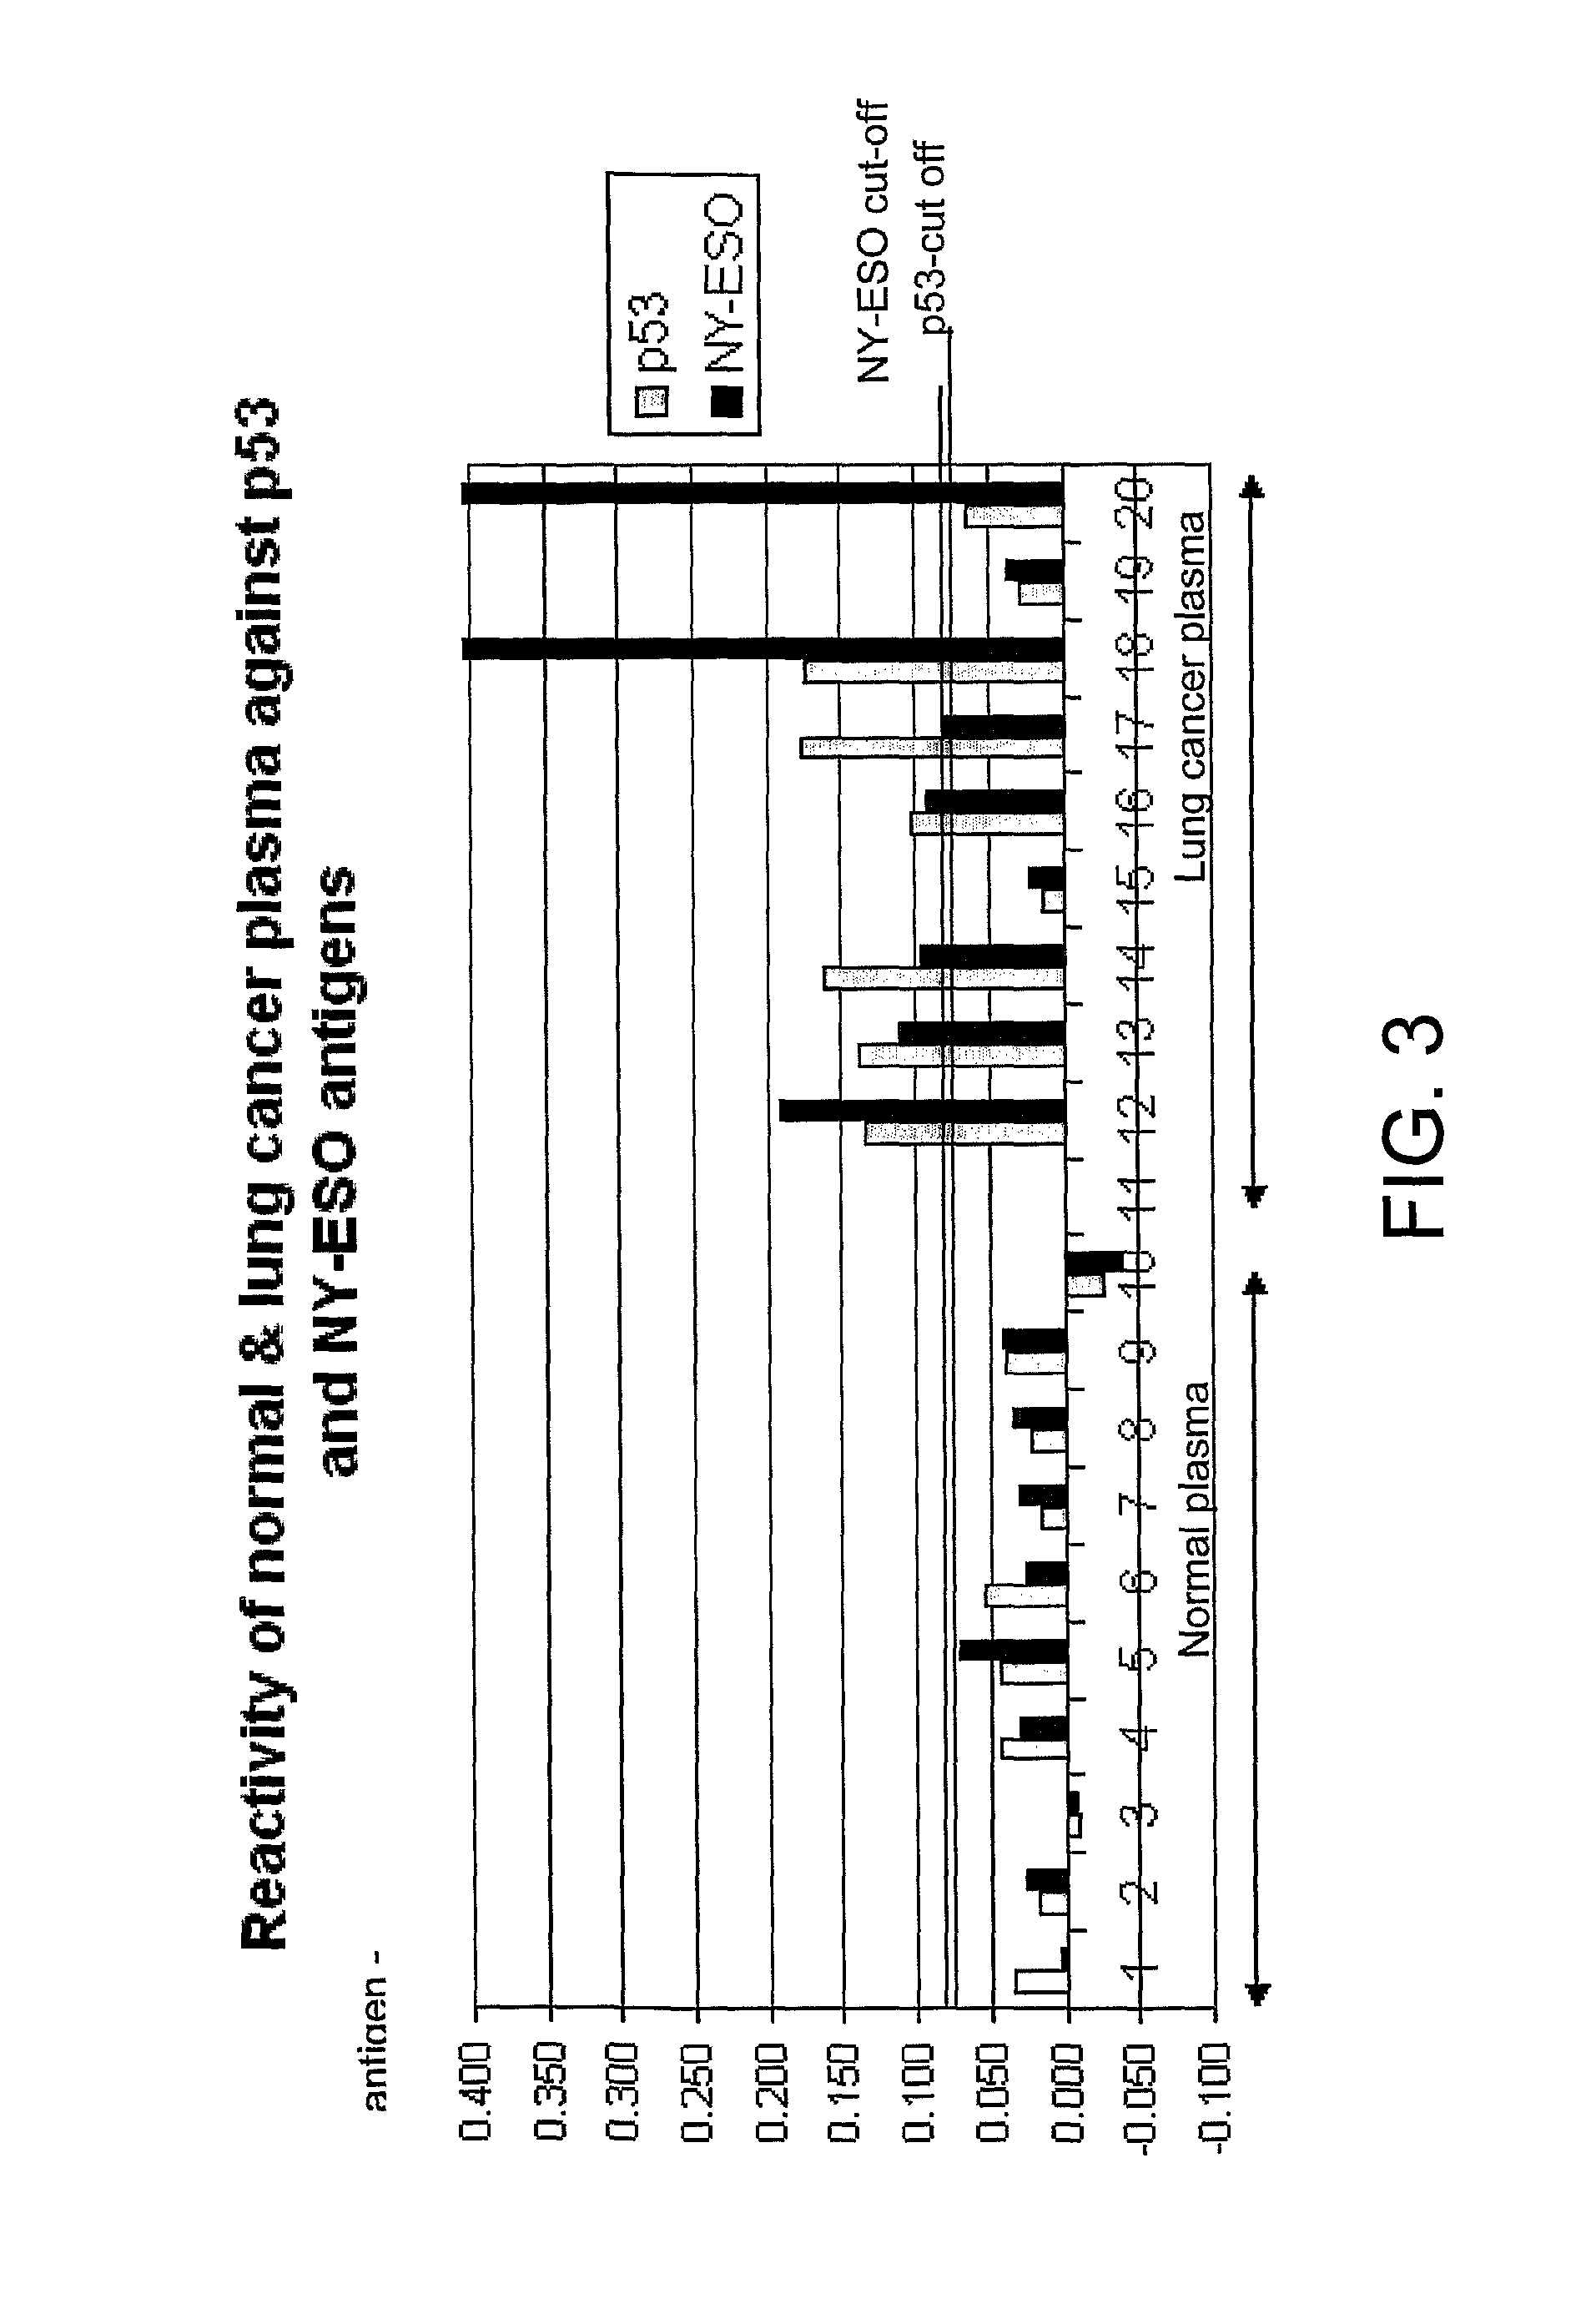
[0126]Analysis of autoantibody responses against 2 antigens (p53 and NY-ESO) in a pilot lung cancer study (10 normal and 9 lung cancer plasma) revealed a detection rate of 78% (FIG. 3).

[0127]The assay was carried out according to the general protocol of example 1, except that plasma samples were used instead of serum.

[0128]Positive patient samples exhibited sigmoidal titration curves similar to that shown in FIG. 1. FIG. 3 shows a comparison of p53 and NY-ESO autoantibody levels in normal individuals and patients with lung cancer as measured using the antigen titration assay. Normal cut-offs were calculated as the mean plus 2 standard deviations of the normal population.


PUM

PropertyMeasurementUnit
concentrationaaaaaaaaaa
relative strengthaaaaaaaaaa

Abstract

The invention relates to a method of detecting a disease state or disease susceptibility in a mammalian subject which comprises detecting an antibody in a test sample comprising a bodily fluid from said mammalian subject wherein said antibody is a biological marker of a disease state or disease susceptibility, the method comprising: (a) contacting said test sample with a plurality of different amounts of an antigen specific for said antibody, (b) detecting the amount of specific binding between said antibody and said antigen, (c) plotting or calculating a curve of the amount of said specific binding versus the amount of antigen for each amount of antigen used in step (a) and (d) determining the presence or absence of said disease state or disease susceptibility based upon the amount of specific binding between said antibody and said antigen at each different antigen concentration used.

Description

CROSS REFERENCE TO RELATED APPLICATIONS[0001]This application is the U.S. National Phase of PCT / GB2006 / 001944 filed on 26 May 2006 which claims the benefit of U.S. Provisional Patent Application No. 60 / 685,422 filed on 27 May 2005 and Great Britain Patent Application No. 0510943.4, filed 27 May 2005, the contents of which are incorporated by reference herein.FIELD OF THE INVENTION[0002]The invention generally relates to the field of diagnostic or prognostic assays and in particular relates to optimisation of assays for the detection of antibodies in a sample comprising patient bodily fluid, wherein such antibodies are used as biological markers of a disease state or disease susceptibility.BACKGROUND TO THE INVENTION[0003]Many diagnostic, prognostic and / or monitoring assays rely on detection of a biological marker of a particular disease state or disease susceptibility. Such biological markers are commonly proteins or polypeptides that are characteristic of a particular disease or as...

Claims


Application Information

Patent Timeline
Patent Type & Authority Patents(United States)
IPC IPC(8): G01N33/574G01N33/53G01N33/564
CPCG01N2800/52G01N33/564G01N2800/102G01N33/574G01N33/57484G01N33/53
Inventor ROBERTSON, JOHN FORSYTH RUSSELLBARNES, ANTHONYMURRAY, ANDREACHAPMAN, CAROLINE
Owner ONCIMMUNE
Learn More