Electromagnetic field intensity real time visualized method

A technology of electromagnetic field strength and electromagnetic field, which is applied in the field of real-time visualization of electromagnetic field strength, can solve problems such as difficult to show changes in electromagnetic field distribution, affect real-time effects, and cannot display isosurface conditions, etc.

Inactive Publication Date: 2008-08-13
UNIV OF ELECTRONICS SCI & TECH OF CHINA
View PDF0 Cites 39 Cited by
  • Summary
  • Abstract
  • Description
  • Claims
  • Application Information

AI Technical Summary

Problems solved by technology

[0004] However, this technology only realizes the three-dimensional visualization of static electromagnetic fields and electromagnetic scalar data, without considering the visualization of dynamically variable electromagnetic fields and electromagnetic vector data, and the visualization scheme is single; moreover, this technology scans data in units of layers, which is relatively independent. The amount of data in 3D reconstruction is large; a large number of algorithms are used in the process of visualization of 3D data field, including reading, calling and storing of discrete point data, scanning and searching of data, reconstruction of isosurface, and isovalue The interpolation operation of the three-dimensional coordinates of the surface triangle surface and the calculation of the normal vector, the rendering and drawing of the isosurface triangle surface, etc., run slowly; this technology describes the three-dimensional object by splicing and fitting the surface of the object by geometric units Structural, that is, the surface rendering method is used to realize the visualization of the three-dimensional isosurface. Due to the consideration of symmetry, the system does not realize the random cutting of the three-dimensional electromagnetic field data, and cannot display the isosurface of any cross-section
In addition, because the surface rendering method cannot preserve the integrity of the data, its object is only displayed as an empty shell, and there is nothing inside the surface
[0005] Due to the diversity, continuity, and variability of electromagnetic radiation sources, it is difficult to show the various distribution changes of the electromagnetic field using a single visualization method.
The amount of stored data is large, and the operation of the system needs to rely on high-performance hardware. Generally, it can only be implemented on a graphics workstation, which limits its popular application, and a large number of algorithm applications cause slow running speed and affect the real-time effect.

Method used


Image

  • Electromagnetic field intensity real time visualized method
  • Electromagnetic field intensity real time visualized method
  • Electromagnetic field intensity real time visualized method

Examples


Embodiment Construction

[0067] Below in conjunction with accompanying drawing, the present invention is described in further detail:

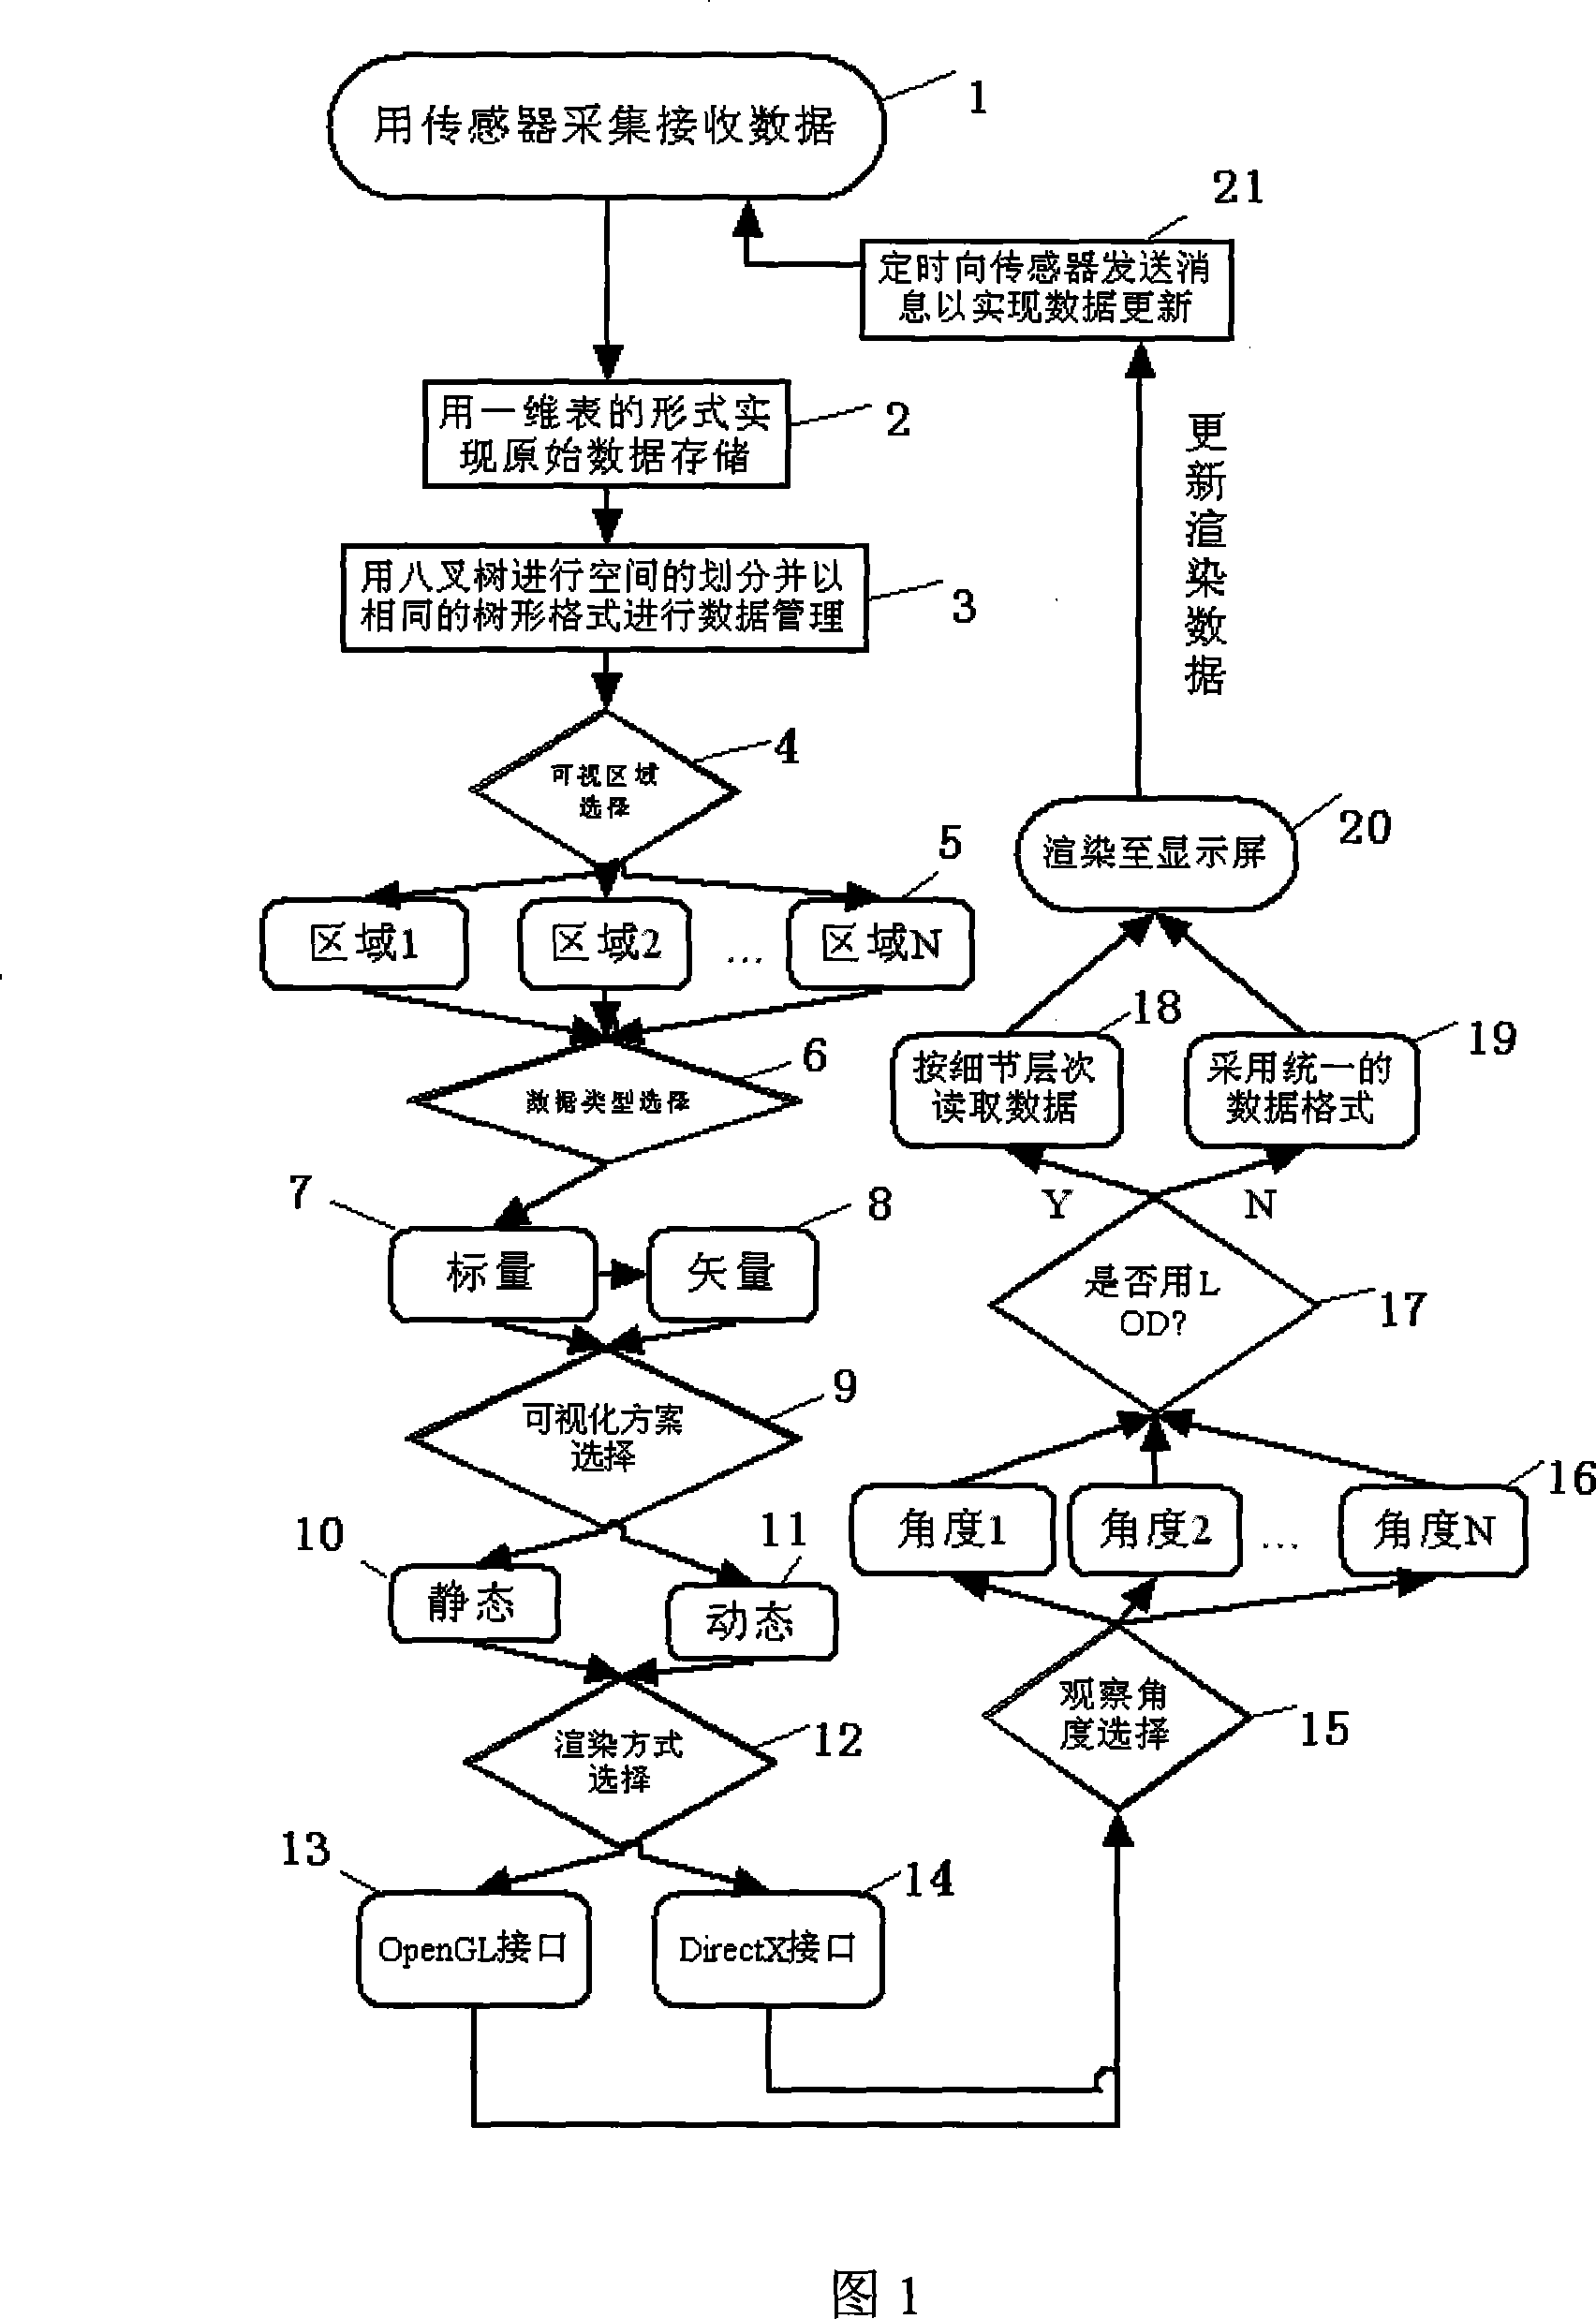
[0068] Fig. 1 is a flow chart of the present invention:

[0069] The real-time visualization method of electromagnetic field strength is realized by the following steps:

[0070] Step 1, the spatial electromagnetic field intensity data in the form of discrete points is collected in real time by the sensor; the main data collected are concentrated near the electromagnetic field emission source; the electromagnetic field data is transmitted in real time by the electromagnetic field detector;

[0071] Step 2, store the raw data of electromagnetic field intensity in the form of a one-dimensional table; the form of each storage unit is P(x, y, z, r, E); wherein, x, y, z represent the center of the electromagnetic field data point collected Space coordinates, r is the space radius of the area represented by the electromagnetic field intensity; E indicates the electromagnet...


PUM


Abstract

The present invention relates to a real-time visualization method of electromagnetic field intensity. Collected electromagnetic field intensity data is processed storage management by using octree storage structure, and is select processed scalar visualization or vector visualization according with need, graphics drawing and romance is realized by using OpenGL or DirectX as 3D program interface selecting static state graphics image or animation method visual electromagnetic field; data is read according with detail level, or order and data need to be romanced to graphics processing unit are confirmed and romanced to display screen using uniform data format; electromagnetic field visualization effect can be dynamic realized finally by updating romance data. Processing efficiency of electromagnetic field intensity real-time visualization can be increased and multiformity request of electromagnetic field visualization method can be satisfied by using the method. The system can be realized in normal PC machine, dependency of system to high performance can be reduced and universality of electromagnetic visualization appliance is broadened.

Description

technical field [0001] The invention relates to a method for real-time visualization of electromagnetic field strength. Background technique [0002] The research on electromagnetic field visualization technology is based on the existing electromagnetic field point data in three-dimensional space. With the help of visualization technology, the type, attribute, and distribution of electromagnetic signals in the ground space are comprehensively displayed, in order to guide objects affected by electromagnetic fields, such as aircraft. and provide a basis for control. Visualization is an in-depth analysis of a large number of abstract or invisible calculation results and data generated in scientific computing. With the help of computer graphics and image processing technologies, the digital information involved and generated in the computer is transformed into Physical phenomena or physical quantities that are intuitive, represented by images or graphical information, and that ...

Claims


Application Information

Patent Timeline
Patent Type & Authority Applications(China)
IPC IPC(8): G06T15/00G01R29/08
Inventor 陈雷霆白忠建何明耘崔金钟蔡洪斌
Owner UNIV OF ELECTRONICS SCI & TECH OF CHINA
Why Eureka
Try Eureka