

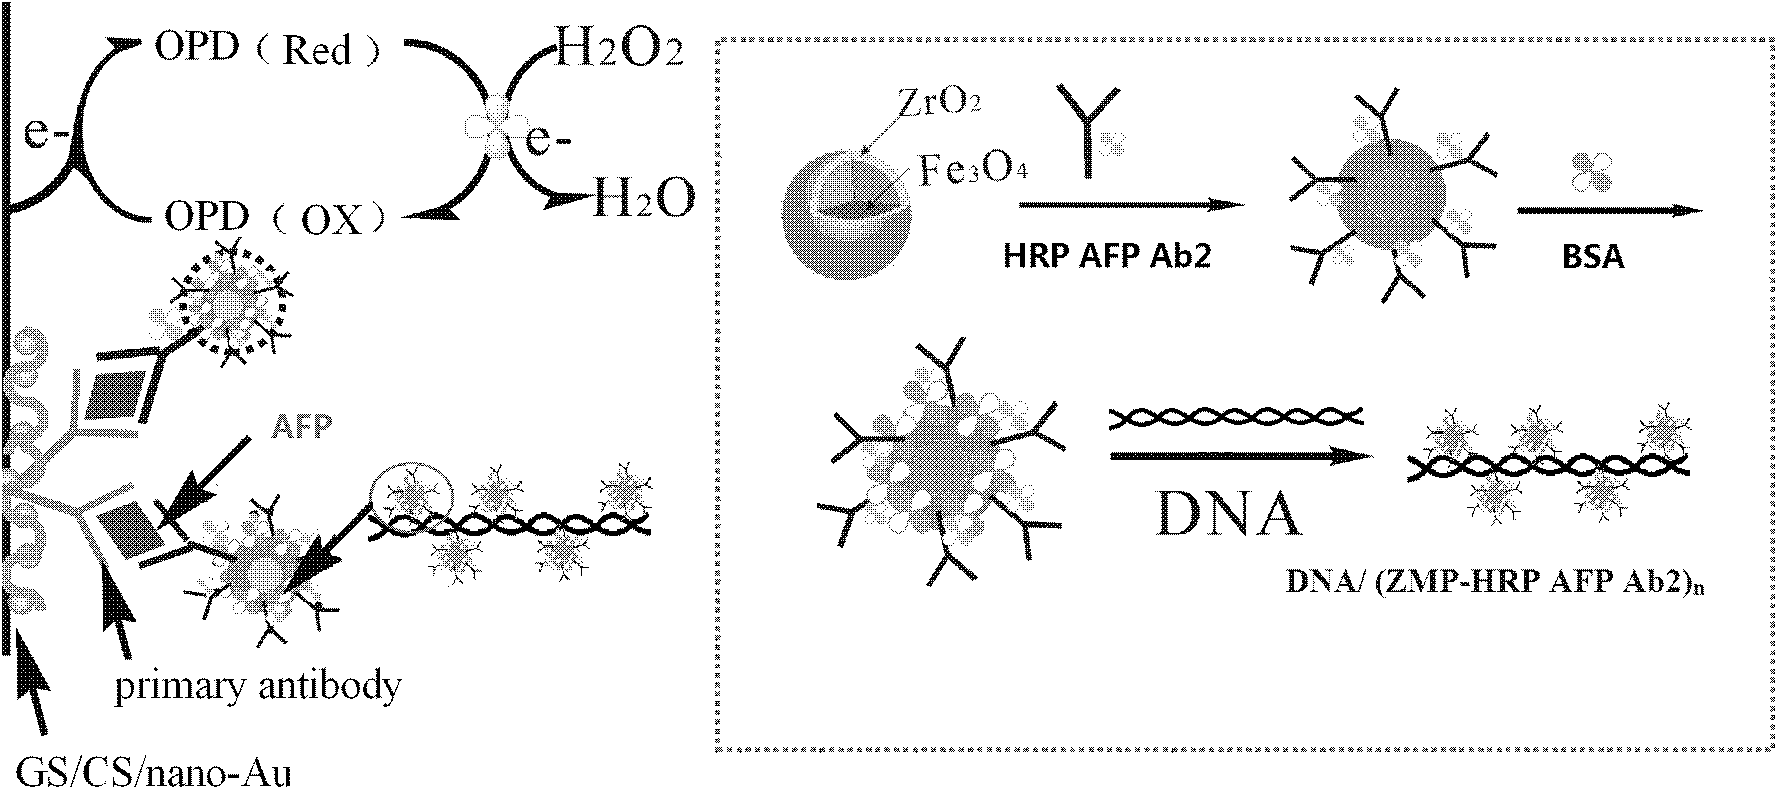
Secondary antibody probe for sandwich immune reaction by using amperometric immunosensor
An immunosensor and probe technology, applied in the field of molecular recognition probes, can solve problems such as difficulty in overcoming the influence of non-specific adsorption, limited enrichment effect of secondary antibodies, and inability to update electrodes, thereby eliminating the need for centrifugation and washing processes. , not easy to inactivate, and the effect of low detection limit
- Summary
- Abstract
- Description
- Claims
- Application Information
AI Technical Summary
Problems solved by technology
Method used
Image

Examples
Embodiment 1
[0029] 1. Preparation and characterization of secondary antibody probes
[0030] (1) Preparation of magnetic nanoparticles
[0031] Preparation of magnetic nanoparticles: For specific preparation methods, please refer to the invention patent application with publication number CN 101302361A.
[0032] Characterization of Magnetic Nanoparticles: Fe by X-ray Fluorescence Spectroscopy (XRF) 3 o 4 / ZrO 2 To characterize, Zr-K appeared β (17.8keV), Zr-K α (15.8keV), Zr-L β (2.1ke), Zr-L α (2.0keV) peak and Fe-K β (7.1KeV), Fe-K α (6.4keV) peak, indicating that Zr and Fe elements exist in the magnetic particles.
[0033] (2) Preparation and characterization of antibody-loaded nanospheres
[0034] Preparation of antibody-loaded nanospheres: Disperse 10 mg of magnetic nanoparticles in 5 mL of pH 7.0 phosphate buffer, add 1 mg of horseradish peroxide-labeled alpha-fetoprotein secondary antibody (HRP-anti-AFP), and stir for 6 h , magnetically separated under magnetic condition...
Embodiment 2
[0058] Embodiment 2 (comparative experiment 1)
[0059] 1. Experimental materials
[0060] 1. Antigen and antibody: AFP antigen standard, alpha-fetoprotein monoclonal primary antibody (anti-AFP), horseradish peroxidase-labeled alpha-fetoprotein polyclonal antibody (HRP-anti-AFP) and AFP ELISA kit Both purchased Zhengzhou Bosai Biotechnology Co., Ltd.
[0061] 2. Amperometric immunosensor: prepared according to the method described in Example 1.
[0062] 3. Secondary antibody probe
[0063] 3.1. Sample: the secondary antibody probe prepared by the method described in Example 1.
[0064] 3.2. Reference substance
[0065] Control substance 1:
[0066] (1) Preparation of magnetic nanoparticles
[0067] Preparation of magnetic nanoparticles: For specific preparation methods, please refer to the invention patent application with publication number CN 101302361A.
[0068] (2) Preparation and characterization of antibody-loaded nanospheres
[0069] Preparation of antibody-load...
Embodiment 3
[0087] 1. Preparation and characterization of secondary antibody probes
[0088] (1) Preparation and characterization of magnetic nanoparticles
[0089] Shown in step 1 with embodiment 1.
[0090] (2) Preparation and characterization of antibody-loaded nanospheres
[0091] Preparation of antibody-loaded nanospheres: 10 mg of magnetic nanoparticles were dispersed in 5 mL of pH 7.0 phosphate buffer, and 1 mg of horseradish peroxidase-labeled HIV p24 antibody (HRP-anti-HIV p24) was added. After stirring for 6 hours, an external magnetic field was applied to separate the unbound antibody to obtain antibody-loaded nanospheres.
[0092] (3) Preparation of nanospheres
[0093] Shown in step 3 with embodiment 1.
[0094] (4) Preparation of secondary antibody probe
[0095] Shown in step 4 with embodiment 1.
[0096] 2. Use the secondary antibody probe to detect the antigen concentration
[0097] (1) Preparation of Amperometric Immunosensor
PUM
 Abstract
Description
Claims
Application Information