Cyanobacteria biomass spatial-temporal change monitoring and visualization method based on remote sensing image

A technology of remote sensing images and temporal and spatial changes, applied in photogrammetry/video metrology, surveying and navigation, measuring devices, etc., can solve the problems of cyanobacteria bloom cause analysis, lack of watershed and water network analysis, inability to analyze and intuitively express And other issues

Inactive Publication Date: 2013-04-24
TONGJI UNIV +1
View PDF2 Cites 35 Cited by
  • Summary
  • Abstract
  • Description
  • Claims
  • Application Information

AI Technical Summary

Problems solved by technology

At the same time, current similar cyanobacterial biomass monitoring systems lack watershed and water network analysis, and mainly rely solely on remote sensing images for cyanobacterial outbreak monitoring
It is impossible to analyze and intuitively express the impact of environmental and meteorological factors such as the outbreak mechanism of cyanobacteria blooms, the impact of watersheds, wind force and temperature on the basis of making full use of the existing digital geographic information
Therefore, it is difficult to provide reliable support and guidance for the analysis of the causes of cyanobacterial blooms, and it is also impossible to effectively achieve a comprehensive analysis of the temporal and spatial distribution and changes of cyanobacterial blooms.

Method used


Image

  • Cyanobacteria biomass spatial-temporal change monitoring and visualization method based on remote sensing image
  • Cyanobacteria biomass spatial-temporal change monitoring and visualization method based on remote sensing image
  • Cyanobacteria biomass spatial-temporal change monitoring and visualization method based on remote sensing image

Examples


Embodiment 1

[0065] A method for monitoring and visualizing temporal and spatial changes in cyanobacterial biomass based on remote sensing images, the method comprising the following steps:

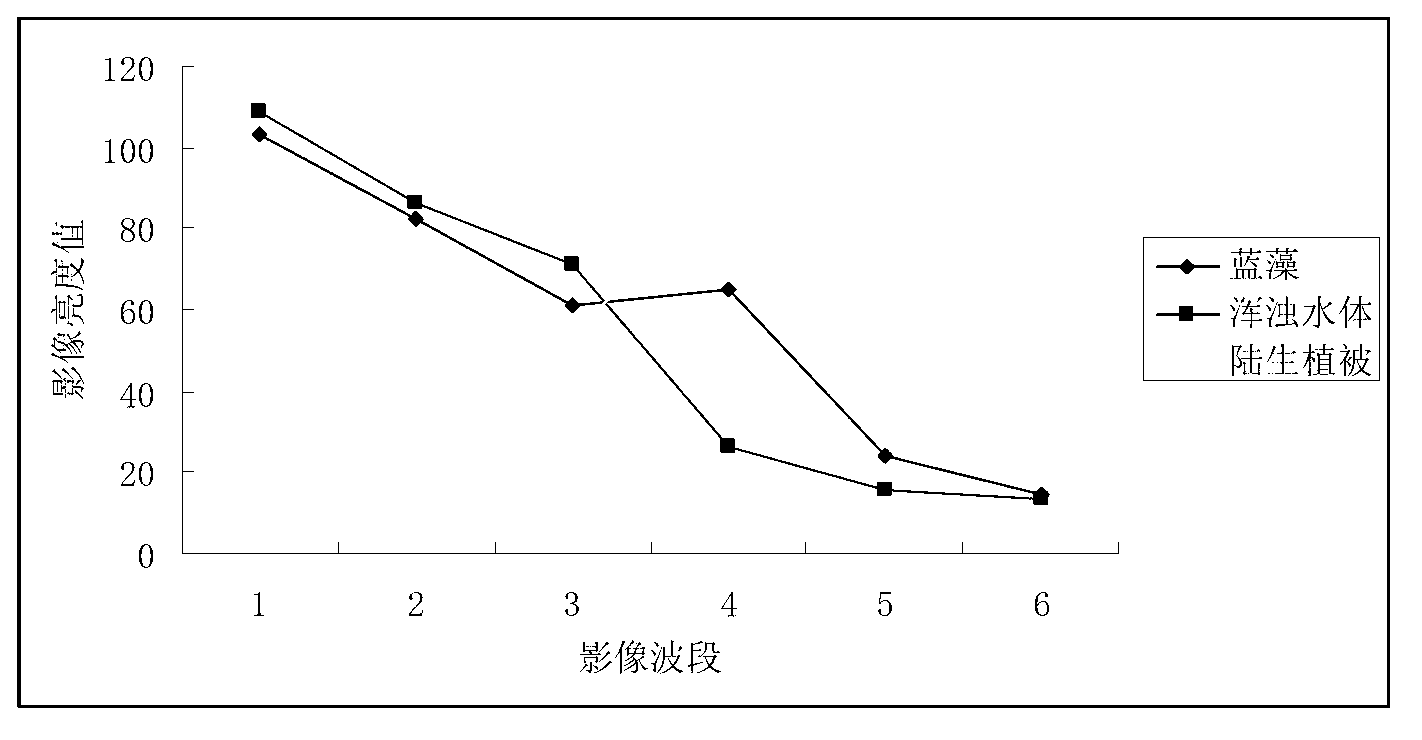
[0066] 1) Obtain the remote sensing image of the cyanobacteria area, and perform image preprocessing on it to construct a normalized cyanobacteria index;

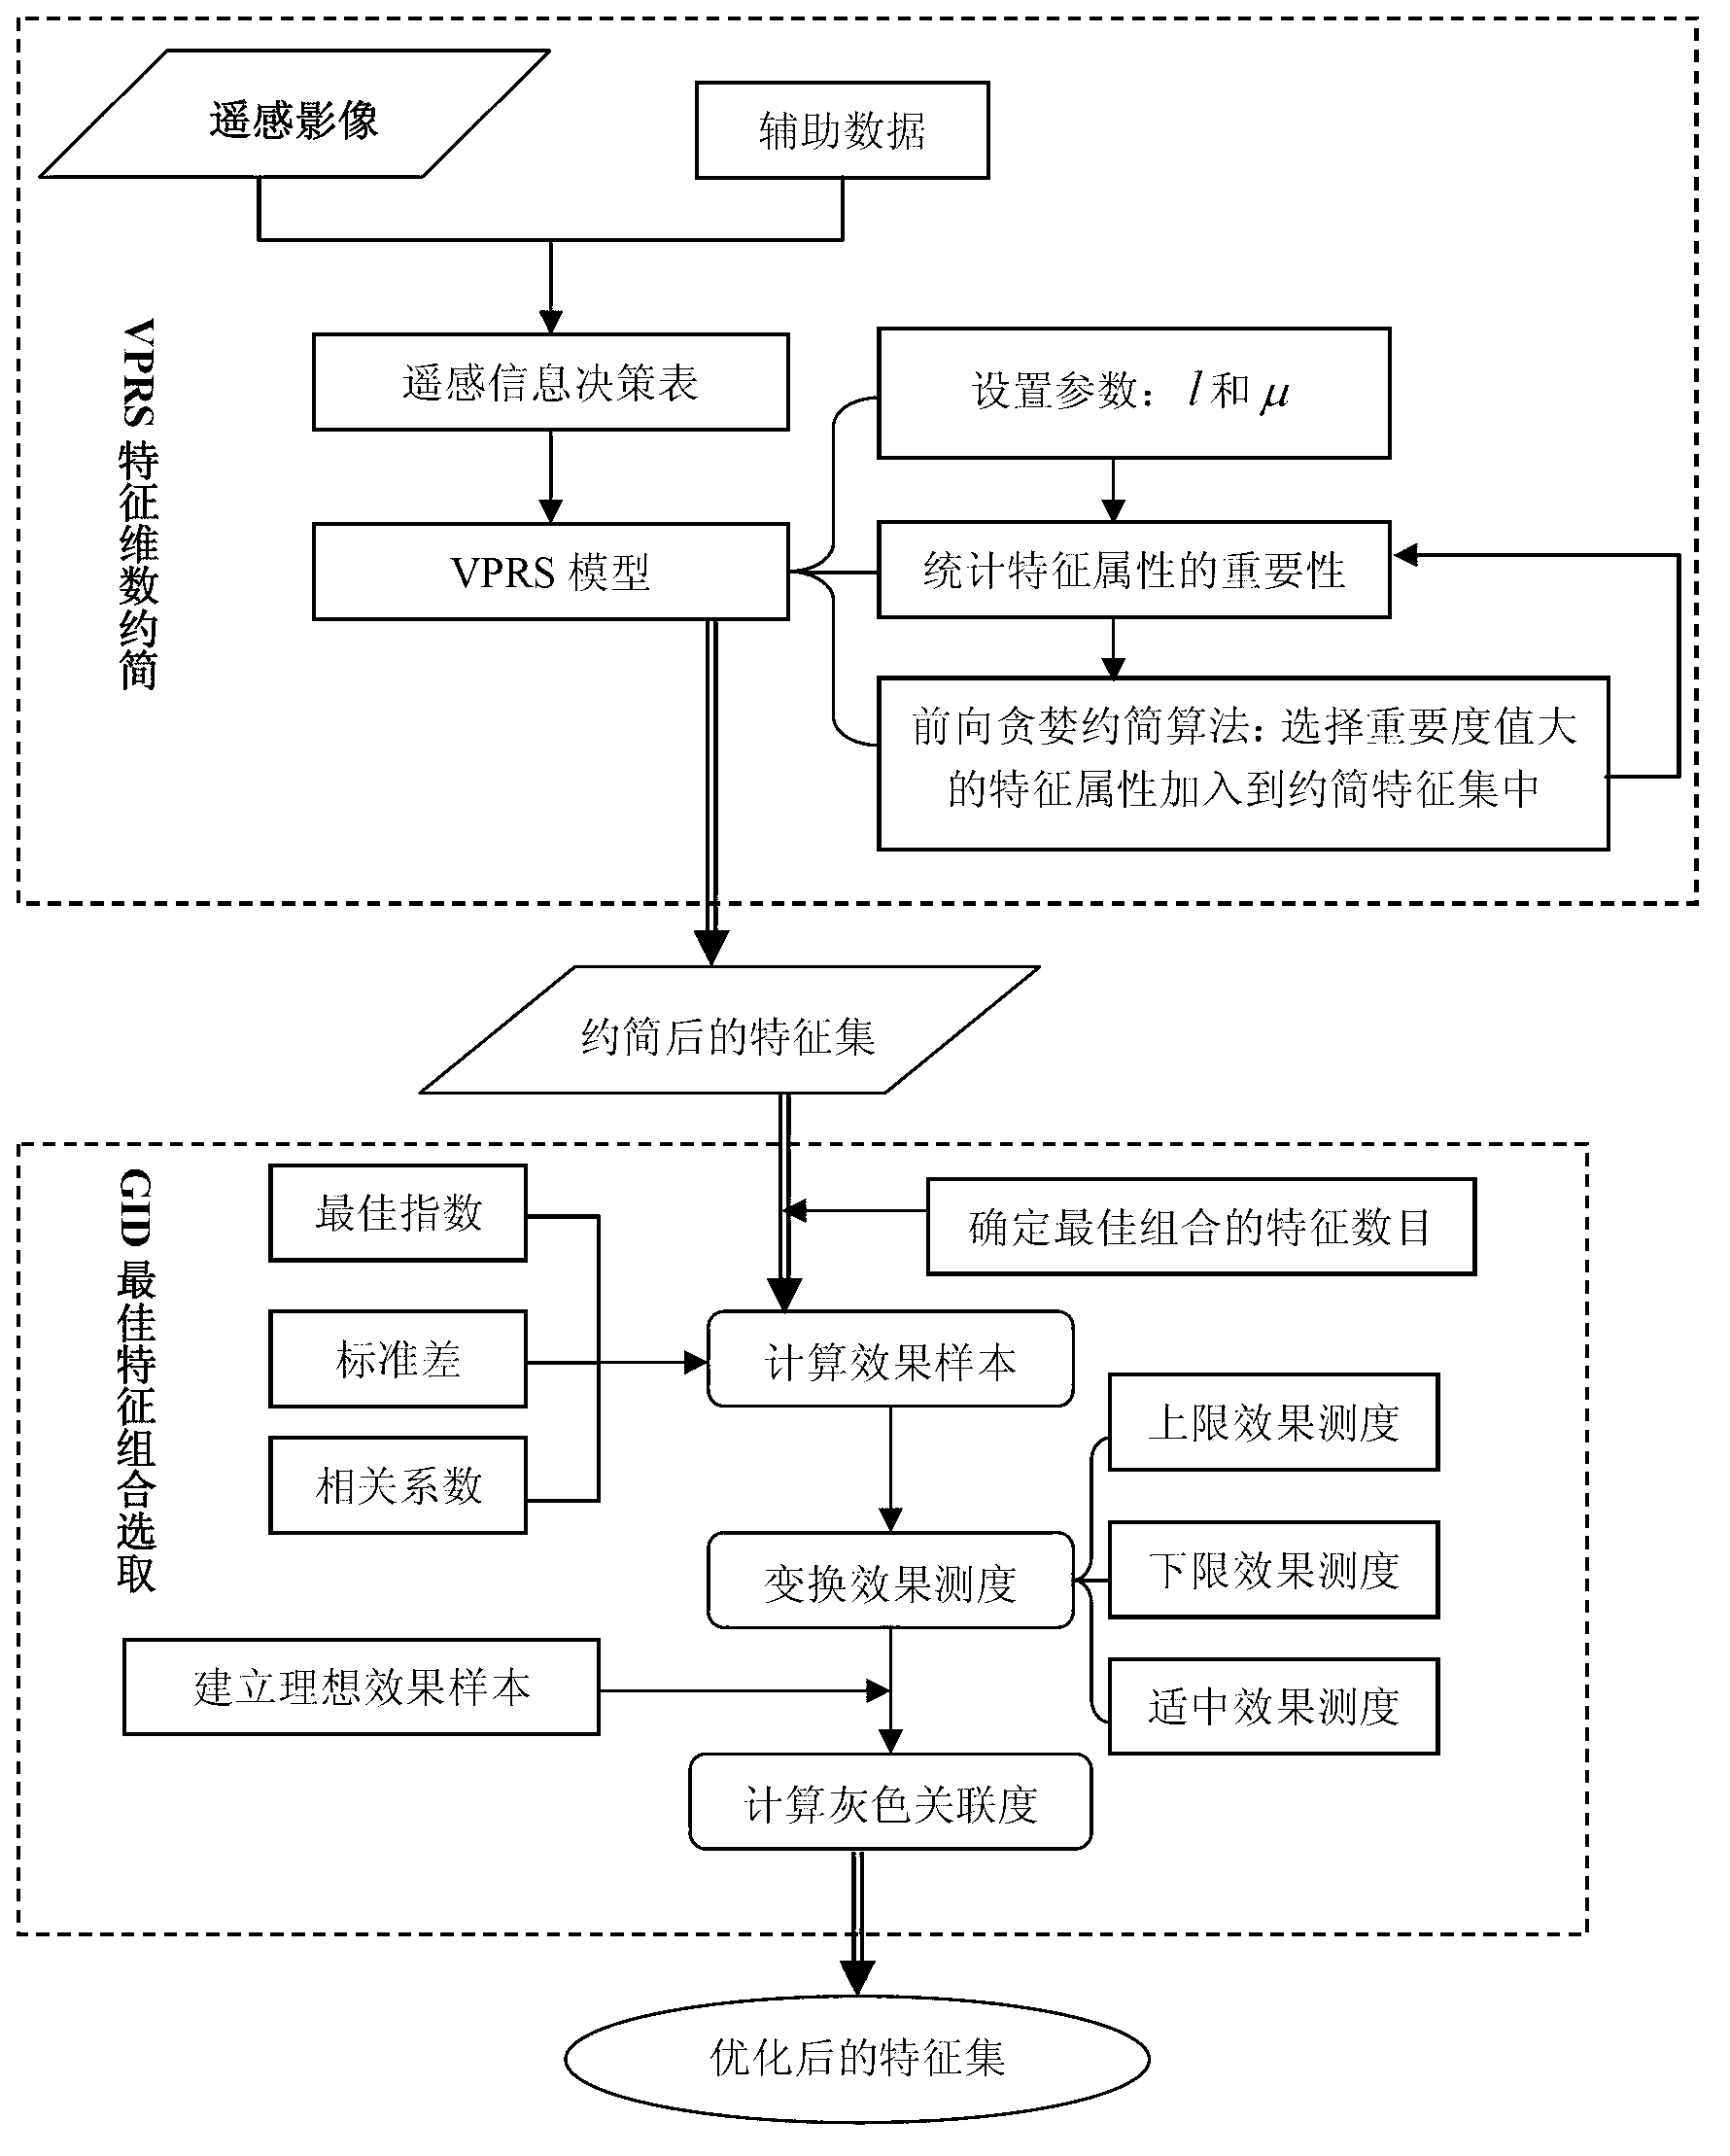
[0067] 2) Using the feature optimization model based on VPRS_GID to optimize the features of remote sensing images, and obtain the optimized multi-feature space;

[0068] 3) Establish a double-weighted SVM classification model based on wavelet kernels according to the multi-feature space, obtain the optimal classification decision surface of SVM, and use the classification model to extract and identify the spatial distribution information of cyanobacteria (Microcystis) and detect changes, and combine the field Survey data for comprehensive verification and precision analysis;

[0069] 4) Superimpose and display the processed remote sensing image, ...

Embodiment 2

[0177] The method for monitoring and visualizing temporal and spatial changes of cyanobacterial biomass based on remote sensing images in Example 1 is used below for actual operation.

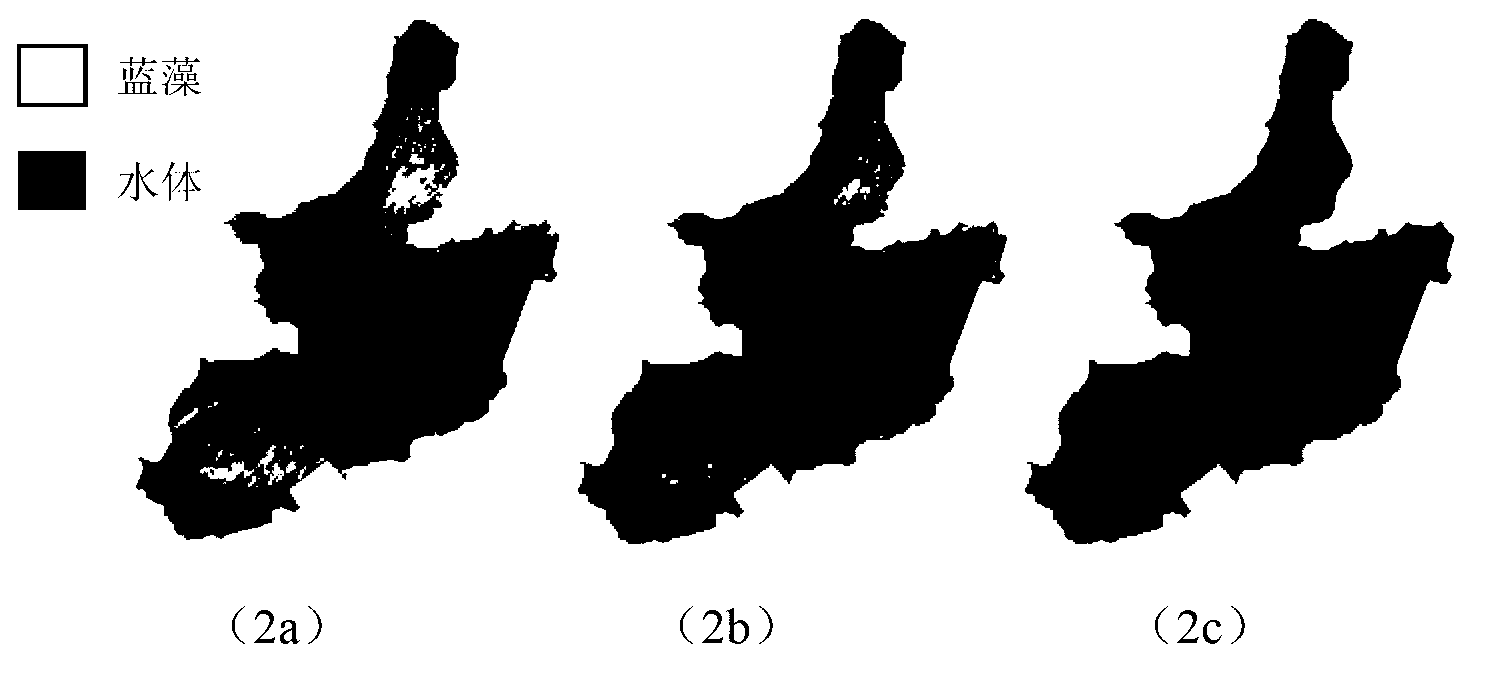
[0178] 1. Cyanobacteria (Microcystis) spatial distribution extraction and change detection results

[0179] The Landsat7ETM+ images acquired on August 1 and September 2, 2000 were selected. Using the wavelet kernel double weighted SVM classification model, the identification and detection results of the spatial distribution pattern of Microcystis in the Dianshan Lake area were obtained.

[0180] Set up 10 sampling areas along the Dianshan Lake to conduct field sampling of cyanobacterial biomass. It is found that the extraction results of remote sensing images are consistent with the actual survey data. And the image of August 1, 2000, where Microcystis is more obvious, was selected for error matrix statistics.

[0181] Table 1 Error matrix of information extraction of cyanobacteria (Microcys...


PUM


Abstract

The invention relates to a cyanobacteria biomass spatial-temporal change monitoring and visualization method based on a remote sensing image. The method comprises the following steps: (1) pre-processing the remote sensing image of a research region, and constructing a normalized difference cyanobacteria bloom index (NDI-CB); (2) optimizing characteristics of the remote sensing image by using a characteristic optimization model based on VPRS (Variable Precision Rough Set)-GID (Grey Incidence Decision), and obtaining an optimized multi-characteristic space; (3) establishing a double-weighted SVM (Support Vector Machine) classification model based on a wavelet kernel according to the multi-characteristic space, performing extraction identification and change detection on the spatial distribution information of cyanobacterial bloom, and performing comprehensive verification and precision analysis by combining field observation data; and (4) performing overlapping display on the processed remote sensing image, GIS (Geographic Information System) vector data and the field observation data, thereby realizing the analog simulation of spatial-temporal change processes and rules of erupting the cyanobacterial bloom. Compared with the prior art, the cyanobacteria biomass spatial-temporal change monitoring and visualization method based on the remote sensing image has advantages of high cyanobacteria identifying precision and reliability, and the like, and is beneficial to analyzing and judging of causes and distribution changes of the cyanobacterial bloom.

Description

technical field [0001] The invention relates to a water environment monitoring technology, in particular to a remote sensing image-based monitoring and visualization method for temporal and spatial changes in cyanobacterial biomass. Background technique [0002] Judging from the monitoring work of eutrophication and cyanobacterial bloom at home and abroad, due to the constraints of natural conditions, time and space and other factors, traditional monitoring methods have certain limitations. It is costly and time-consuming, and it is difficult to make a comprehensive investigation of the temporal and spatial dynamic distribution and changes of algae in large lakes. With the continuous advancement of remote sensing technology, the use of satellite remote sensing data has become an effective method for large-scale and rapid assessment of water quality in the identification and detection of pollution in vast waters. In particular, the use of multi-temporal satellite image data ...

Claims


Application Information

Patent Timeline
Patent Type & Authority Applications(China)
IPC IPC(8): G01C11/00G01C11/04
Inventor 林怡潘琛王嘉楠任文伟叶勤屈铭志刘冰陆渊
Owner TONGJI UNIV
Why Eureka
Try Eureka