
Mercury ion colloidal gold colorimetric detection method and mercury ion detection kit
A technology of colloidal gold and mercury ions, which is applied in the field of biochemistry, can solve the problems of high cost, difficult preparation of nucleic acid unaccompanied bodies, and complicated operation, and achieve the effects of low cost, good stability, and fast sensitivity
- Summary
- Abstract
- Description
- Claims
- Application Information
AI Technical Summary
Problems solved by technology
Method used
Image

Examples
Embodiment 1
[0029] Example 1 The Mercury ion colloidal gold colorimetric detection method comprises the following steps:
[0030] (1) Prepare the sodium citrate-wrapped gold nanoparticle solution with the sodium citrate reduction method;
[0031] Boil 0.1% chloroauric acid until boiling, then quickly add 1% sodium citrate under vigorous stirring, until the color of the solution turns bright red, continue to boil for 5 minutes to stabilize the gold nanoparticle solution.
[0032] (2) adding Hg in the gold nanoparticle solution prepared in step (1) 2+ , by electrostatic adsorption to Hg 2+ immobilized on the surface of gold nanoparticles;
[0033] Concentrate the gold nanoparticle solution prepared in step (1) to 4 times by centrifugation (9400 xG), take 7 centrifuge tubes (No. 1, 2, 3, 4, 5, 6, 7, 8), add 80 µL of 4-fold concentrated gold nanoparticle solution and 10 µL of Hg of different concentrations 2+ solution so that Hg 2+ The final concentrations were 0, 0.01, 0.02, 0.05, 0.1...
Embodiment 2
[0038] Example 2 Referring to steps (1)-(2) of Example 1, the prepared gold nanoparticle solution was concentrated to 4 times by centrifugation (9400 xG), and 7 centrifuge tubes (No. 1, 2, 3, 4, 5, 6 , 7, 8), 80 μL of 4-fold concentrated gold nanoparticle solution and 10 μL of different concentrations of Hg were added to each tube 2+ solution so that Hg 2+ The final concentrations were 0, 0.01, 0.02, 0.05, 0.1, 0.2 and 0.5 nM, reacted for 5 min, and Hg 2+ immobilized on the surface of gold nanoparticles.
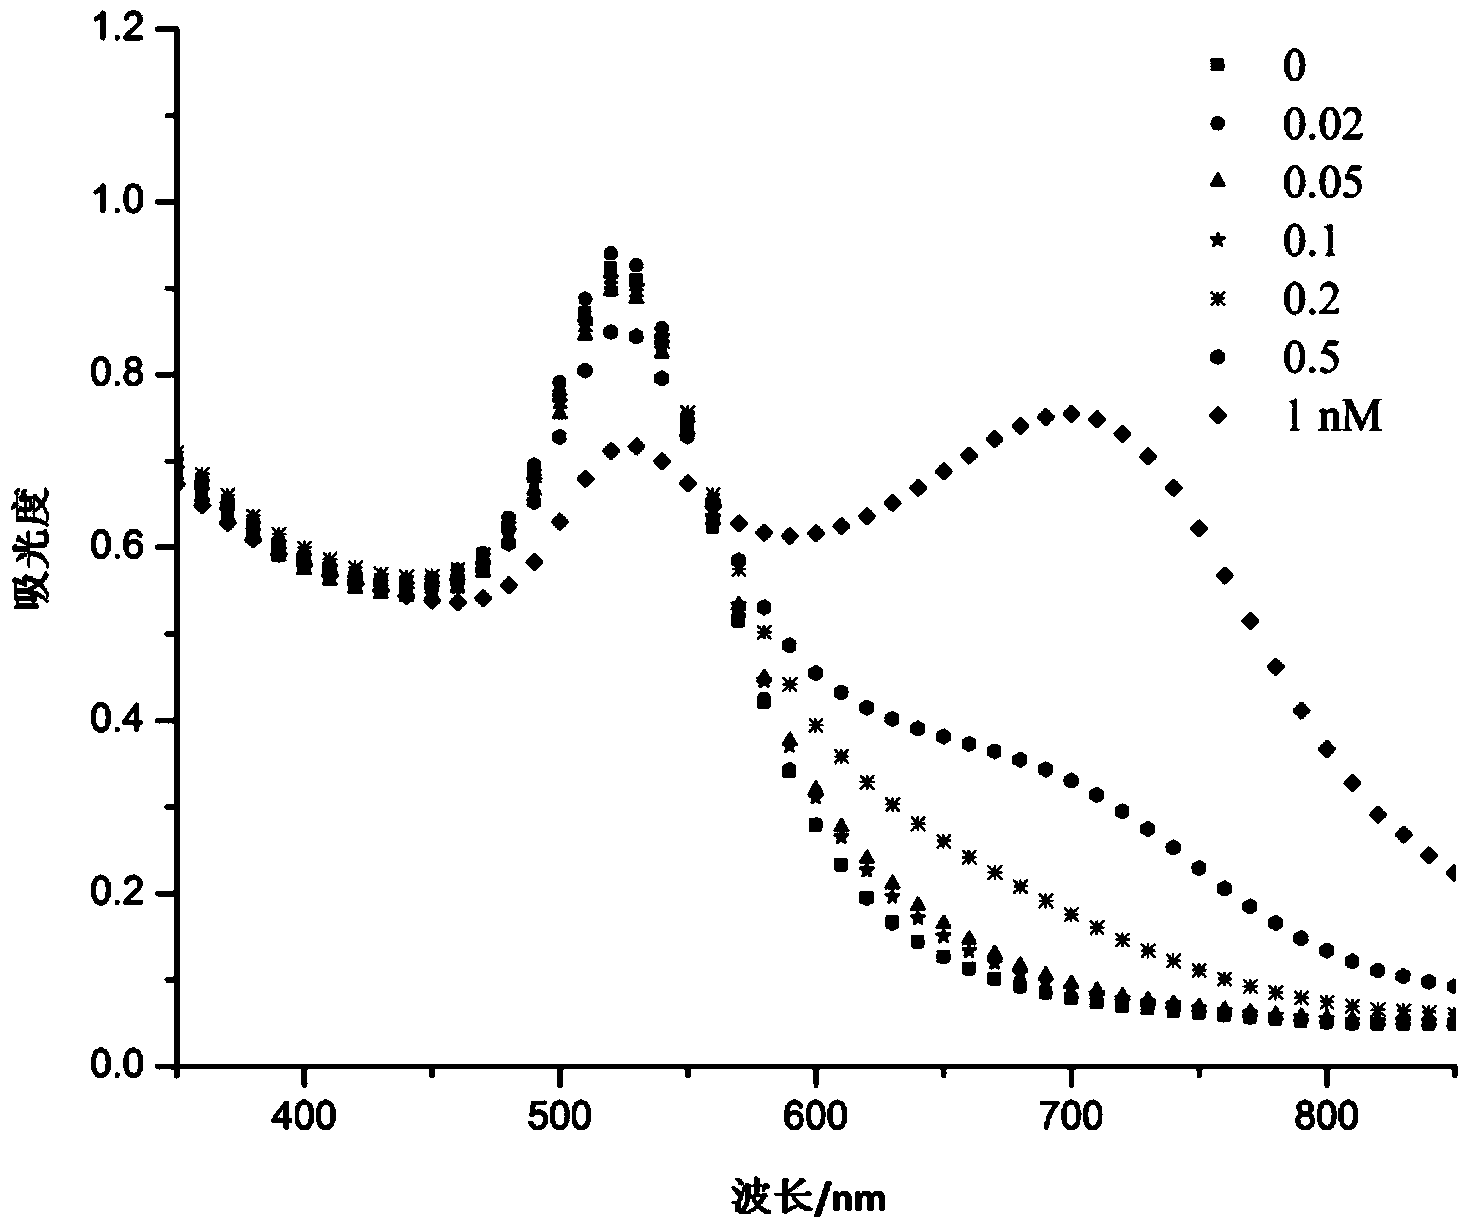
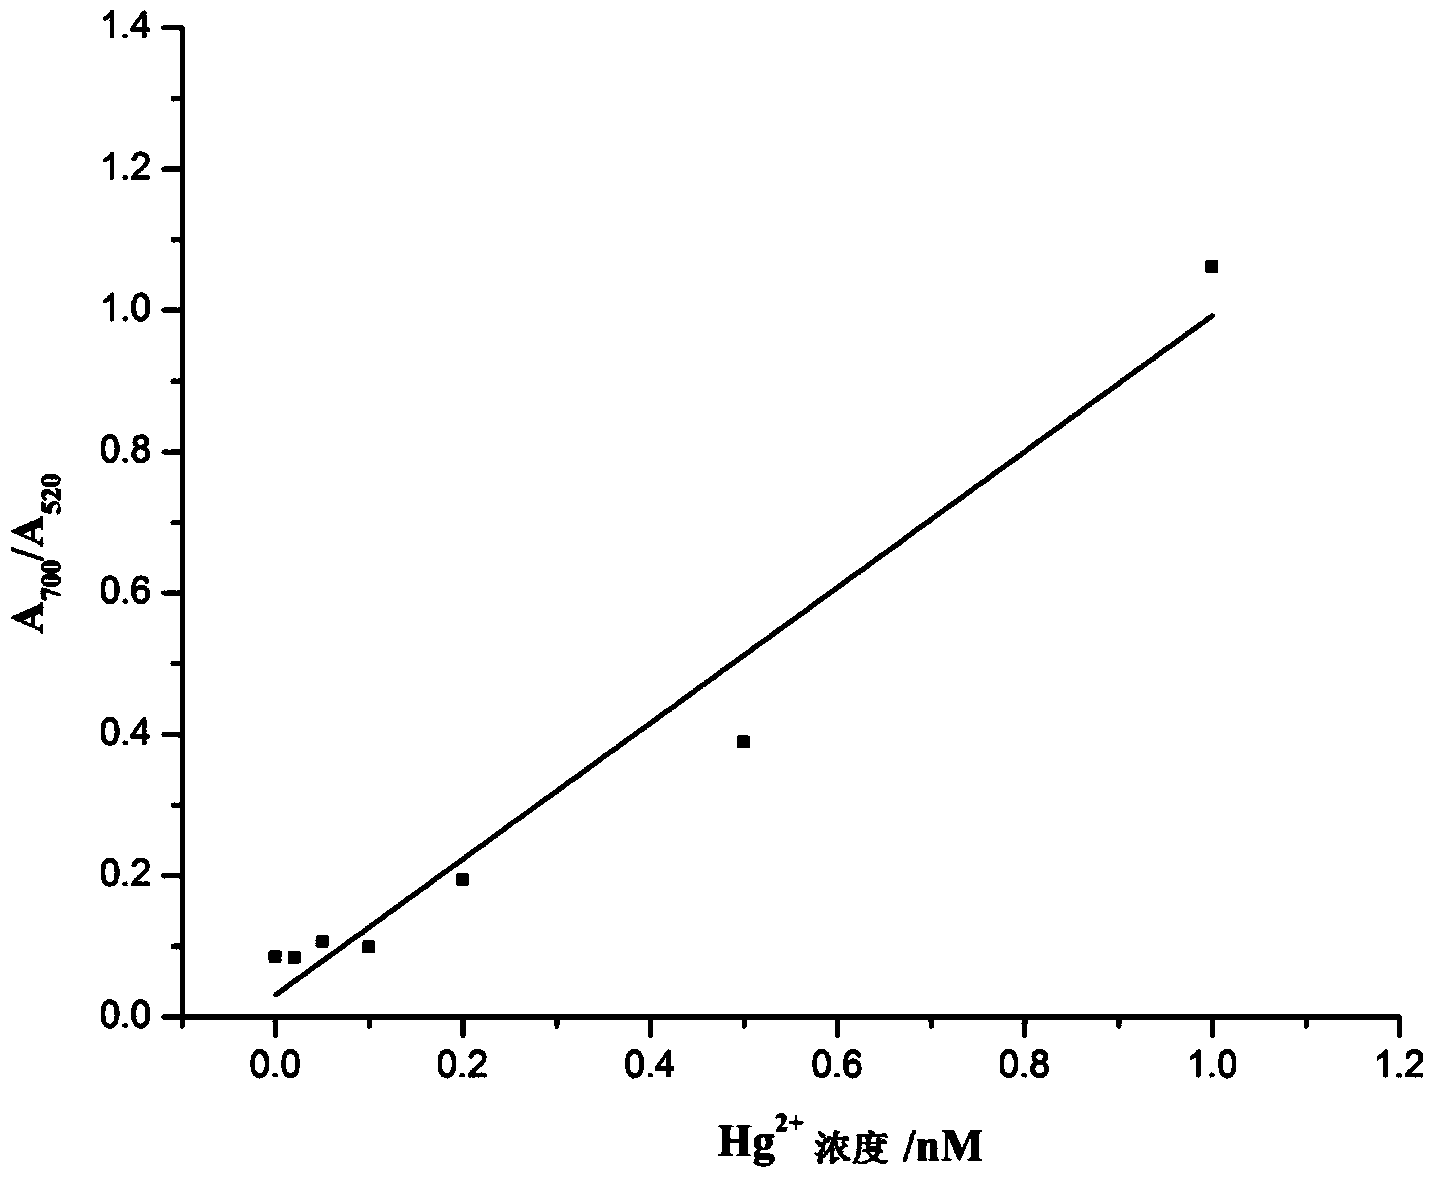
[0039] Then 10 μL of 0.4 mM lysine was added to each of the aforementioned solutions, so that the Hg adsorbed on the surface of gold nanoparticles 2+ and both ends of lysine -NH 2 The formation of N-Hg-N structure enables the aggregation of gold nanoparticles. Use a UV-visible spectrophotometer to measure the UV spectrum of each tube solution from 200 nm to 850 nm, and according to A 700 / A 520 A standard curve was drawn. The result is as Figure 1-Figure 2 shown. ...
Embodiment 3
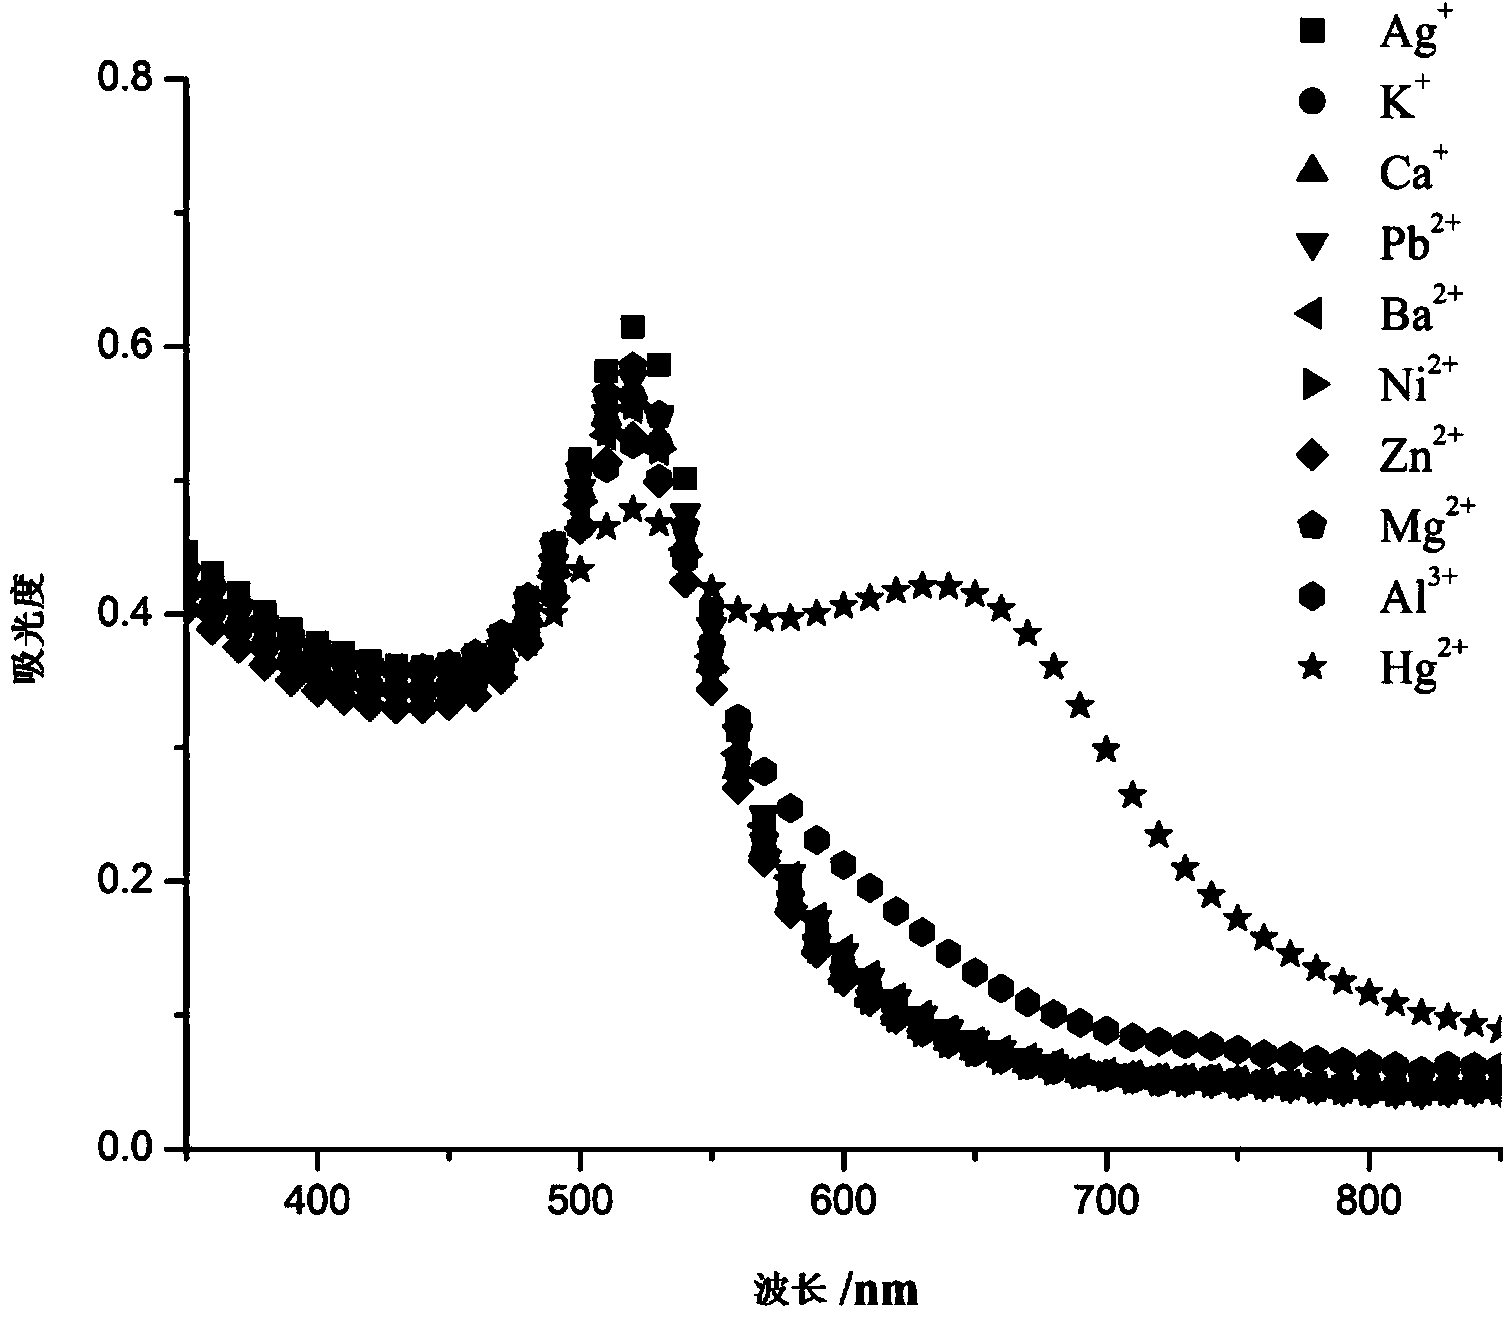
[0040] Example 3 Take 10 centrifuge tubes (No. 1, 2, 3, 4, 5, 6, 7, 8, 9, 10), and add 80 μL of 4-fold concentrated gold nanoparticle solution and 10 μL of different metal ion solutions (Ag + , K + , Ca 2+ , Pb 2+ , Ba 2+ , Ni 2+ , Zn 2+ , Mg 2+ , Al 3+ 100 nM; Hg 2+ 1 nM), reacted for 5 min, and fixed the metal ions on the surface of gold nanoparticles by electrostatic adsorption.
[0041] Then add 10 μL of 0.4 mM lysine to the solution obtained in the previous step, and observe the color of the solution. Use a UV-visible spectrophotometer to measure the UV spectrum of each tube solution from 200 nm to 850 nm, and according to A 700 / A 520 Draw a histogram of the ratio of . The result is as Figure 3-Figure 4 shown.
PUM
 Abstract
Description
Claims
Application Information