

Fluorescent nanometer probe for detecting hydrogen sulfide and preparation method and application of fluorescent nanometer probe
A fluorescent probe, hydrogen sulfide technology, applied in the field of analysis, can solve the problems of cost increase, waste of organic liquid phase, etc., and achieve the effect of simple preparation
- Summary
- Abstract
- Description
- Claims
- Application Information
AI Technical Summary
Problems solved by technology
Method used
Image

Examples
Embodiment 1
[0044] First step, preparation and characterization of precursors
[0045] (a) Preparation of carbon quantum dots: put 1g Tris powder in a 10mL beaker, heat it to 230°C with a heating mantle and keep it for 20 minutes to melt it. Dilute in water. Use a fluorescence spectrophotometer to detect the fluorescence intensity of the system composed of secondary water and Tris, and continue to add water until the fluorescence intensity of the system reaches the maximum value, then stop adding secondary water to obtain nitrogen-containing carbon quantum dots, that is, CQDs, The pH value is 10.
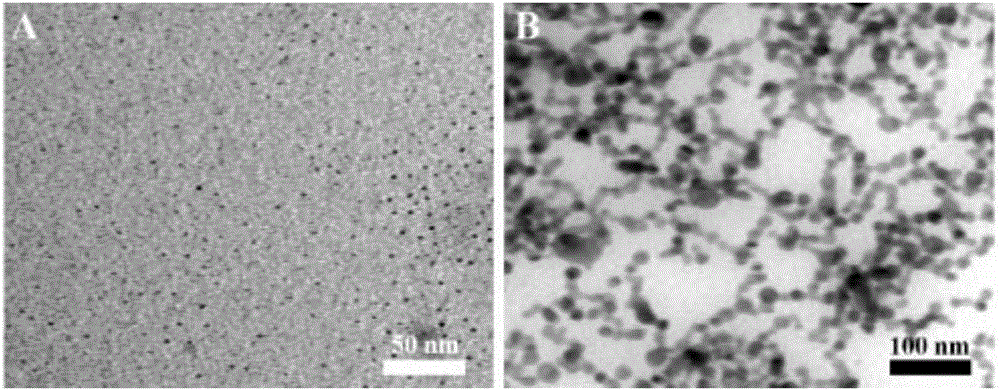
[0046] Characterization of CQDs: CQDs were characterized by transmission electron microscopy, and the results were as follows figure 2 As shown in A. It can be seen from the figure that the CQDs are uniformly distributed in the aqueous phase with uniform particle size. According to statistical analysis, the particle size distribution of CQDs is 2-4nm, with an average particle size of 3.15n...
Embodiment 2
[0058] Keeping the steps in Example 1 unchanged, the volume ratio of the aqueous solution of fixed CQDs and AgNPs is 2:1, and only the pH of CQDs is controlled at 7 experimental values between 1-14: 1, 4, 6, 7, 8 , 10, 14, in order to optimize the experimental conditions for detecting hydrogen sulfide, so that Na 2 S is completely converted to H 2 S.
[0059] Utilize a fluorescence spectrophotometer to test the emission spectrum of each sample under 350nm excitation, and record the fluorescence intensity value at the maximum emission position, that is, 440nm, and then plot it against the pH value, as shown in Figure 4 Shown in B, is the influence of pH value on CQDs (a) and CQDs-AgNPs nanoprobe (b), each point is the fluorescence emission spectrum intensity at 440nm place; Na 2 After 100 μL of S solution, the fluorescence emission spectrum intensity at 440 nm.
[0060] It can be seen from the figure that adding Na to the CQDs-AgNPs nanoprobes 2 After S (c), the fluores...
Embodiment 3
[0066] Keep the steps in Example 1 unchanged, only the pH value of the probe is adjusted to 7 and the volume ratio of the aqueous solution of CQDs and nano-silver is controlled at 9 experimental values between 1000:1 and 2:5: 100: 1, 50:1, 20:1, 10:1, 5:1, 2:1, 5:4, 1:1, 2:3, 1:2, 2:5.
[0067] Use a fluorescence spectrophotometer to test the emission spectrum of each sample under excitation at 350nm, and record the fluorescence intensity value F at the maximum emission position at 440nm 1 , compare it with the CQDs initial value F a Subtract to get the fluorescence quenching difference ΔF=F a -F 1 , and then plot the ratio of ΔF and CQDs, AgNPs. like Figure 4 As shown in A, and analyzed to get the following conclusions:
[0068] When the proportion of CQDs is larger, the quenching effect is not obvious; and when the proportion of AgNPs is larger than that of CQDs, the degree of quenching effect tends to be stable.
[0069] Therefore, it is best to choose the ratio of...
PUM
| Property | Measurement | Unit |
|---|---|---|
| Particle size | aaaaa | aaaaa |
| The average particle size | aaaaa | aaaaa |
| Particle size | aaaaa | aaaaa |
Abstract
Description
Claims
Application Information