Method for testing content of sodium nitrite in food
A technology of sodium nitrite and content, applied in the measurement of color/spectral properties, material analysis by observing the effect on chemical indicators, and analysis by chemical reaction of materials, etc., can solve the problem of high measurement cost and long measurement time. , low reaction sensitivity and other problems, to achieve the effect of reducing the cost of measurement
- Summary
- Abstract
- Description
- Claims
- Application Information
AI Technical Summary
Problems solved by technology
Method used
Image

Examples
Embodiment 1
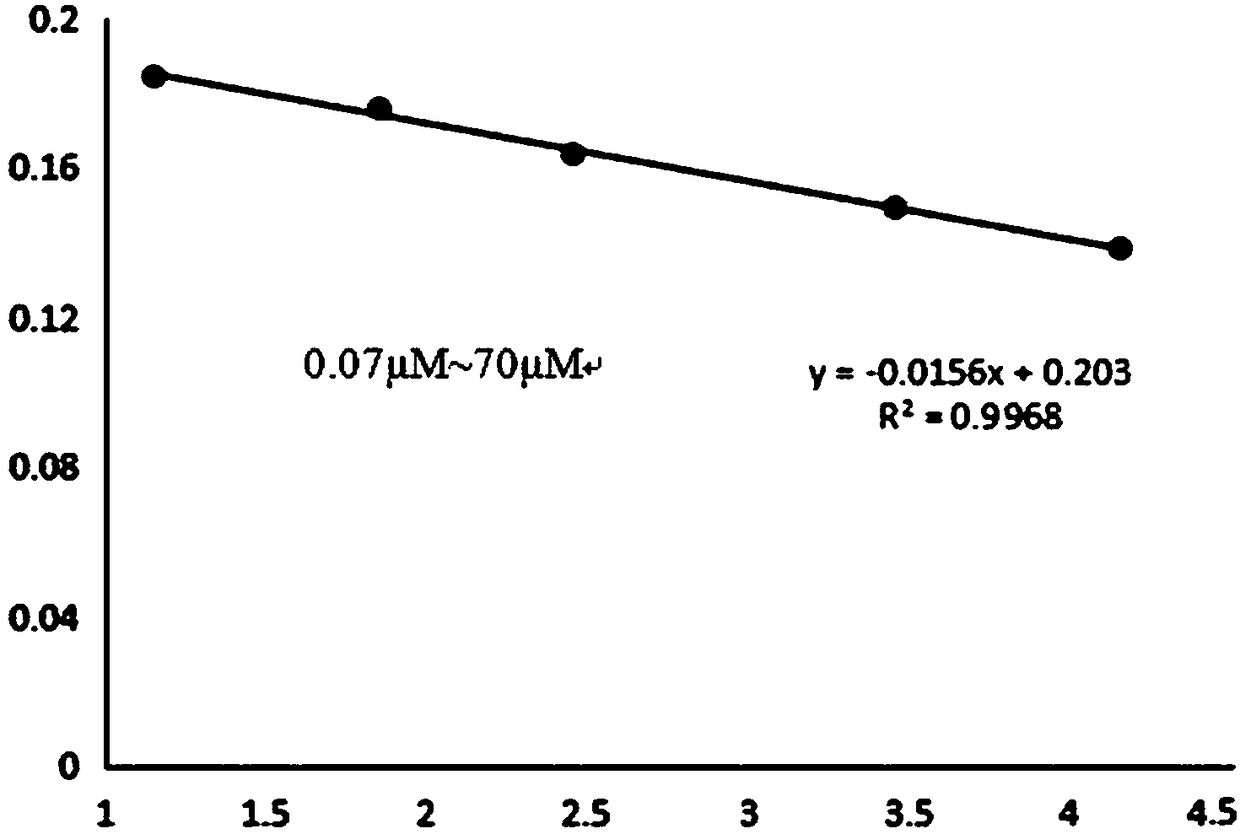
[0013] Embodiment 1: A method for measuring sodium nitrite content in food, adding sodium nitrite solution to the mixed solution of indigo and hydrogen peroxide and shaking reaction, wherein in the reaction system: the concentration of indigo is 00007M ~ 0.0035M, hydrogen peroxide The concentration is 0.0008M~0.0063M, the concentration of sodium nitrite is 0.07μM~0.07mM, the pH value of the system is 1~4, and the absorbance value at the wavelength of 695nm is measured after the reaction. Establish a standard curve and a linear regression equation on the ordinate, then add the solution of the analyte to the same mixed system of indigo and hydrogen peroxide to react, measure the absorbance value at a wavelength of 695nm, and obtain the concentration of the analyte through the linear regression equation and the standard curve. Sodium nitrite content.
[0014] The specific steps for making a standard curve are: A. Measure 0.3 mL of DL solution and add water to 10 mL, as a control ...
experiment example 1
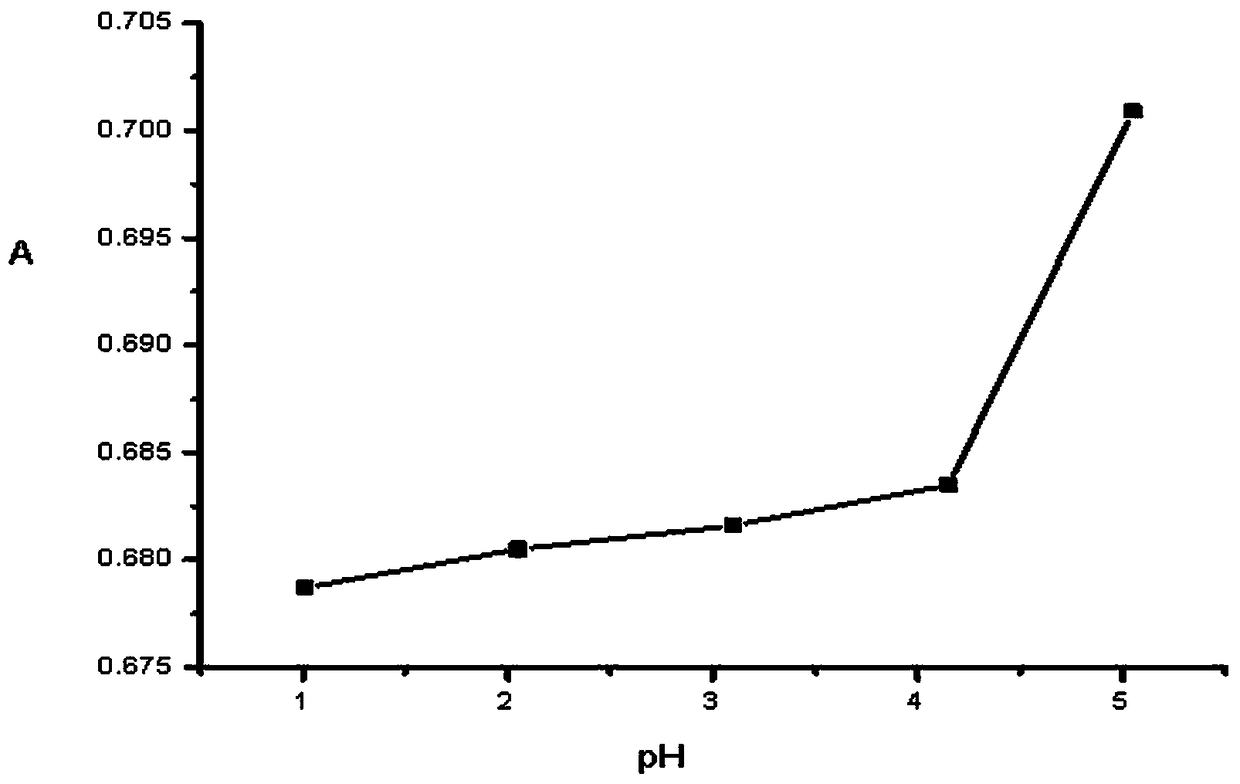
[0016] Experimental Example 1: The influence of different pH values on the absorbance of the solution: when the concentration of indigo is 0.108mM, the concentration of hydrogen peroxide is 27μM, and the concentration of sodium nitrite is 3.5μM, the pH of the solution is adjusted to 1.01, 2.05, 3.10, 4.15 respectively , 5.05, the absorbance A of the solution at a specific wavelength is as follows:
[0017] Table 1
[0018]
[0019] The absorbance line graph of the system under different pH conditions is shown in figure 1 . From the data in Table 1 and figure 1 It can be seen that when the pH of the system is greater than 5, the absorbance value of the solution increases, so the pH of the system is set at 1-4.
experiment example 2
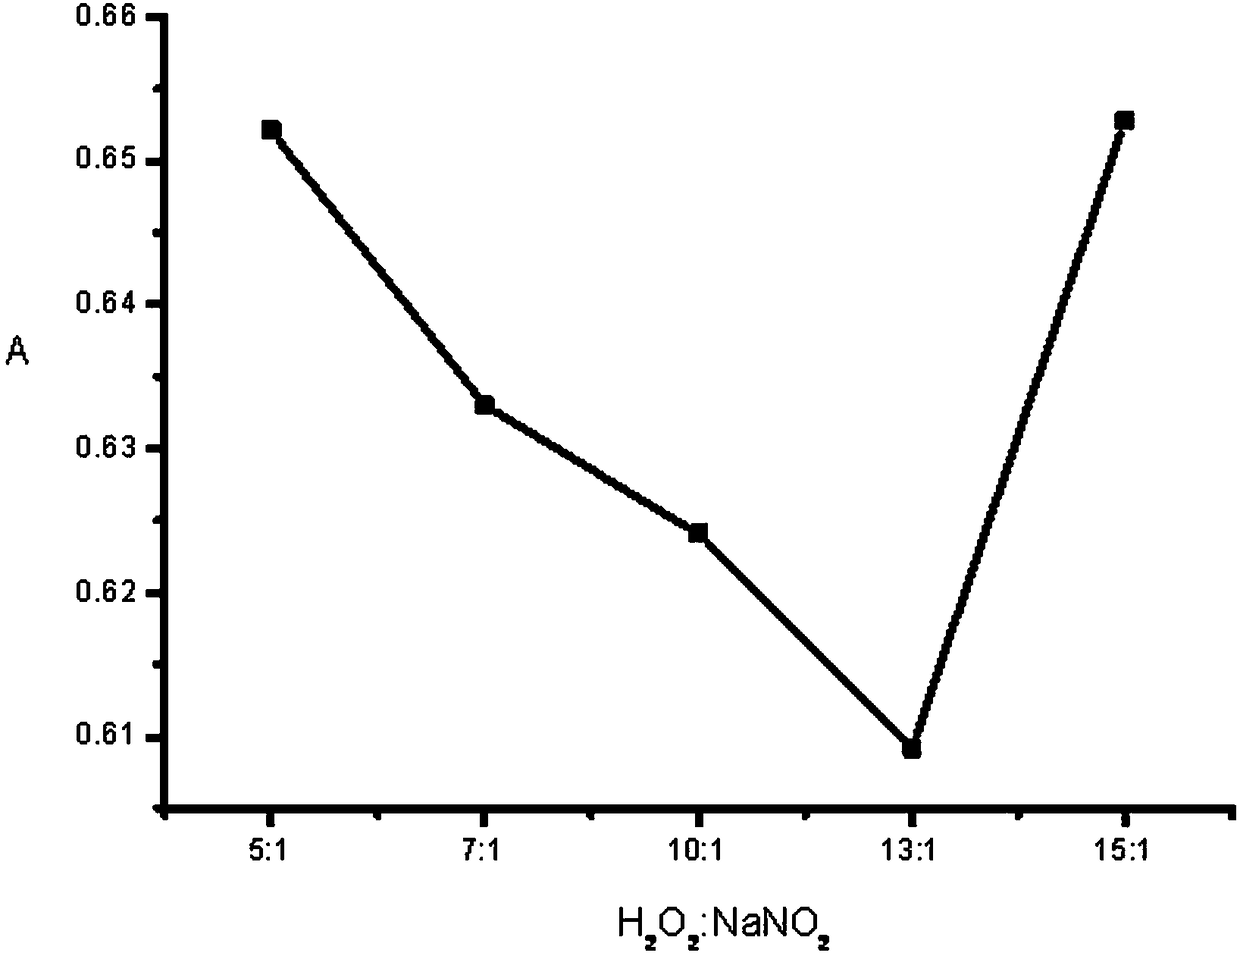
[0020] Experimental Example 2: The influence of different ratios of hydrogen peroxide and sodium nitrite on the absorbance of the solution: when the concentration of indigo is 108 μM and the pH of the solution is adjusted to 1.01, when the ratio of hydrogen peroxide and sodium nitrite is different, the concentration of the solution at a specific wavelength The absorbance is shown in Table 2. For a line graph with different ratios of hydrogen peroxide and sodium nitrite, see figure 2 , the ultraviolet spectrum of indigo with the increase of sodium nitrite concentration is shown in Figure 5 . Depend on Figure 5 It can be seen that with the increase of the concentration of sodium nitrite, the absorbance value of the solution decreases. The results show that when the ratio of hydrogen peroxide and sodium nitrite is 10:1 to 13:1, the absorbance value of the system is smaller than that of other ratios, so the ratio of hydrogen peroxide and sodium nitrite in the system is set a...
PUM
| Property | Measurement | Unit |
|---|---|---|
| absorbance | aaaaa | aaaaa |
| absorbance | aaaaa | aaaaa |
Abstract
Description
Claims
Application Information
 - R&D
- Intellectual Property
- Life Sciences
- Materials
- Tech Scout
- Unparalleled Data Quality
- Higher Quality Content
- 60% Fewer Hallucinations
Browse by: Latest US Patents, China's latest patents, Technical Efficacy Thesaurus, Application Domain, Technology Topic, Popular Technical Reports.
© 2025 PatSnap. All rights reserved.Legal|Privacy policy|Modern Slavery Act Transparency Statement|Sitemap|About US| Contact US: help@patsnap.com