Calculation method of gas-liquid-solid coupling for laser shock enhancement
A technology of laser shock strengthening and calculation method, which is applied in calculation, design optimization/simulation, and special data processing applications, etc. It can solve problems such as time-consuming, difficult optimization of laser shock strengthening process parameters, and a large amount of time-consuming and cost-intensive operations. Simple operation , Satisfy the amount of calculation and the effect of easy implementation
- Summary
- Abstract
- Description
- Claims
- Application Information
AI Technical Summary
Problems solved by technology
Method used
Image
Examples
Embodiment 1
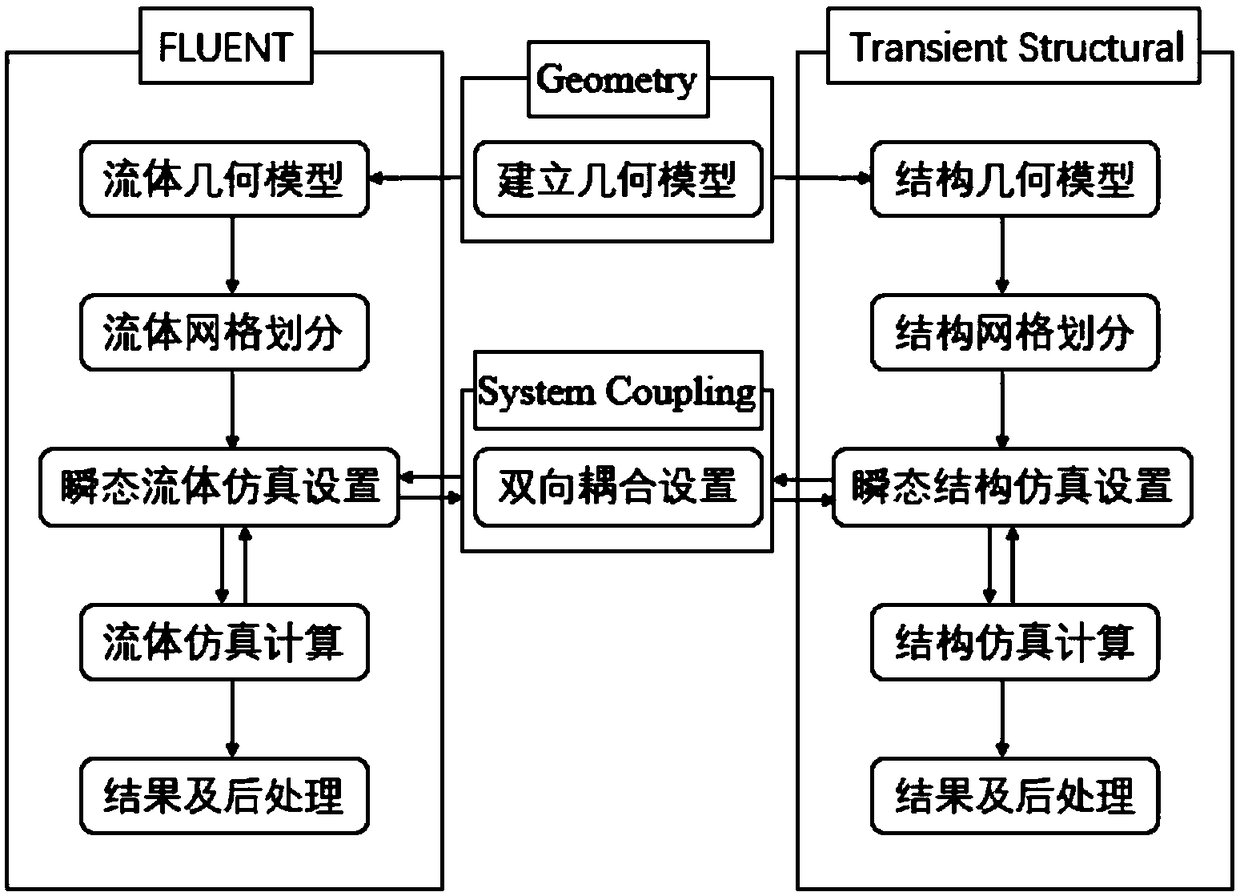
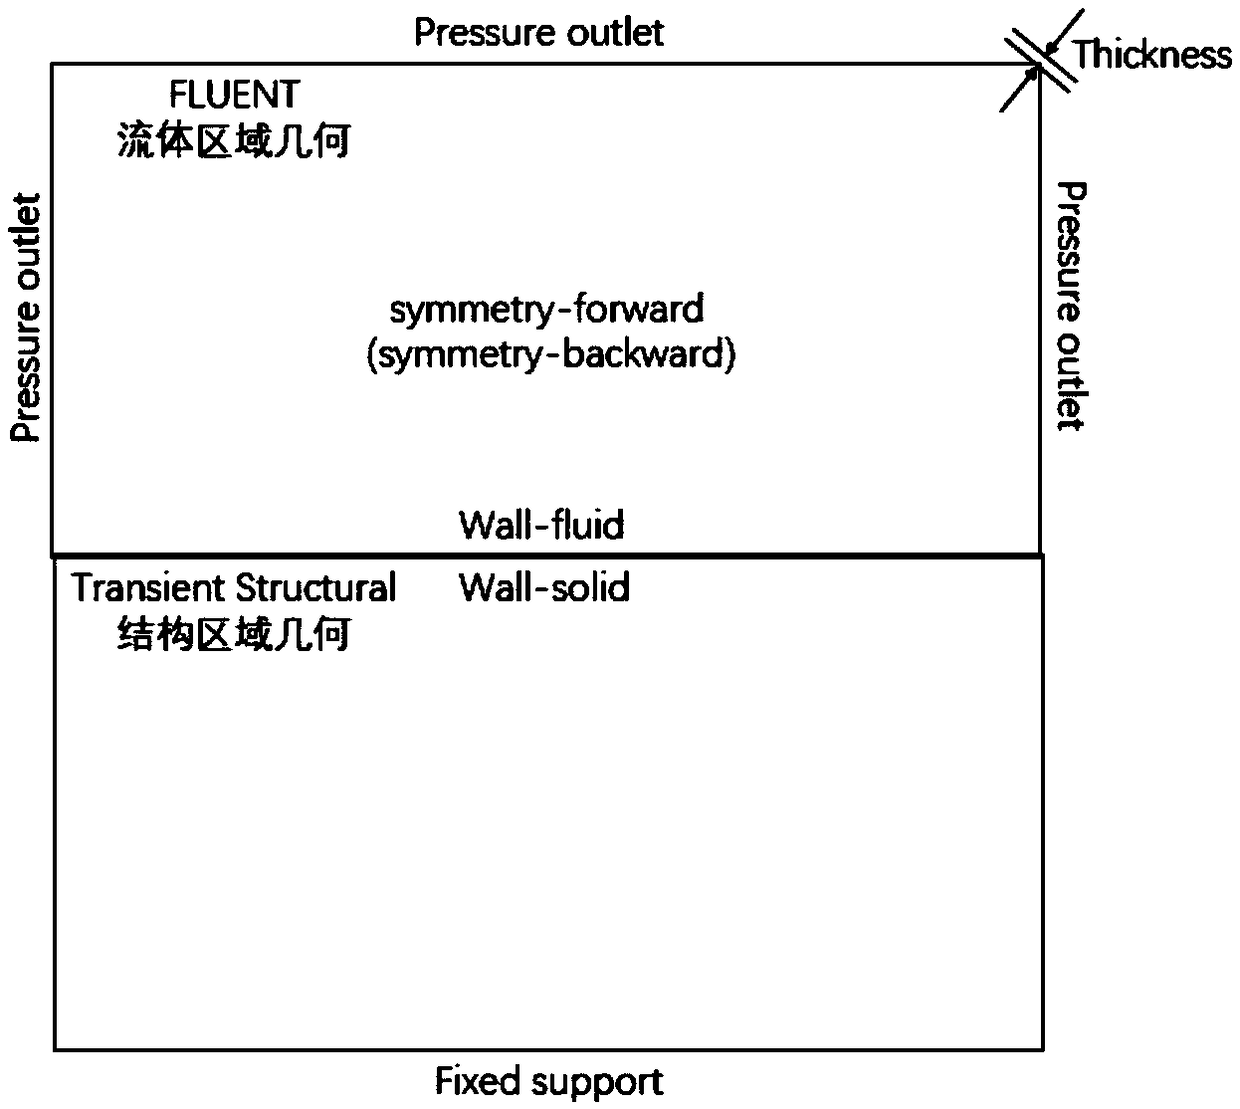
[0054] Such as figure 1 , figure 2 and image 3 As shown, this embodiment discloses a gas-liquid-solid coupling calculation method for laser shock peening. First, design the transient gas-liquid-solid coupling system; secondly, geometric modeling and grid division; then use FLUENT to simulate pre-processing; transient structure solution settings; finally, gas-liquid-solid system coupling settings. The simulation method mainly includes five modules, the specific modules are as follows:
[0055] 1. Transient gas-liquid-solid coupling system
[0056] Such as figure 1 A schematic diagram of the modeling process and data exchange method of the ANSYS transient gas-liquid-solid coupling system is shown. Among them, the modeling process of the transient gas-liquid-solid coupling system is as follows:
[0057] 1) In the Geometry geometric modeling module, a geometric model is established according to the distribution of the fluid and structural regions during the laser shock pee...
Embodiment 2
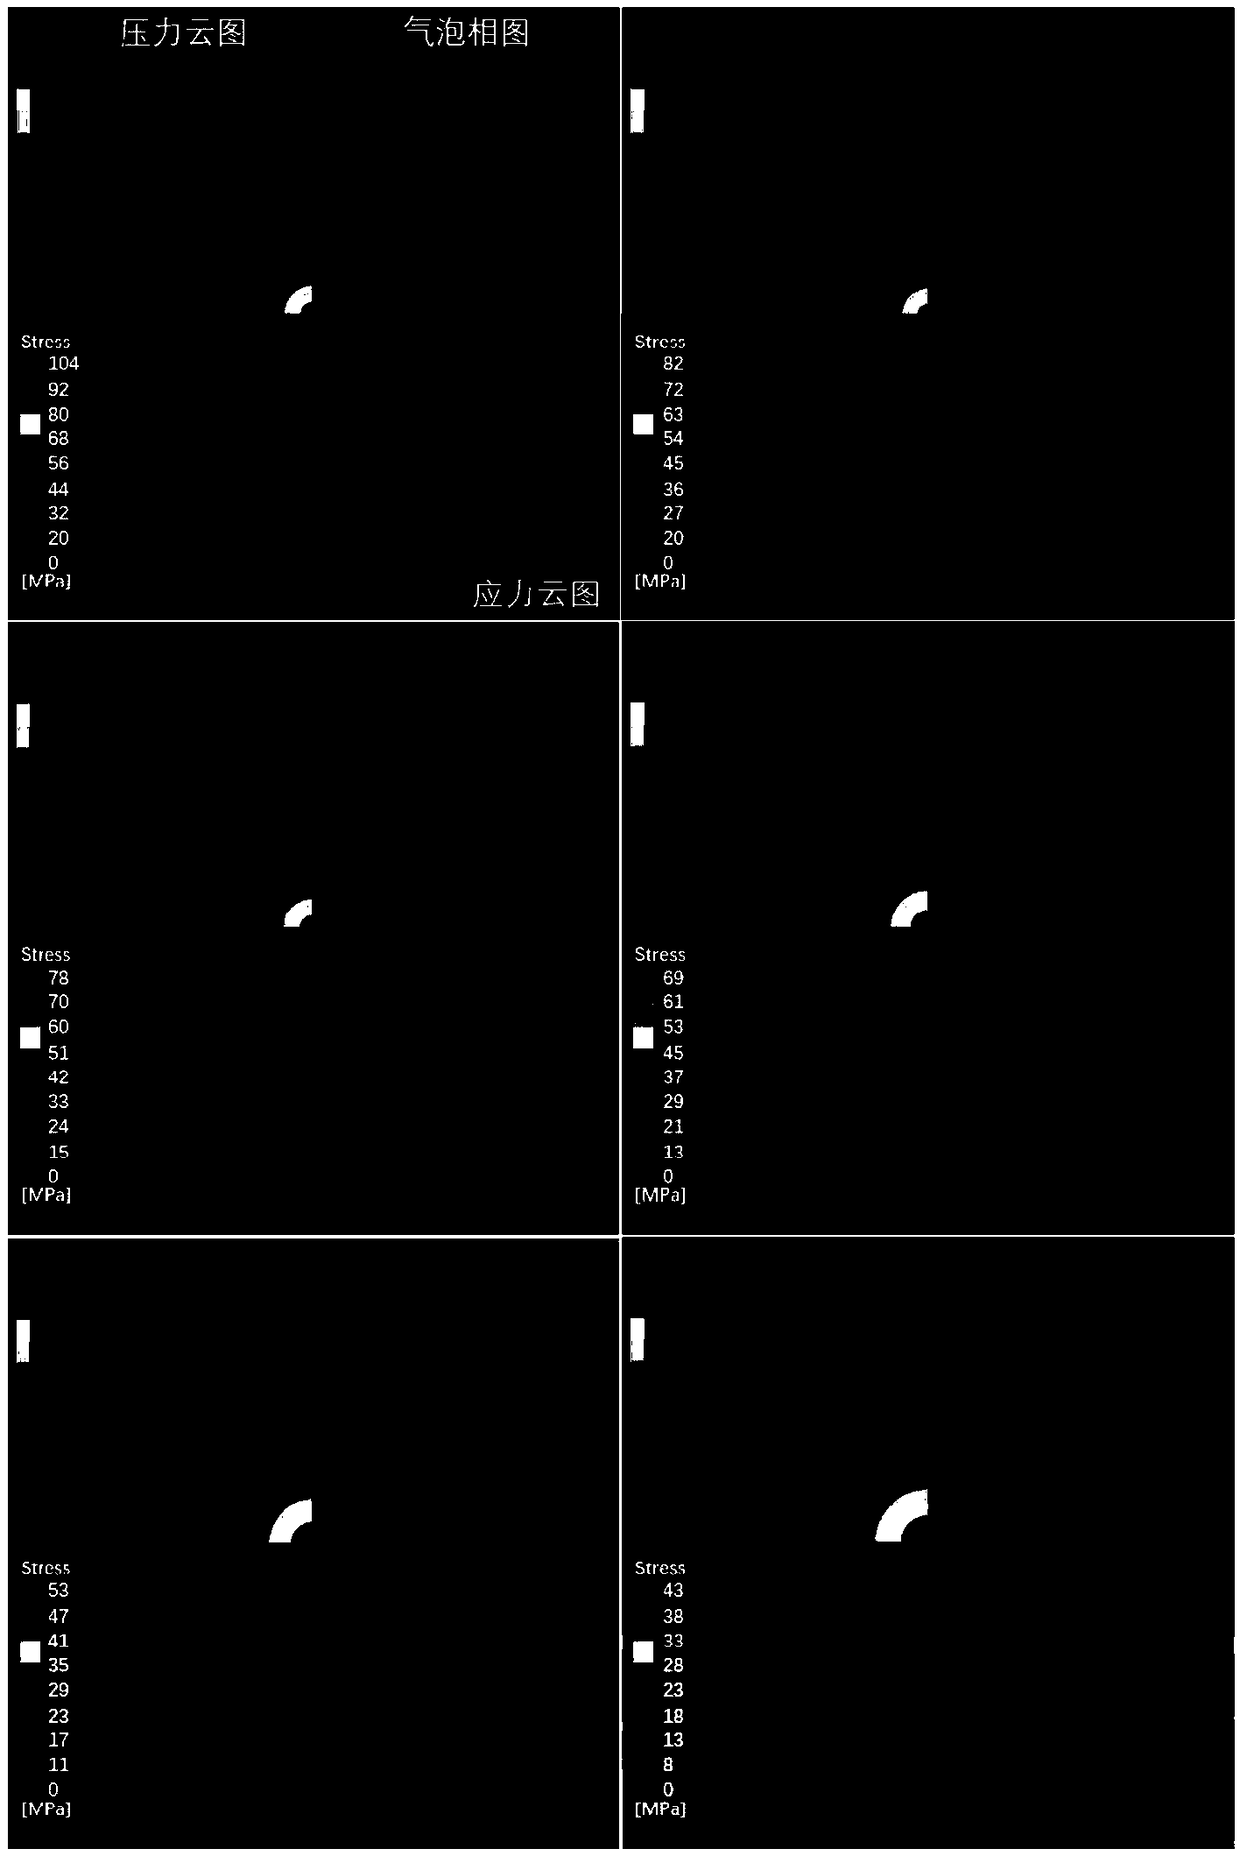
[0096] In this example, in order to explore the impact of high-pressure LIP bubbles on the structure in the presence of a water-constrained layer, a shock wave with a small size is used as the wave source. That is, using an initial diameter of 100 μm and a pressure of 0.1×10 9 A semicircular ideal gas bubble near the wall of Pa is used as the pressure-generating medium, and the simulation is carried out under the condition of a water-constrained layer. In order to display the relationship between the bubble pressure, bubble volume and the stress response of the structure more intuitively, the left half of the fluid region in the result graph at each moment is displayed as a pressure cloud map, and the right half is displayed as a bubble phase diagram (the darkest color in the middle is LIP The bubble phase, the darker color in the periphery is the environment phase), and the structural region is displayed as a stress cloud map. Such as image 3 Shown are the simulation resul...
PUM
 Abstract
Description
Claims
Application Information
 - R&D
- Intellectual Property
- Life Sciences
- Materials
- Tech Scout
- Unparalleled Data Quality
- Higher Quality Content
- 60% Fewer Hallucinations
Browse by: Latest US Patents, China's latest patents, Technical Efficacy Thesaurus, Application Domain, Technology Topic, Popular Technical Reports.
© 2025 PatSnap. All rights reserved.Legal|Privacy policy|Modern Slavery Act Transparency Statement|Sitemap|About US| Contact US: help@patsnap.com


