
Analysis device and analysis method

An analysis device and analysis method technology, applied in the direction of measuring devices, analysis materials, material analysis through optical means, etc., can solve the problems that cannot be fully suppressed, cannot be ideally used, and the demand for quantitative measurement is high.

Pending Publication Date: 2020-04-21
ALFRESA PHARMA CORP
View PDF8 Cites 0 Cited by
  • Summary
  • Abstract
  • Description
  • Claims
  • Application Information

AI Technical Summary

Problems solved by technology

[0004] As a solution to such a prozone, for example, a method of suppressing this phenomenon by adding a surfactant without diluting (Patent Document 1), and measuring serum amyloid A or C-reactive proteins by studying antibodies have been conceived. The method of specifying a target component with a high concentration range, etc. (Patent Documents 2 and 3), sometimes cannot sufficiently suppress this phenomenon, or these methods may not be ideally utilized depending on the target component
[0005] In addition, when dilution is included, the measurement range of the target component is usually about 10 to 50 times the reference level. For high-concentration samples out of such a measurement range, dilution is performed before measurement, or before and after measurement. The same dilution, or multiple repeated dilutions until it can be measured and other tedious operations that have been questioned for accuracy
[0006] However, for example, there is a high demand for quantitative measurement of components with a very wide concentration range such as fecal calprotectin, fecal hemoglobin, and fecal lactoferrin, which have a concentration distribution of about 10,000 times.

Method used


Image

  • Analysis device and analysis method
  • Analysis device and analysis method
  • Analysis device and analysis method

Examples


Embodiment 1-1

[0216] is the result of prozone detection correlation.

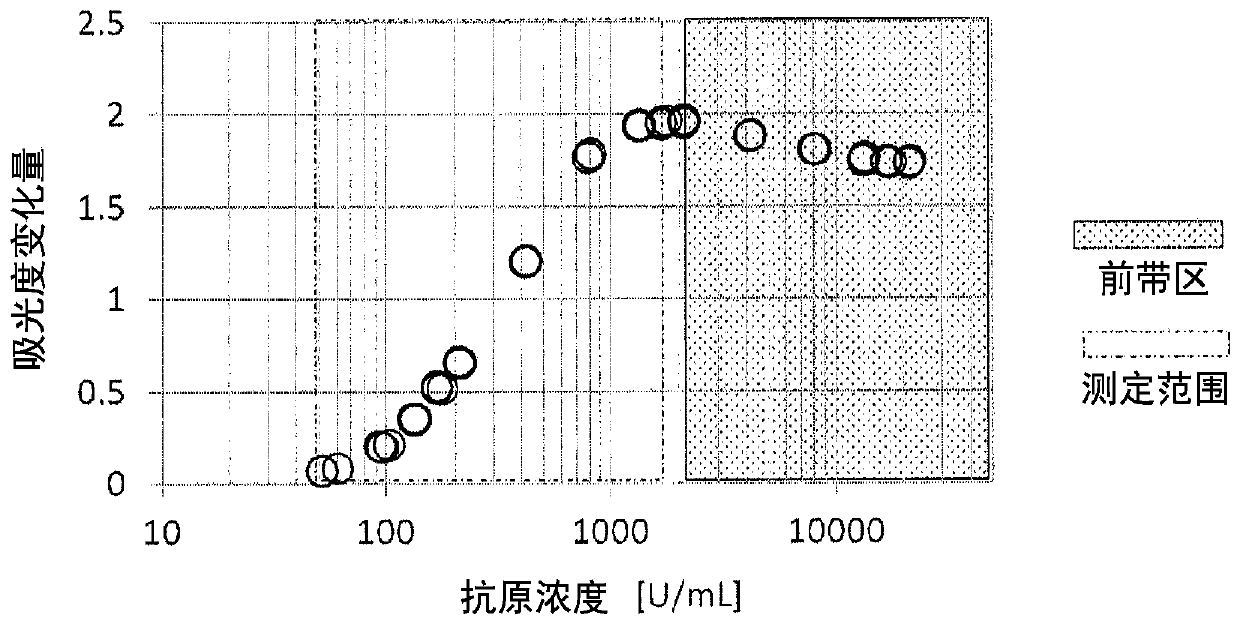
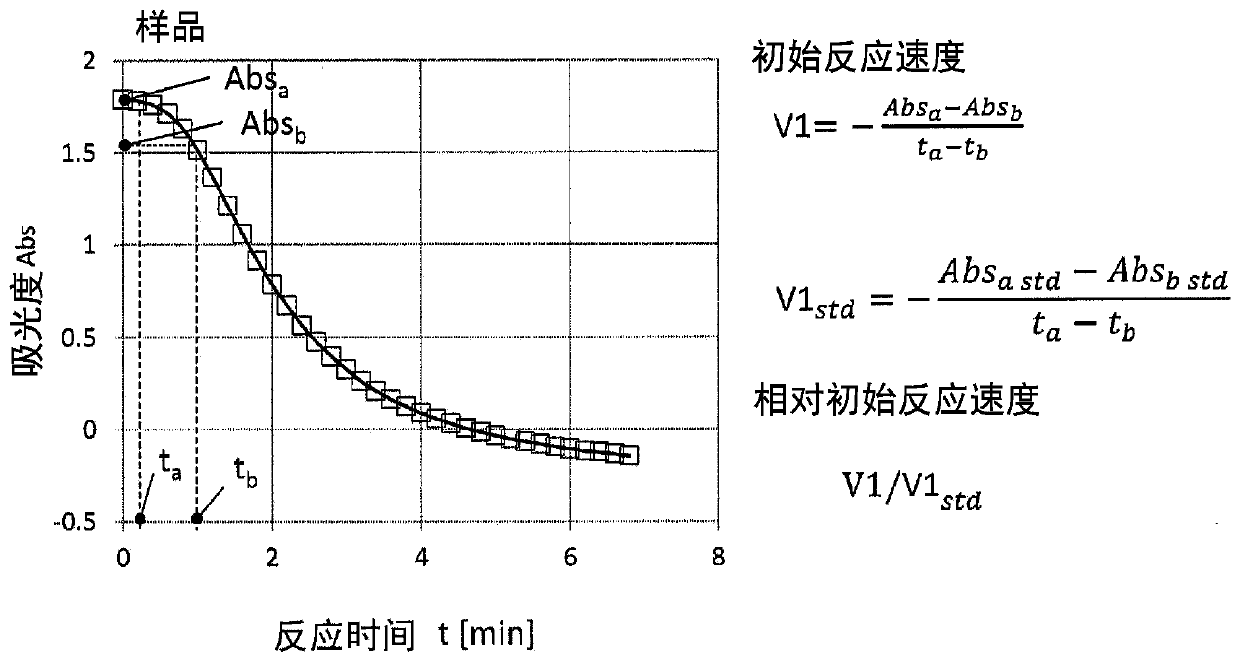
[0217] For the sample diluted to 0.002 to 1 times, four kinds of faecal calprotectin colloidal gold assay reagents LotA, LotB, LotC, and LotD with different R1 component concentrations were used as examples of reagents with different batches, and the changes in absorbance of each were measured amount and initial reaction velocity V1, and calculate the measurable range (measurement range), the detection of the prozone region, and the threshold value of each reagent while maintaining this state. In addition, each measurement time of this sample was 6.8 minutes. Among the four assay reagents, the lowest concentration of the prozone and the prozone can be confirmed is LotD, and the prozone was confirmed from 1300U / mL. On the other hand, among the four measurement reagents, the prozone was confirmed at the highest concentration and was LotA, and the prozone was confirmed from 2180 U / mL (no graph). Use the result obtained by...

Embodiment 1-2

[0220] is the result of prozone detection correlation.

[0221] Such as Image 6 As shown, in addition to the results obtained in Example 1-1, the initial reaction velocity V1 using the calibration sample std , calculate the relative initial reaction velocity V1 / V1 std . Prozone determination and relative initial reaction speed V1 / V1 of each reagent were performed in the same manner as in Example 1-1 st Comparison. In this case, it becomes the relative initial reaction velocity V1 / V1 on the vertical axis std The result of the threshold value of LotA, LotB, LotC, and LotD is obtained between 0.8 and 1.2 of the value. It can be seen that in Example 1-1, the thresholds related to the determination of the prozone are individually set according to the needs of the lot, but in the case of Example 1-2, a common threshold can be used regardless of the lot.

Embodiment 2

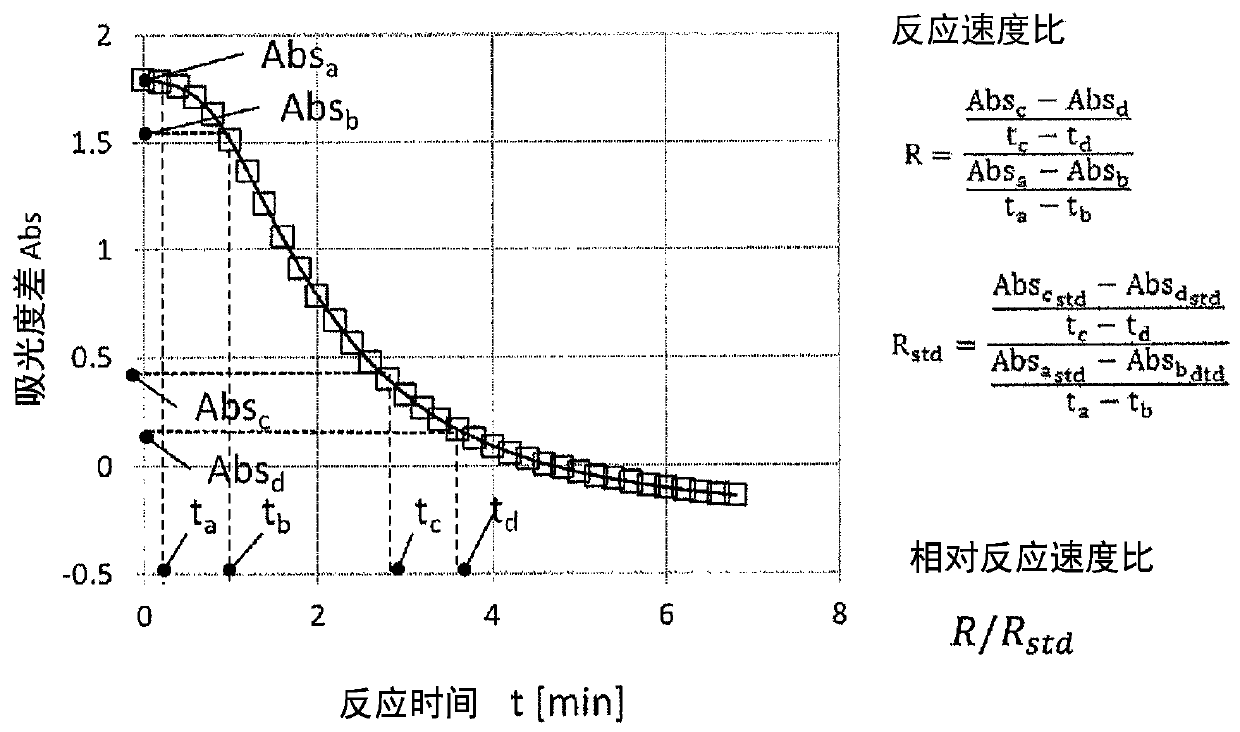
[0223] This is the result of correlation between prozone detection and high concentration determination using the measurement data in Example 1-1. Such as Figure 7 Shown in Table 1, using LotA, LotB, LotC, LotD, calculate the reaction rate ratio R (= A2 / A1). Comparing the high concentration determination and the reaction rate ratio of each reagent, the measurement range that can be measured in this state, the range that can be measured by 10-fold dilution, and the range that can be measured by 100-fold dilution are the results shown in the figure. There are batch-to-batch differences in the reaction rate ratio, but the measurable range at 10-fold dilution overlaps with the measurable range at 100-fold dilution. By setting the threshold (Rd) at 1.0, it is possible to perform appropriate reaction in all batches. Judgment of the dilution ratio (high concentration judgment).

[0224] [Table 1]

[0225]


PUM


Abstract

Provided are an analysis device, analysis method, or the like. When measuring a test liquid comprising an immunological reagent and a sample, measurements are performed even if as is, the sample is highly concentrated and beyond the applicable measurement range, by estimating the concentration of the sample using the absorption measurement results of a reaction process and determining the optimumdilution ratio. An example of the present invention includes an analysis device comprising: a means (A) for detecting prozones during the measurement of the sample; and a means (B) for determining high concentration regions that automatically determines the dilution ratio for the test liquid.

Description

technical field [0001] The present invention relates to an analysis device, an analysis method, a dilution device and a dilution method of a test solution including an immunological reagent using an agglutination method and a component to be analyzed, and an immunological reagent used therein. Background technique [0002] In recent years, automation and shortening of measurement time are being sought in various inspections such as clinical examinations. As a method of this test, a measurement method utilizing an immune reaction for measuring a substance in a biological sample is widely used. As immunoassay methods, there are various methods such as RIA method, EIA method, immunoturbidimetric method, latex agglutination method, colloidal gold agglutination method, and immunochromatography. Among them, immunological agglutination methods such as latex agglutination method and colloidal gold agglutination method do not require separation and washing operations of the reaction...

Claims


Application Information

Patent Timeline
IPC IPC(8): G01N33/543G01N21/3577G01N21/59
CPCG01N21/3577G01N21/59G01N33/543G01N21/272G01N2021/825G01N33/5304G01N21/31G01N2201/127
Inventor 西村和哉土居洋介福本祐子吴诗勤
Owner ALFRESA PHARMA CORP
Learn More