Method and equipment for measuring diffusion spectrum in non-ergodic system with high-speed charge coupled imaging system
A charge-coupled imaging and diffusion spectroscopy technology, which can be used in measurement devices, scattering characteristics measurement, radiation control devices, etc., and can solve problems such as the inapplicability of single-mode fibers
- Summary
- Abstract
- Description
- Claims
- Application Information
AI Technical Summary
Problems solved by technology
Method used
Image
Examples
Embodiment 1
[0021] Example 1: Light source
[0022] Nd: YAG laser (CrystaLaser LC GCL-150-S): Power 150mW, TEM 00 The mode and wavelength are 532nm, the coherence length exceeds 100m, the output power is stable (power fluctuation within 24 hours<=0.25%), and the laser diameter is 6mm after beam expansion. Sample and sample cell
[0023] Glass microspheres / silicone oil system, the glass microspheres are dehydrated (160° C. / 24 hours), and the volume fraction is 2%.
[0024] The sample cell is composed of two sides of conductive glass and two sides of ordinary glass, and the distance between the conductive glasses is 2mm. experiment
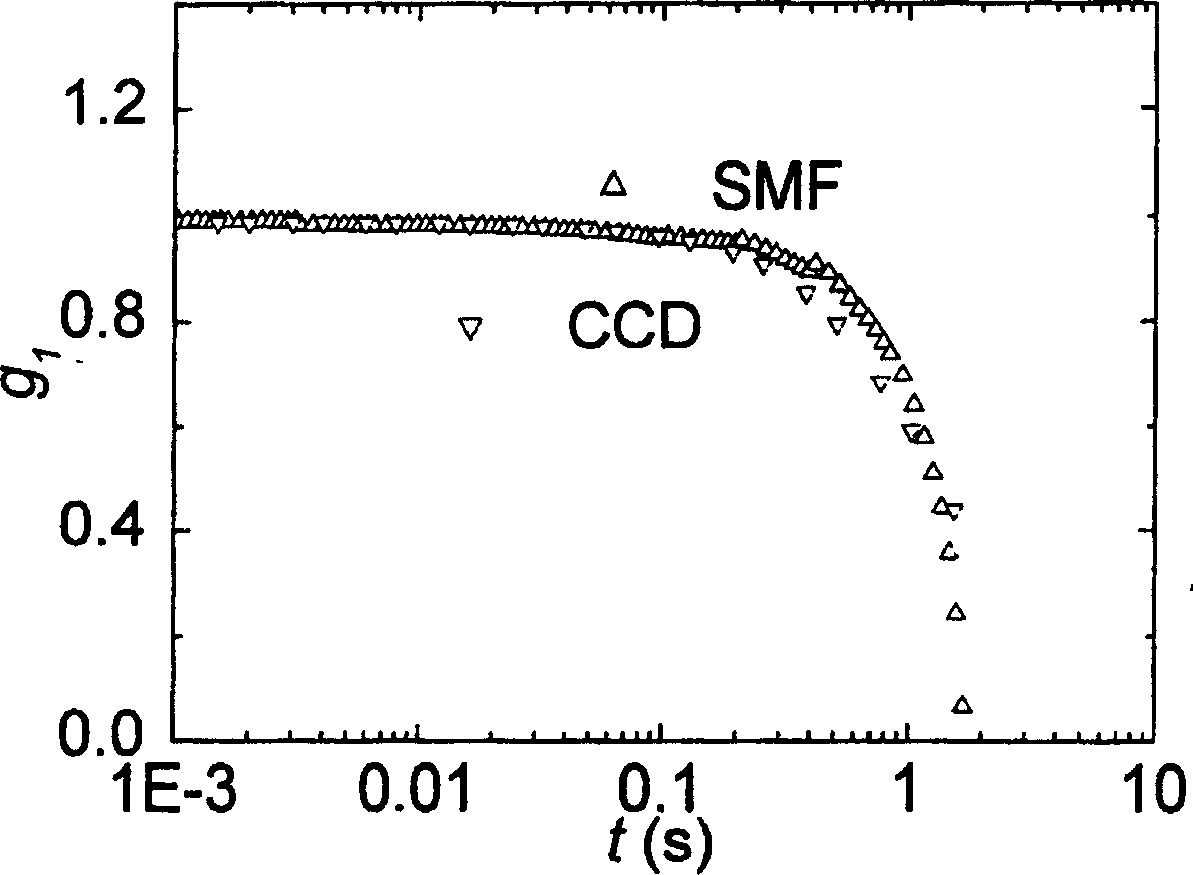
[0025] When no electric field is applied, the particle interaction is weak and the volume fraction is small, which can be regarded as an ergodic system, and the autocorrelation function can be detected by ALV. The autocorrelation function is measured by the single-mode fiber method and the CCD method respectively, and the attenuation time τ is obtained. as...
Embodiment 2
[0026] Embodiment 2: The light source is the same as Embodiment 1. sample
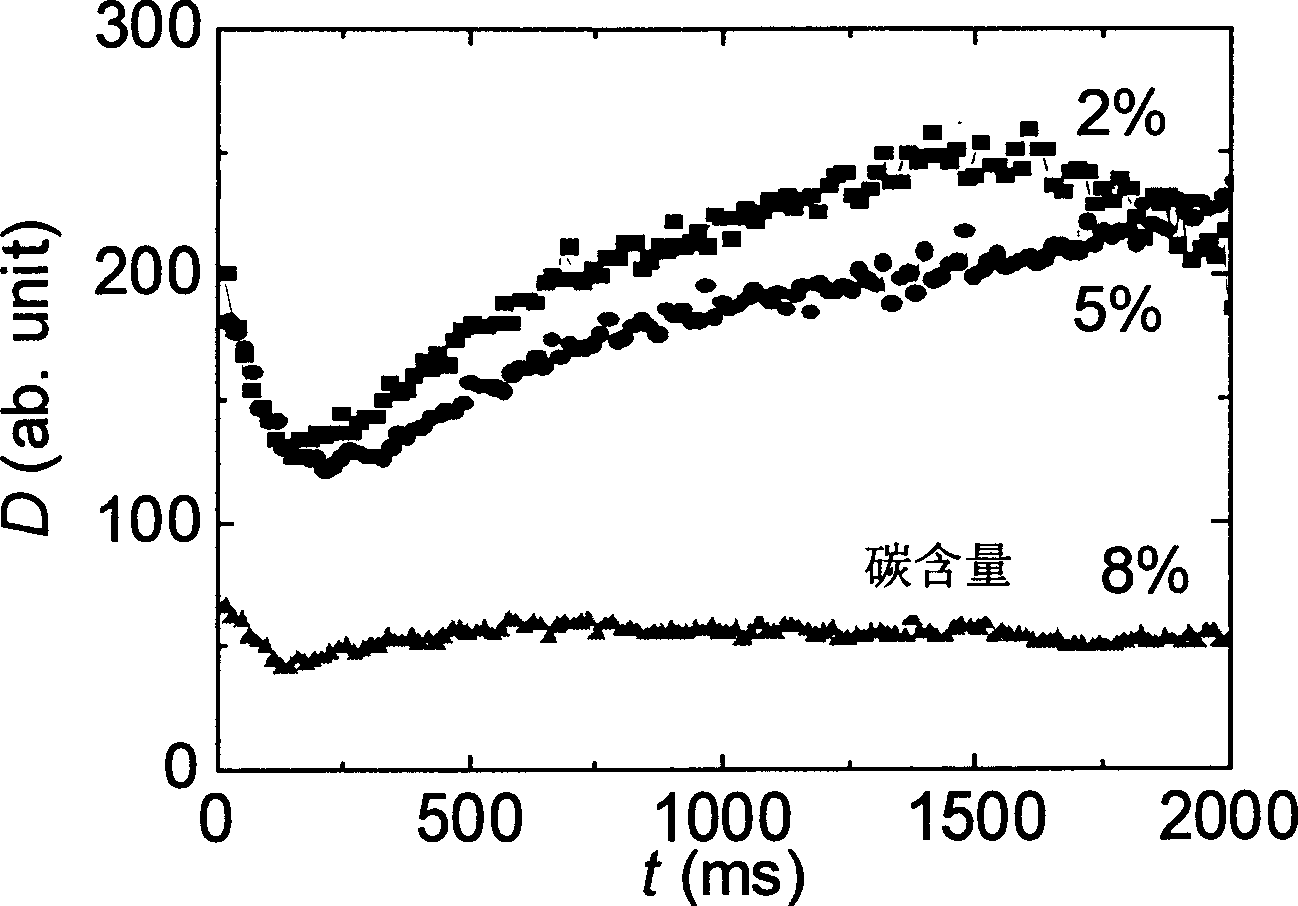
[0027] carbon doped TiO2 / Silicone oil system, TiO 2 With a very high dielectric constant (80-100), organic carbon is doped into TiO at 400°C 2 , can be changed by changing the TiO 2 The content of DDA in the powder changes the TiO 2 conductivity. The volume fraction of the system is 0.33%. Experiment 1. Static measurement
[0028] When the DC electric field is 600V / mm and the AC electric field is 3000V / mm, the different conductivity (TiO 2 Diffusion coefficient D of samples with different carbon content) changes with time, as shown in the attached image 3 and 4 . Figure 5 is the variation of the diffusion coefficient with time under different DC electric fields. image 3 and Figure 5 Each curve contains a peak and a valley, and the peak can be considered to be caused by dipole interaction. As the electric field increases, the peaks gradually disappear and the valleys remain, which is du...
PUM
 Abstract
Description
Claims
Application Information
 - R&D
- Intellectual Property
- Life Sciences
- Materials
- Tech Scout
- Unparalleled Data Quality
- Higher Quality Content
- 60% Fewer Hallucinations
Browse by: Latest US Patents, China's latest patents, Technical Efficacy Thesaurus, Application Domain, Technology Topic, Popular Technical Reports.
© 2025 PatSnap. All rights reserved.Legal|Privacy policy|Modern Slavery Act Transparency Statement|Sitemap|About US| Contact US: help@patsnap.com


