Process control for acetic acid manufacture
A technology of acetic acid and propionic acid, applied in chemical/physical/physicochemical processes, chemical/physical processes, control/regulation processes, etc.
- Summary
- Abstract
- Description
- Claims
- Application Information
AI Technical Summary
Problems solved by technology
Method used
Image
Examples
Embodiment 1
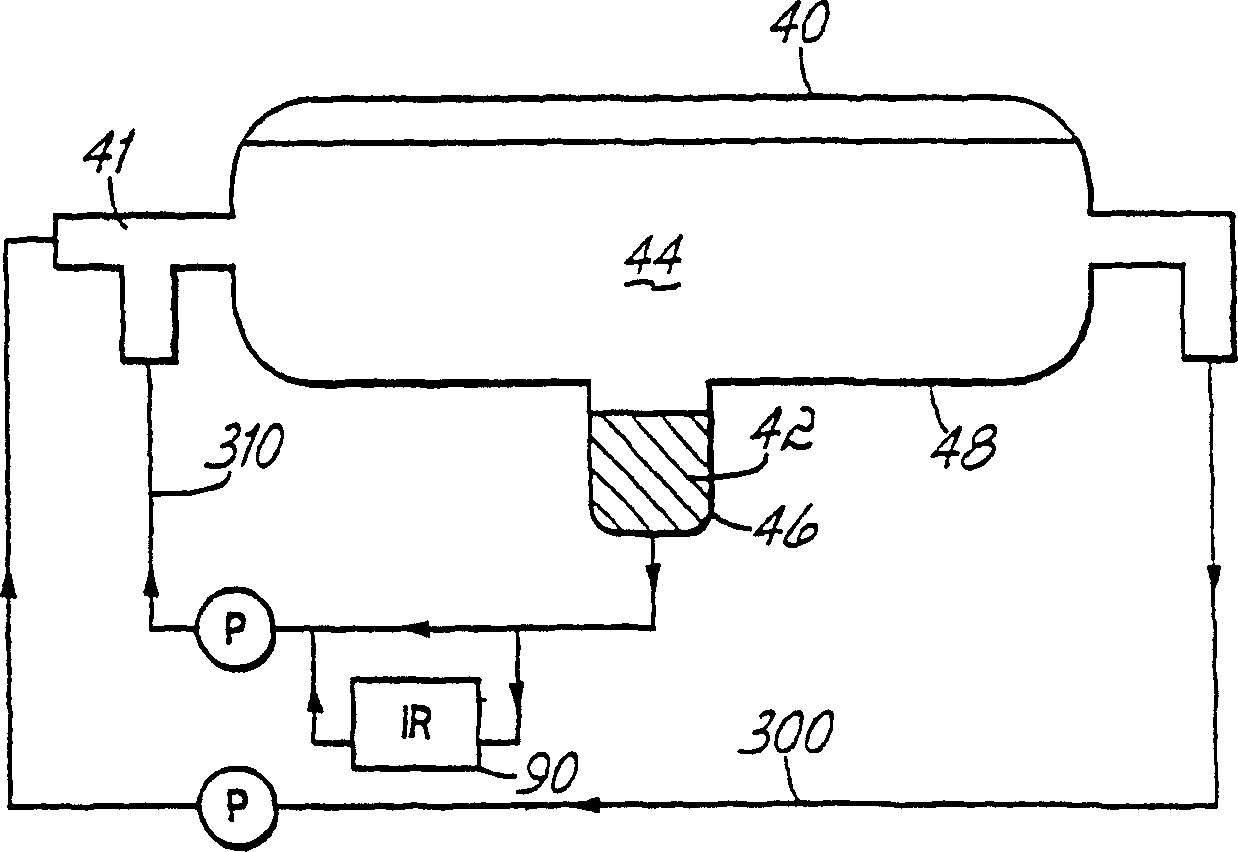
[0108] In this example, the decanter heavy liquid phase solution return line 310 is connected to a 0.5 mm transmission cell equipped with selenite apertures, ie the heavy liquid phase 42 is continuously monitored by extended mid-infrared region analysis. The transmission cell is placed in the cell chamber of an FTIR (Fourier Transform Infrared Spectroscopy) spectrometer equipped with a DTGS detector. The decanter solution having the composition shown in the first data column of Table 7 was circulated for about 18 minutes while Figure 6 The online data points shown are recorded approximately every 35 seconds. The trend line over the 18 minute period shows that the measurement accuracy is better than + / - 0.06 molar for all components. At this point MeOAc was added to the decanter. Figure 6 The trend line for shows the effect of addition of MeOAc on the composition of the heavy liquid phase as determined by IR. Sure enough, MeOAc showed a considerable increase in concentrati...
Embodiment 2
[0112] Similar to the conditions used in Example 1. The decanter heavy liquid phase solution, having the composition shown in the first data row of Table 8, was monitored for a period of 1 hour during which aliquots of the hydrocarbon solution were added at approximately 12 minute intervals. Figure 7 The trend line above shows the expected increase in hydrocarbon concentration, from about 0.25 molar to about 0.70 molar, accompanied by a decrease in the concentration of other components of the heavy liquid phase, as dilution occurs. Solution density also decreases as very light hydrocarbons (approximately 0.7 g / ml) replace heavy MeI (approximately 2.3 g / ml). The solution was manually sampled before each hydrocarbon addition and the samples were analyzed by independent analytical methods, specifically GC for concentration and density by weighing. The data in Table 8 show very close agreement between the on-line and off-line techniques and also illustrate that on-line IR is abl...
Embodiment 3
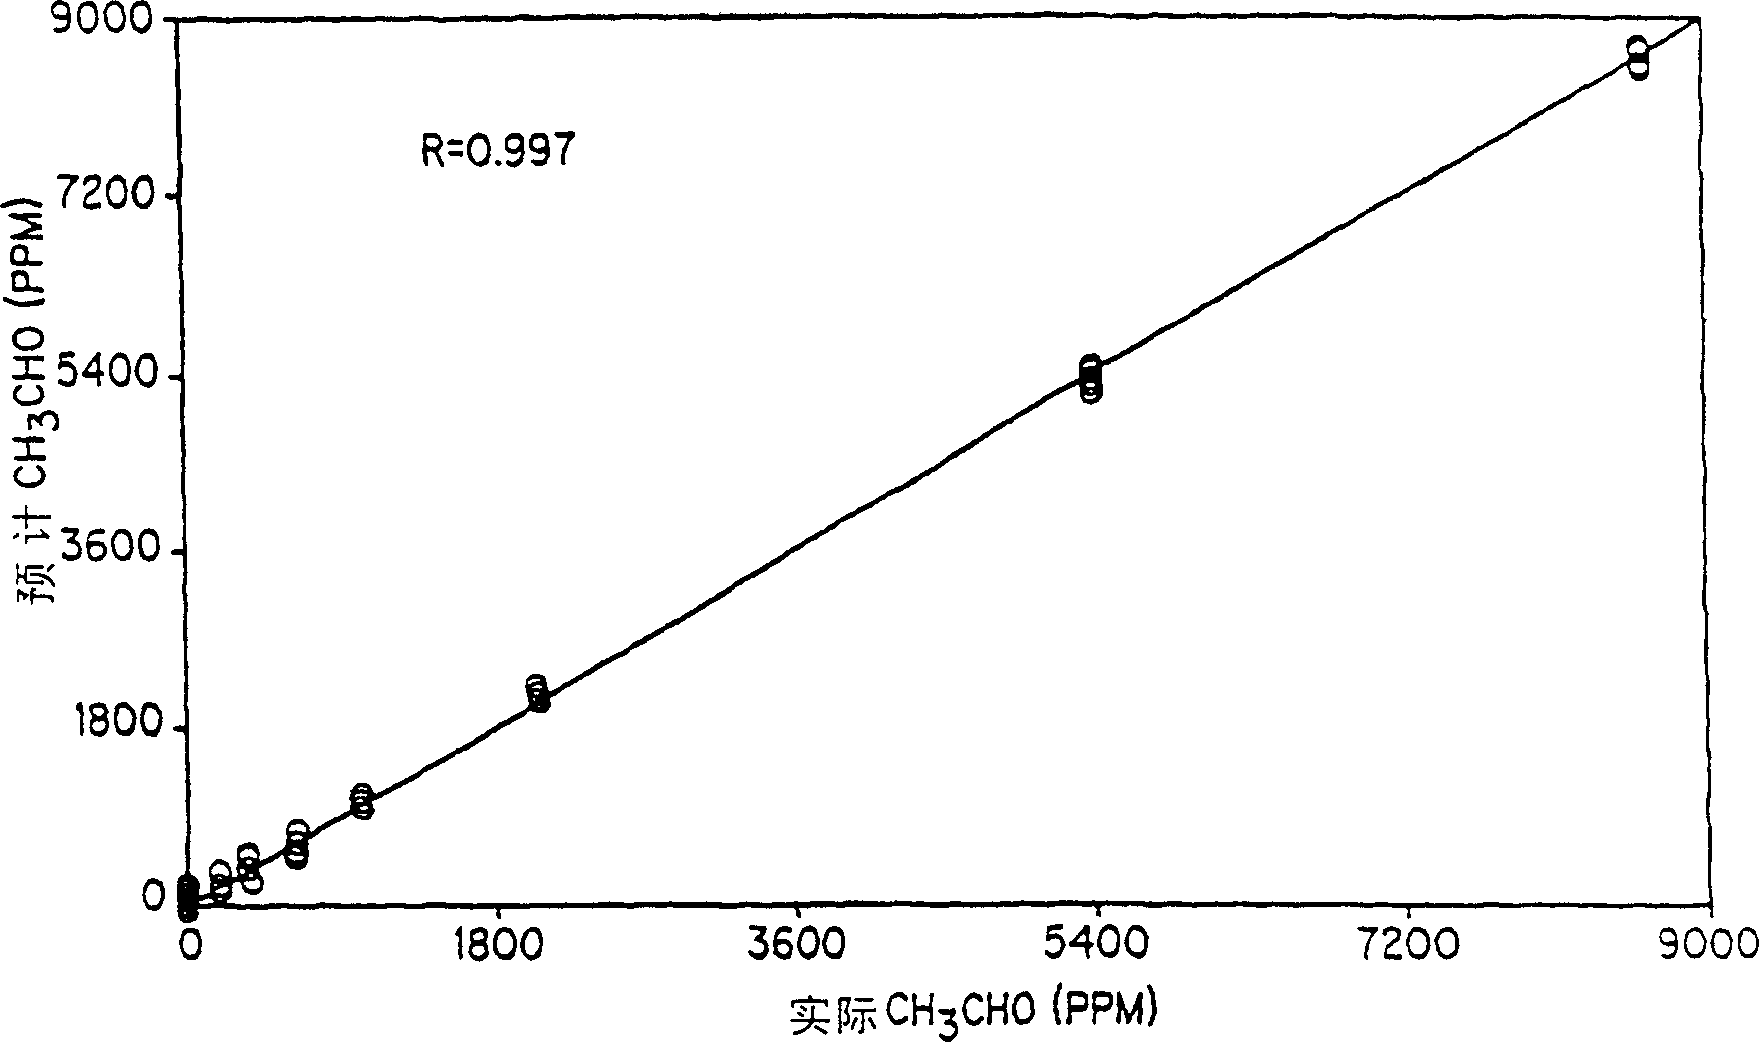
[0115] Unless otherwise specified, the conditions used in Example 1 were similar. This example demonstrates on-line monitoring of acetaldehyde concentration as it increases in the decanter heavy liquid phase. The heavy liquid phase solution was monitored for 2 hours, during which time a data point was obtained every 2 minutes. During this 2 hour period, 9 aliquots of acetaldehyde were added. Figure 8 The trend line for acetaldehyde shows an increase from an initial value of zero to about 12,000 ppm. The solution was manually sampled before each addition of acetaldehyde and samples were analyzed by GC. Due to the residual noise in the infrared data, the infrared data of each row in Table 9 was obtained by averaging the 5 infrared data points. The comparison of the infrared data with the GC value shows that the average value of the data points can reach about + / -150ppm Accuracy. This example thus demonstrates that acetaldehyde can be effectively monitored at levels typicall...
PUM
 Abstract
Description
Claims
Application Information
 - R&D
- Intellectual Property
- Life Sciences
- Materials
- Tech Scout
- Unparalleled Data Quality
- Higher Quality Content
- 60% Fewer Hallucinations
Browse by: Latest US Patents, China's latest patents, Technical Efficacy Thesaurus, Application Domain, Technology Topic, Popular Technical Reports.
© 2025 PatSnap. All rights reserved.Legal|Privacy policy|Modern Slavery Act Transparency Statement|Sitemap|About US| Contact US: help@patsnap.com


