
Method for gene mapping from chromosome and phenotype data

a technology of applied in the field of gene mapping from chromosome and phenotype data, can solve the problems of reducing the computational complexity of the task, reducing the area to be analyzed with expensive laboratory methods, and reducing the area to be analyzed

Inactive Publication Date: 2005-03-24
LICENTIA OY
View PDF0 Cites 4 Cited by
  • Summary
  • Abstract
  • Description
  • Claims
  • Application Information

AI Technical Summary

Problems solved by technology

The growing number of available genetic markers, anticipated to reach hundreds of thousands in the next few years, offers new opportunities but also amplifies the computational complexity of the task.
However, we lack methods for deriving the function of a gene from the sequence information.
It aims at discovering areas in the genome—hopefully small—that have a statistical connection to a given trait, thus narrowing down the area to be analyzed with expensive laboratory methods.
There are severe statistical problems, however, in observing LD.
Further on, since the selection of patients is more or less random, and the whole coalescence process leading to LD is stochastic, it is a challenge to recognize LD and the DS gene location from all the noise.
The problem is far from trivial, however.
However, since different mutation carriers share different segments, there is no single marker or pattern that is representative of the shared segments.
On the other hand, the models are based on a number of assumptions about the inheritance model of the disease and the structure of the population, which may be misleading for the statistical inference.
Their work is a generalization of the LOD score to multiple loci, and it does not handle haplotype patterns.
The downside is that estimates are rough (due to the smaller effective number of meiosis sampled), and that collecting information from larger families is more difficult and expensive.
However, if more complex data is to be analyzed, these single permutation tests are too expensive and computationally very ineffective and even inoperative.

Method used


Image

  • Method for gene mapping from chromosome and phenotype data
  • Method for gene mapping from chromosome and phenotype data
  • Method for gene mapping from chromosome and phenotype data

Examples


example 1

Simulation of Data

We designed several different test settings, with variation in the fraction (A) of mutation carriers in the disease-associated chromosomes, in the number of founders who introduced the mutation to the population, and in the amount of missing information. For statistical analyses, we created 100 independent artificial data sets in each test setting. Great care was taken to generate realistic data by a simulation procedure that included four steps: pedigree generation, simulation of inheritance, diagnosing, and sampling.

The population pedigree was set to grow from 100 to 100,000 individuals in a period of 20 generations. In each generation, the selection of parents for each child was random, but once a couple was formed, all subsequent children allocated to either of the parents were set to be common children of the couple.

The inheritance of chromosomes within the population pedigree was simulated by first allocating a continuous chromosomal segment of 100 cent...

example 2

Analysis of TreeDT

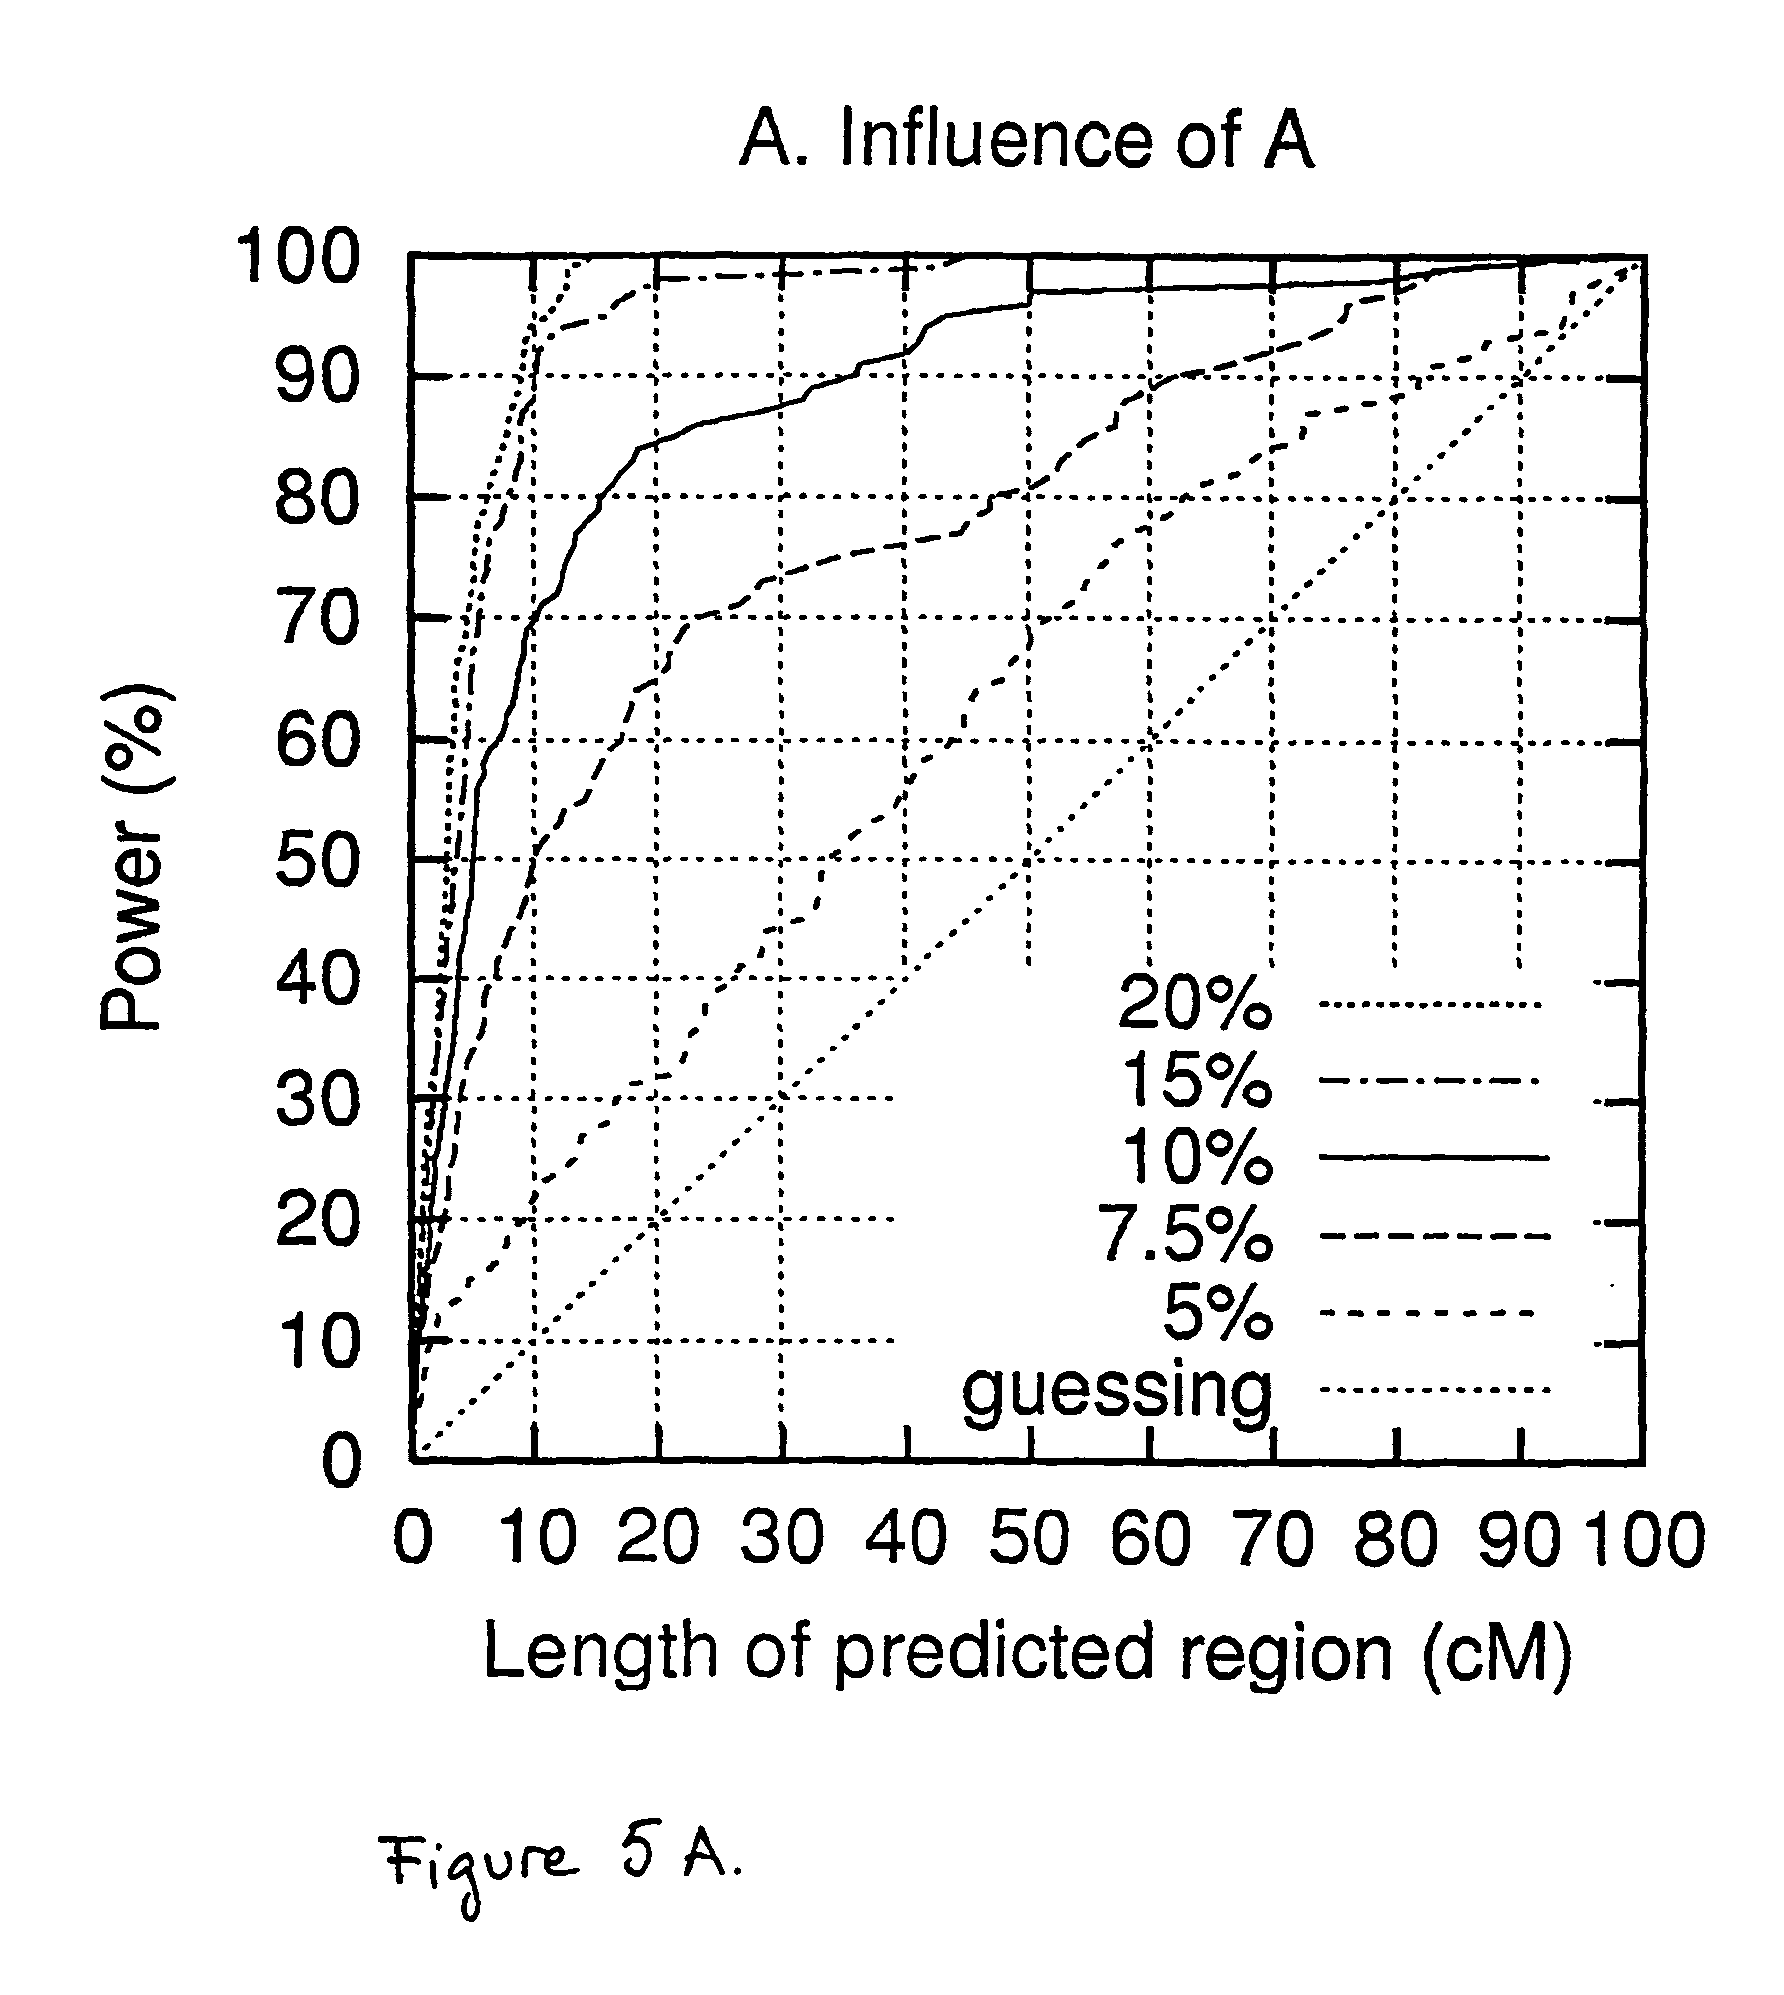
First we assess the prediction accuracy of TreeDT with different values of A, the proportion of disease-associated chromosomes that actually carry the mutation (FIG. 5A). The results are reported as curves that show the percentage of 100 data sets where the gene is within the predicted region, as a function of the length of the predicted region. Or, in other words, the x coordinate tells the cost a geneticist is willing to pay, in terms of the length of the region to be further analyzed, and the y coordinate gives the probability that the gene is within the region. For A=20% or 15% the accuracy is very good, and with lower values of A the accuracy decreases until with A=5% only in 20-30% of data sets can the gene be localized within a reasonable accuracy of 10-20 cM. We remind the reader that the test settings have been designed to be challenging, and to test the limits of the approach.

Next we evaluate the effect of the only parameter of TreeDT, the number of d...

example 3

Comparison to Other Methods

TreeDT, HPM, and m-TDT have practically identical performance in localizing the DS gene in the baseline setting (FIG. 6A). TDT is clearly inferior compared to the other methods. Tests with other values of A give similar results.

In a test setting with three founders who introduced the mutation to the population, differences between the three best methods start to appear (FIG. 6B). TreeDT has an edge over HPM, which in turn has an edge over m-TDT. TDT barely beats random guessing.

Finally, we compare the methods with a large amount of missing data (FIG. 6C). Expectedly, HPM is most robust with respect to missing data since it allows gaps in its haplotype patterns. Surprisingly, TreeDT is not much weaker than HPM, although no actions have been taken in it to account for missing or erroneus data. Performance of m-TDT degrades much more clearly.

Method to method comparisons (not shown) indicate that the prediction errors are mostly caused by random effect...


PUM

PropertyMeasurementUnit
Magnetic fieldaaaaaaaaaa
Linkage disequilibriumaaaaaaaaaa

Abstract

The present invention relates to a method for gene mapping from chromosome and phenotype data, which utilizes linkage disequilibrium between genetic markers mi, which are polymorphic nucleic acid or protein sequences or strings of single-nucleotide polymorphisms deriving from a chromosomal region. The method according to the invention is based on discovering and assessing tree-like patterns in genetic marker data. It extracts, essentially in the form of substrings and prefix trees, information about the historical recombinations in the population. This infor-mation is used to locate fragments potentially inherited from a common diseased founder, and to map the disease gene into the most likely such fragment. The method measures for each chromosomal location the disequilibrium of the prefix tree of marker strings starting from the location, to assess the distribution of disease-associated chromosomes.

Description

FIELD OF THE INVENTION The present invention relates to a method for gene mapping from chromosome and phenotype data, which utilizes linkage disequilibrium between genetic markers mi, which are polymorphic nucleic acid or protein sequences or strings of single-nucleotide polymorphisms deriving from a chromosomal region. BACKGROUND OF THE INVENTION Gene mapping aims at discovering a statistical connection from a particular disease or trait to a narrow region in the genome probably containing a gene that affects the trait. In particular, the discovery of new disease susceptibility genes can have an immense importance for human health care. The gene and the proteins it produces can be analyzed to understand the disease causing mechanisms and to design new medicines. Further, gene tests on patients can be used to assess individual risks and for preventive and individually tailored medications. Obviously, gene mapping is receiving increasing interest among medical industry. Genetic ma...

Claims


Application Information

Patent Timeline
IPC IPC(8): G16B20/40C12Q1/68G01N33/48G01N33/50G06FG06F17/00G16B20/20
CPCG06F19/18G16B20/00G16B20/20G16B20/40
Inventor SEVON, PETTERITOIVONEN, HANNU T., T.OLLIKAINEN, VESA
Owner LICENTIA OY
Learn More