Methods for prognosis and treatment of solid tumors
- Summary
- Abstract
- Description
- Claims
- Application Information
AI Technical Summary
Problems solved by technology
Method used
Image
Examples
example 1
Isolation of RNA and Preparation of Labeled Microarray Targets
[0213] Prior to initiation of therapy, whole blood samples (8 mL) were collected into Vacutainer sodium citrate cell purification tubes (CPTs) and PBMCs were isolated according to the manufacturer's protocol (Becton Dickinson). All blood samples were shipped in CPTs overnight prior to PBMC processing. PBMCs were purified over Ficoll gradients, washed two times with PBS and counted. Total RNA was isolated from PBMC pellets using the RNeasy mini kit (Qiagen, Valencia, Calif.). Labeled target for oligonucleotide arrays was prepared using a modification of the procedure described in Lockhart, et al., NATURE BIOTECHNOLOGY, 14: 1675-80 (1996). 2 μg total RNA was converted to cDNA by priming with an oligo-dT primer containing a T7 DNA polymerase promoter at the 5′ end. The cDNA was used as the template for in vitro transcription using a T7 DNA polymerase kit (Ambion, Woodlands, Tex.) and biotinylated CTP and UTP (Enzo). Labeled...
example 2
Hybridization to Affymetrix Microarrays and Detection of Fluorescence
[0214] Individual RCC samples were hybridized to HgU95A genechip (Affymetrix). No samples were pooled. As described above, 45 RCC patients were involved in the study. Tumors of the RCC patients were histopathologically classified as specific renal cell carcinoma subtypes using the Heidelberg classification of renal cell tumors described in Kovacs, et al., J. PATHOL., 183: 131-133 (1997).
[0215] 10 μg of labeled target was diluted in 1×MES buffer with 100 μg / ml herring sperm DNA and 50 μg / ml acetylated BSA. To normalize arrays to each other and to estimate the sensitivity of the oligonucleotide arrays, in vitro synthesized transcripts of 11 bacterial genes were included in each hybridization reaction as described in Hill, et al., SCIENCE, 290: 809-812 (2000). The abundance of these transcripts ranged from 1:300,000 (3 ppm) to 1:1000 (1000 ppm) stated in terms of the number of control transcripts per total transcrip...
example 3
Gene Expression Data Analysis
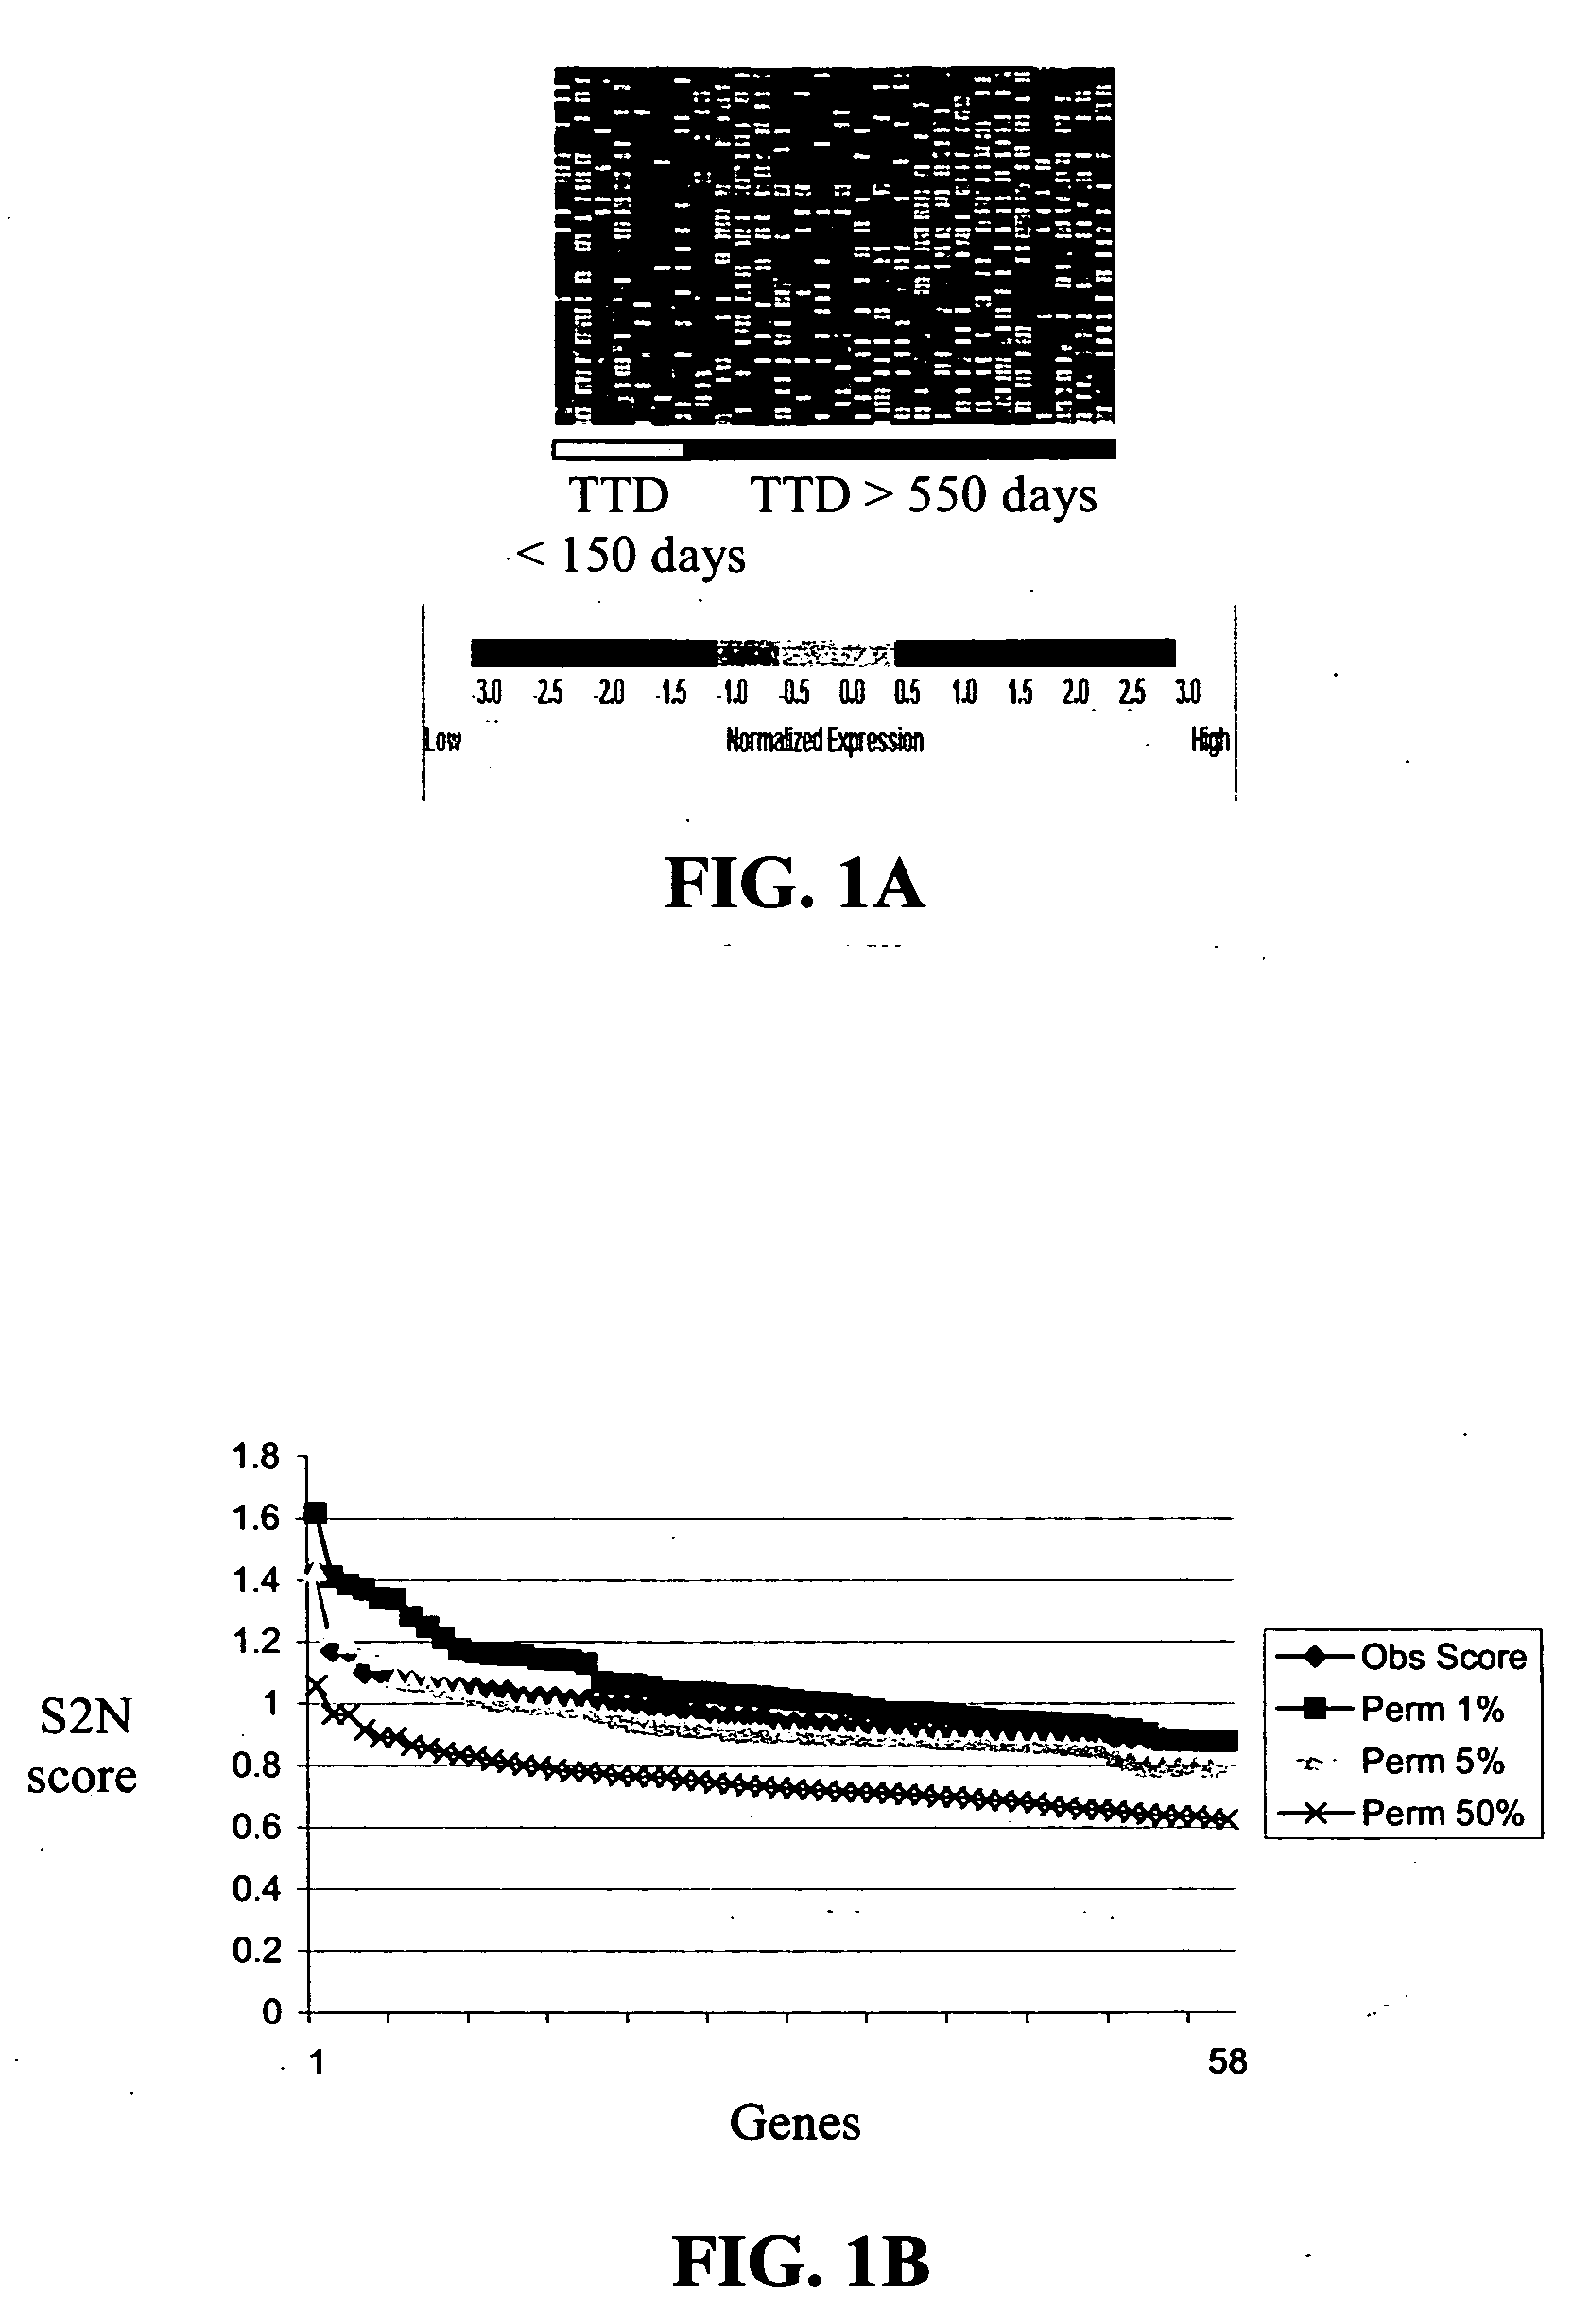
[0217] Data analysis and absent / present call determination were performed on raw fluorescent intensity values using GENECHIP 3.2 software (Affymetrix). GENECHIP 3.2 software uses algorithms to calculate the likelihood as to whether a gene is “absent” or “present” as well as a specific hybridization intensity value or “average difference” for each transcript represented on the array. For instance, “present” calls are calculated by estimating whether a transcript is detected in a sample based on the strength of the gene's signal compared to background. The algorithms used in these calculations are described in the Affymetrix GeneChip Analysis Suite User Guide (Affymetrix). The “average difference” for each transcript was normalized to “frequency” values according to the procedures of Hill, et al., SCIENCE, 290: 809-812 (2000). This was accomplished by referring the average difference values on each chip to a global calibration curve constructed from the a...
PUM
| Property | Measurement | Unit |
|---|---|---|
| time | aaaaa | aaaaa |
| time to disease progression | aaaaa | aaaaa |
| time to death | aaaaa | aaaaa |
Abstract
Description
Claims
Application Information
 - R&D
- Intellectual Property
- Life Sciences
- Materials
- Tech Scout
- Unparalleled Data Quality
- Higher Quality Content
- 60% Fewer Hallucinations
Browse by: Latest US Patents, China's latest patents, Technical Efficacy Thesaurus, Application Domain, Technology Topic, Popular Technical Reports.
© 2025 PatSnap. All rights reserved.Legal|Privacy policy|Modern Slavery Act Transparency Statement|Sitemap|About US| Contact US: help@patsnap.com


