[0047] One of the reasons that the identification of pathophysiologic divergence is important is that such identification provides earlier warning of
disease. In addition, if the patient progresses to develop significantly low levels of a given parameter, such as
oxygen saturation or pulse, it is useful to be able to go back and identify whether or not the patient experienced divergence of these parameters earlier since this can help identify whether it is a primary cardiac or pulmonary process which is evolving and indeed the
time course of the
physiologic process is provided by both diagnostic and therapeutic. Consider, for example, a patient experiencing significant drop in
oxygen saturation and cardiac arrest. One purpose of the present invention is to provide an output indicative of whether or not this patient experienced a
cardiac arrhythmia which precipitated the arrest or whether some antecedent pulmonary process occurred which caused the drop in
oxygen saturation which then ultimately resulted in the
cardiac arrhythmia and arrest. If the patient is being monitored by chest wall impedance, oximetry and EKG, all three parameters can be monitored for evidence of pathophysiologic divergence. If, according to the present invention, the processor identifies divergence of the
oxygen saturation in association with significant rise in minute ventilation, then consideration for bedside examination, chest x-
ray,
arterial blood gas measurement can all be carried out so that the relationship between cardiac and pulmonary compensation in this patient can be identified early rather than waiting until a threshold breach occurs in one
single parameter. Since, with the use of conventional monitors, threshold breach of an alarm can be severely delayed prevented by an active compensatory mechanism, such as hyperventilation, one
advantage of the present invention is that the processor can provide warning as much as 4 to 8 hours earlier by identifying pathophysiologic divergence rather than waiting for the development of a threshold breach.
[0048] Another example of the value of monitor based automatic divergence recognition, according to the present invention is provided by a patient who has experienced a very mild breach of the alarm threshold in association with significant physiologic divergence such as a patient whose baseline
oxygen saturation is 95% in association with a given baseline amplitude and frequency of minute ventilation as identified by the impedance monitor. For this patient, the fall in
oxygen saturation over a period of two hours from 95% to 89% might be perceived by the nurse or house officer as representing only a mild change which warrants the addition of simple oxygen treatment by nasal cannula but no further investigation. However, if this same change is associated with marked physiologic divergence wherein the patient has experienced significant increase in the amplitude and frequency of the chest impedance, the
microprocessor identification of significant pathophysiologic divergence can give the nurse or house officer cause to consider further performance of a blood gas, chest x-
ray or further investigation of this otherwise modest fall in the oxygen saturation parameter.
[0049] It is noted that excessive
sedation is unlikely to produce physiologic divergence since
sedation generally results in a fall in minute ventilation, which will be associated with a fall in oxygen saturation if the patient is not receiving nasal oxygen. The lack of pathophysiologic divergence in association with a significant fall in oxygen saturation can provide diagnostic clues to the house officer.
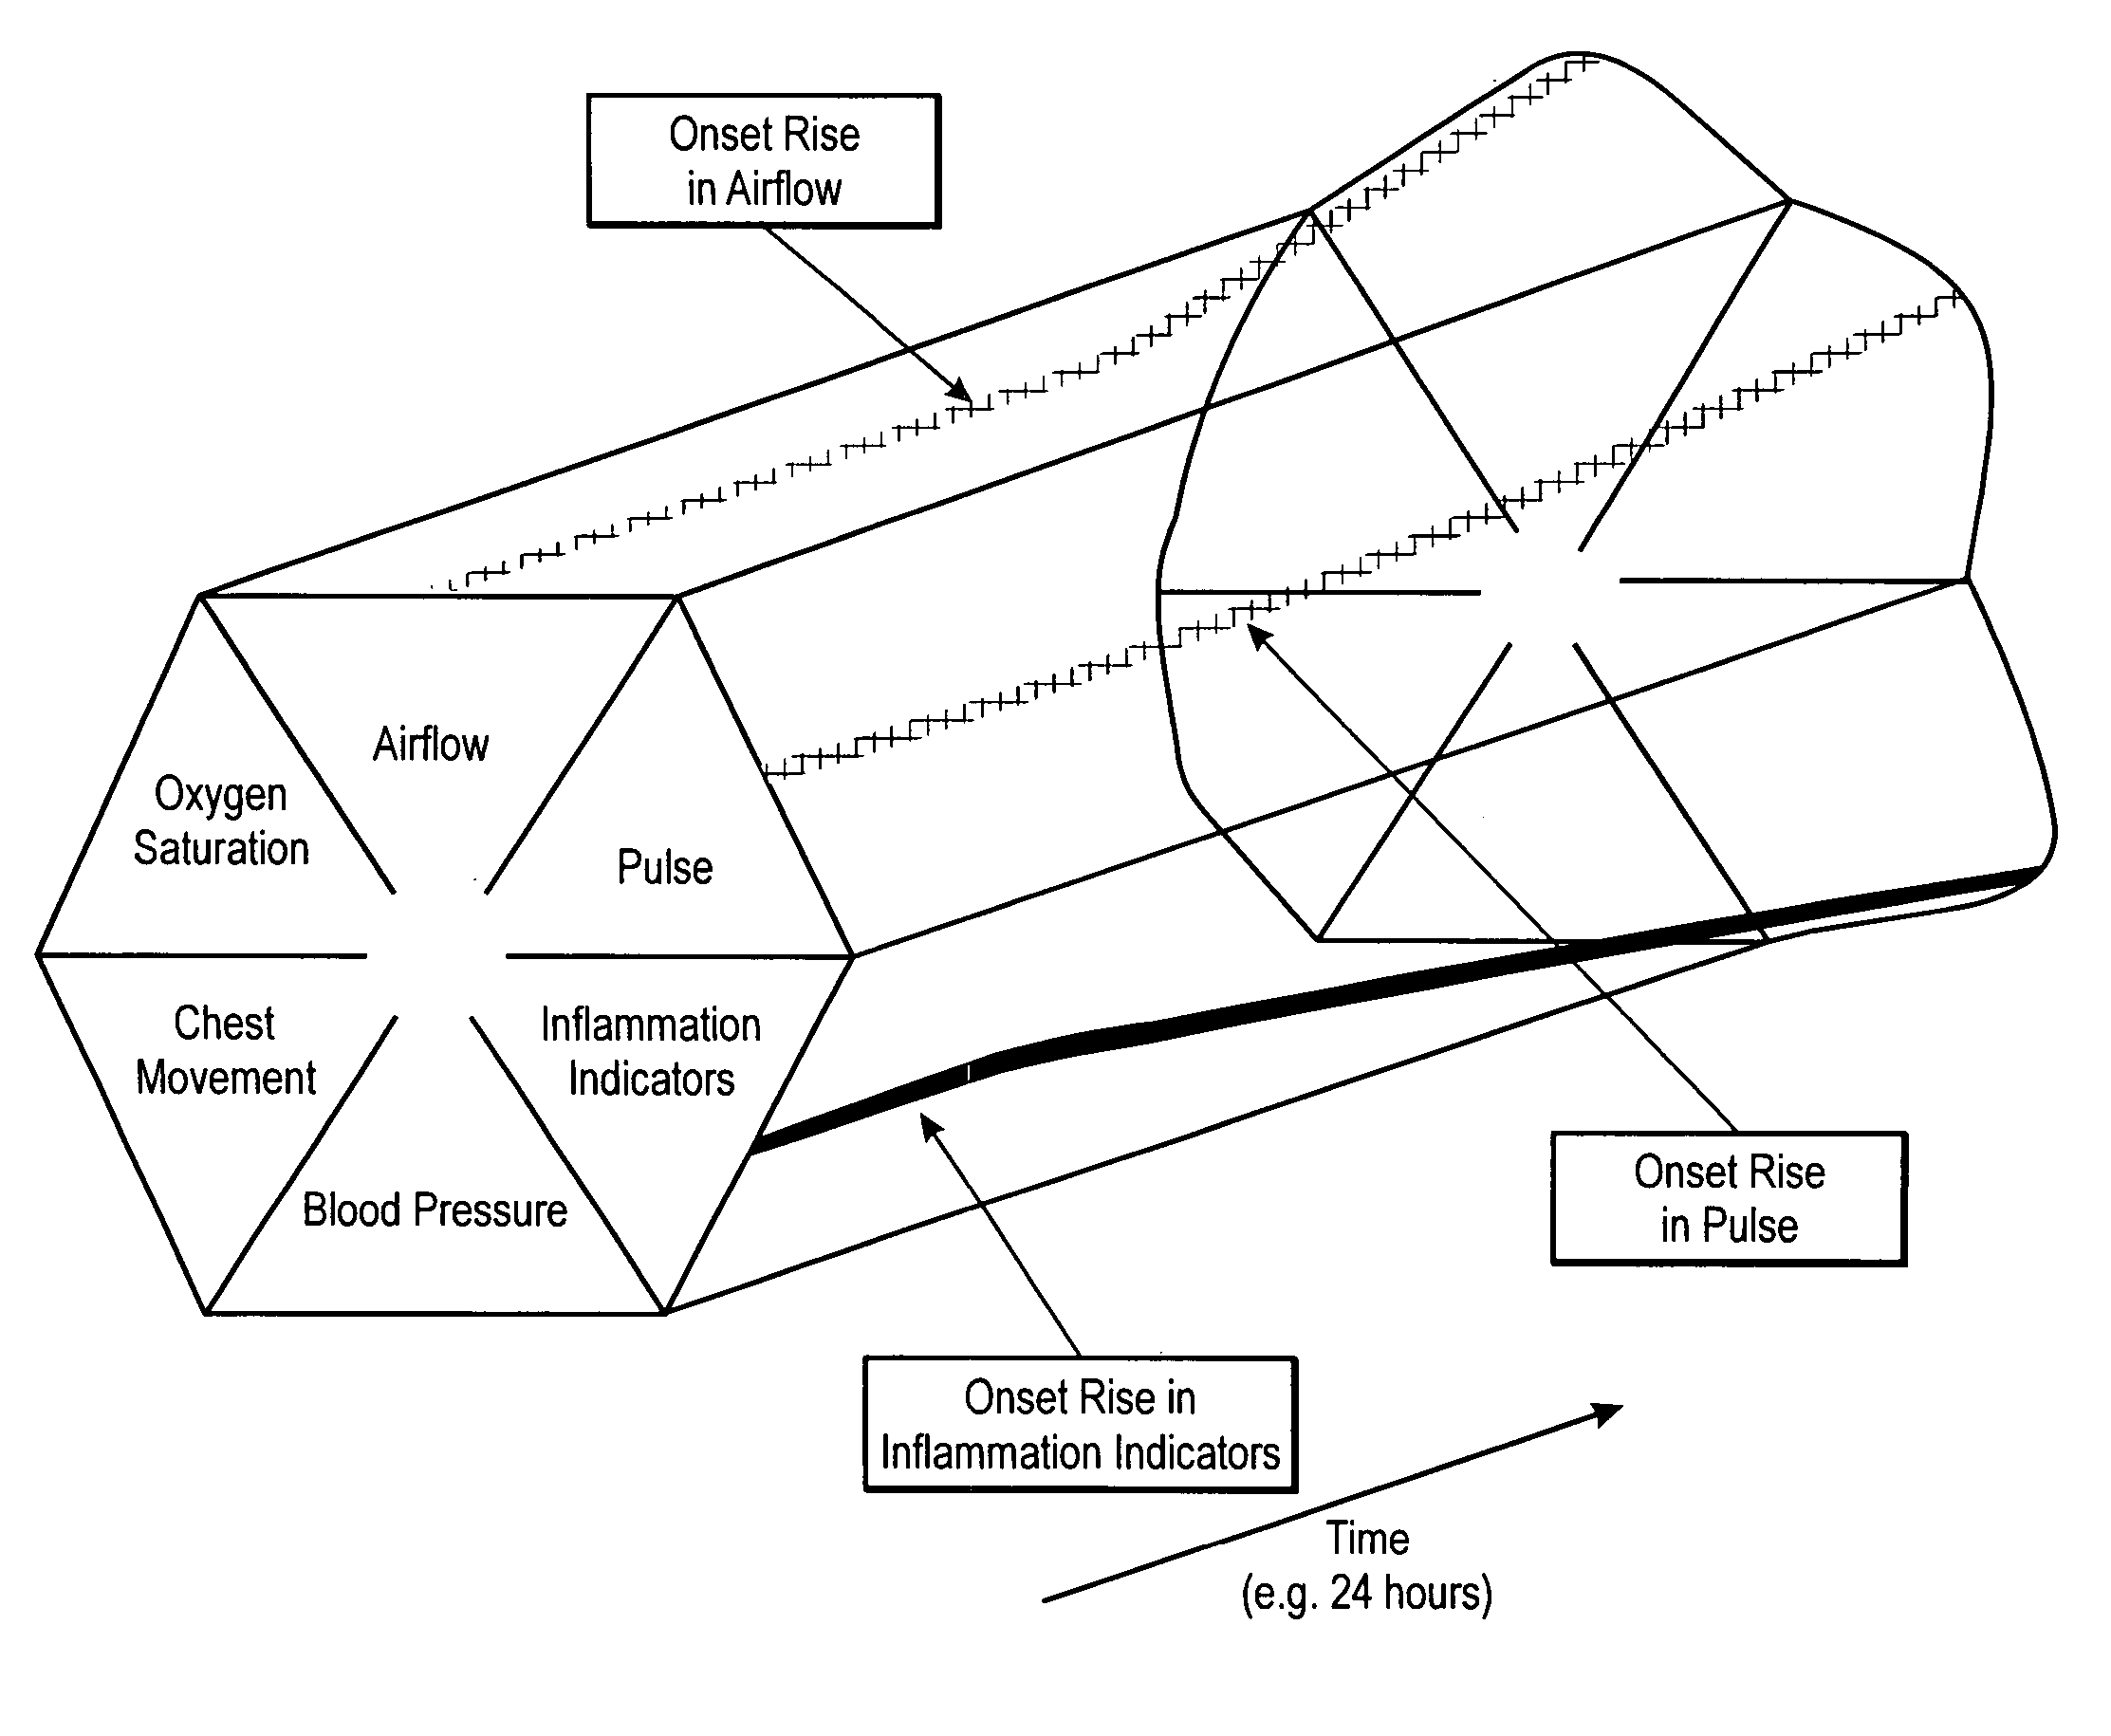
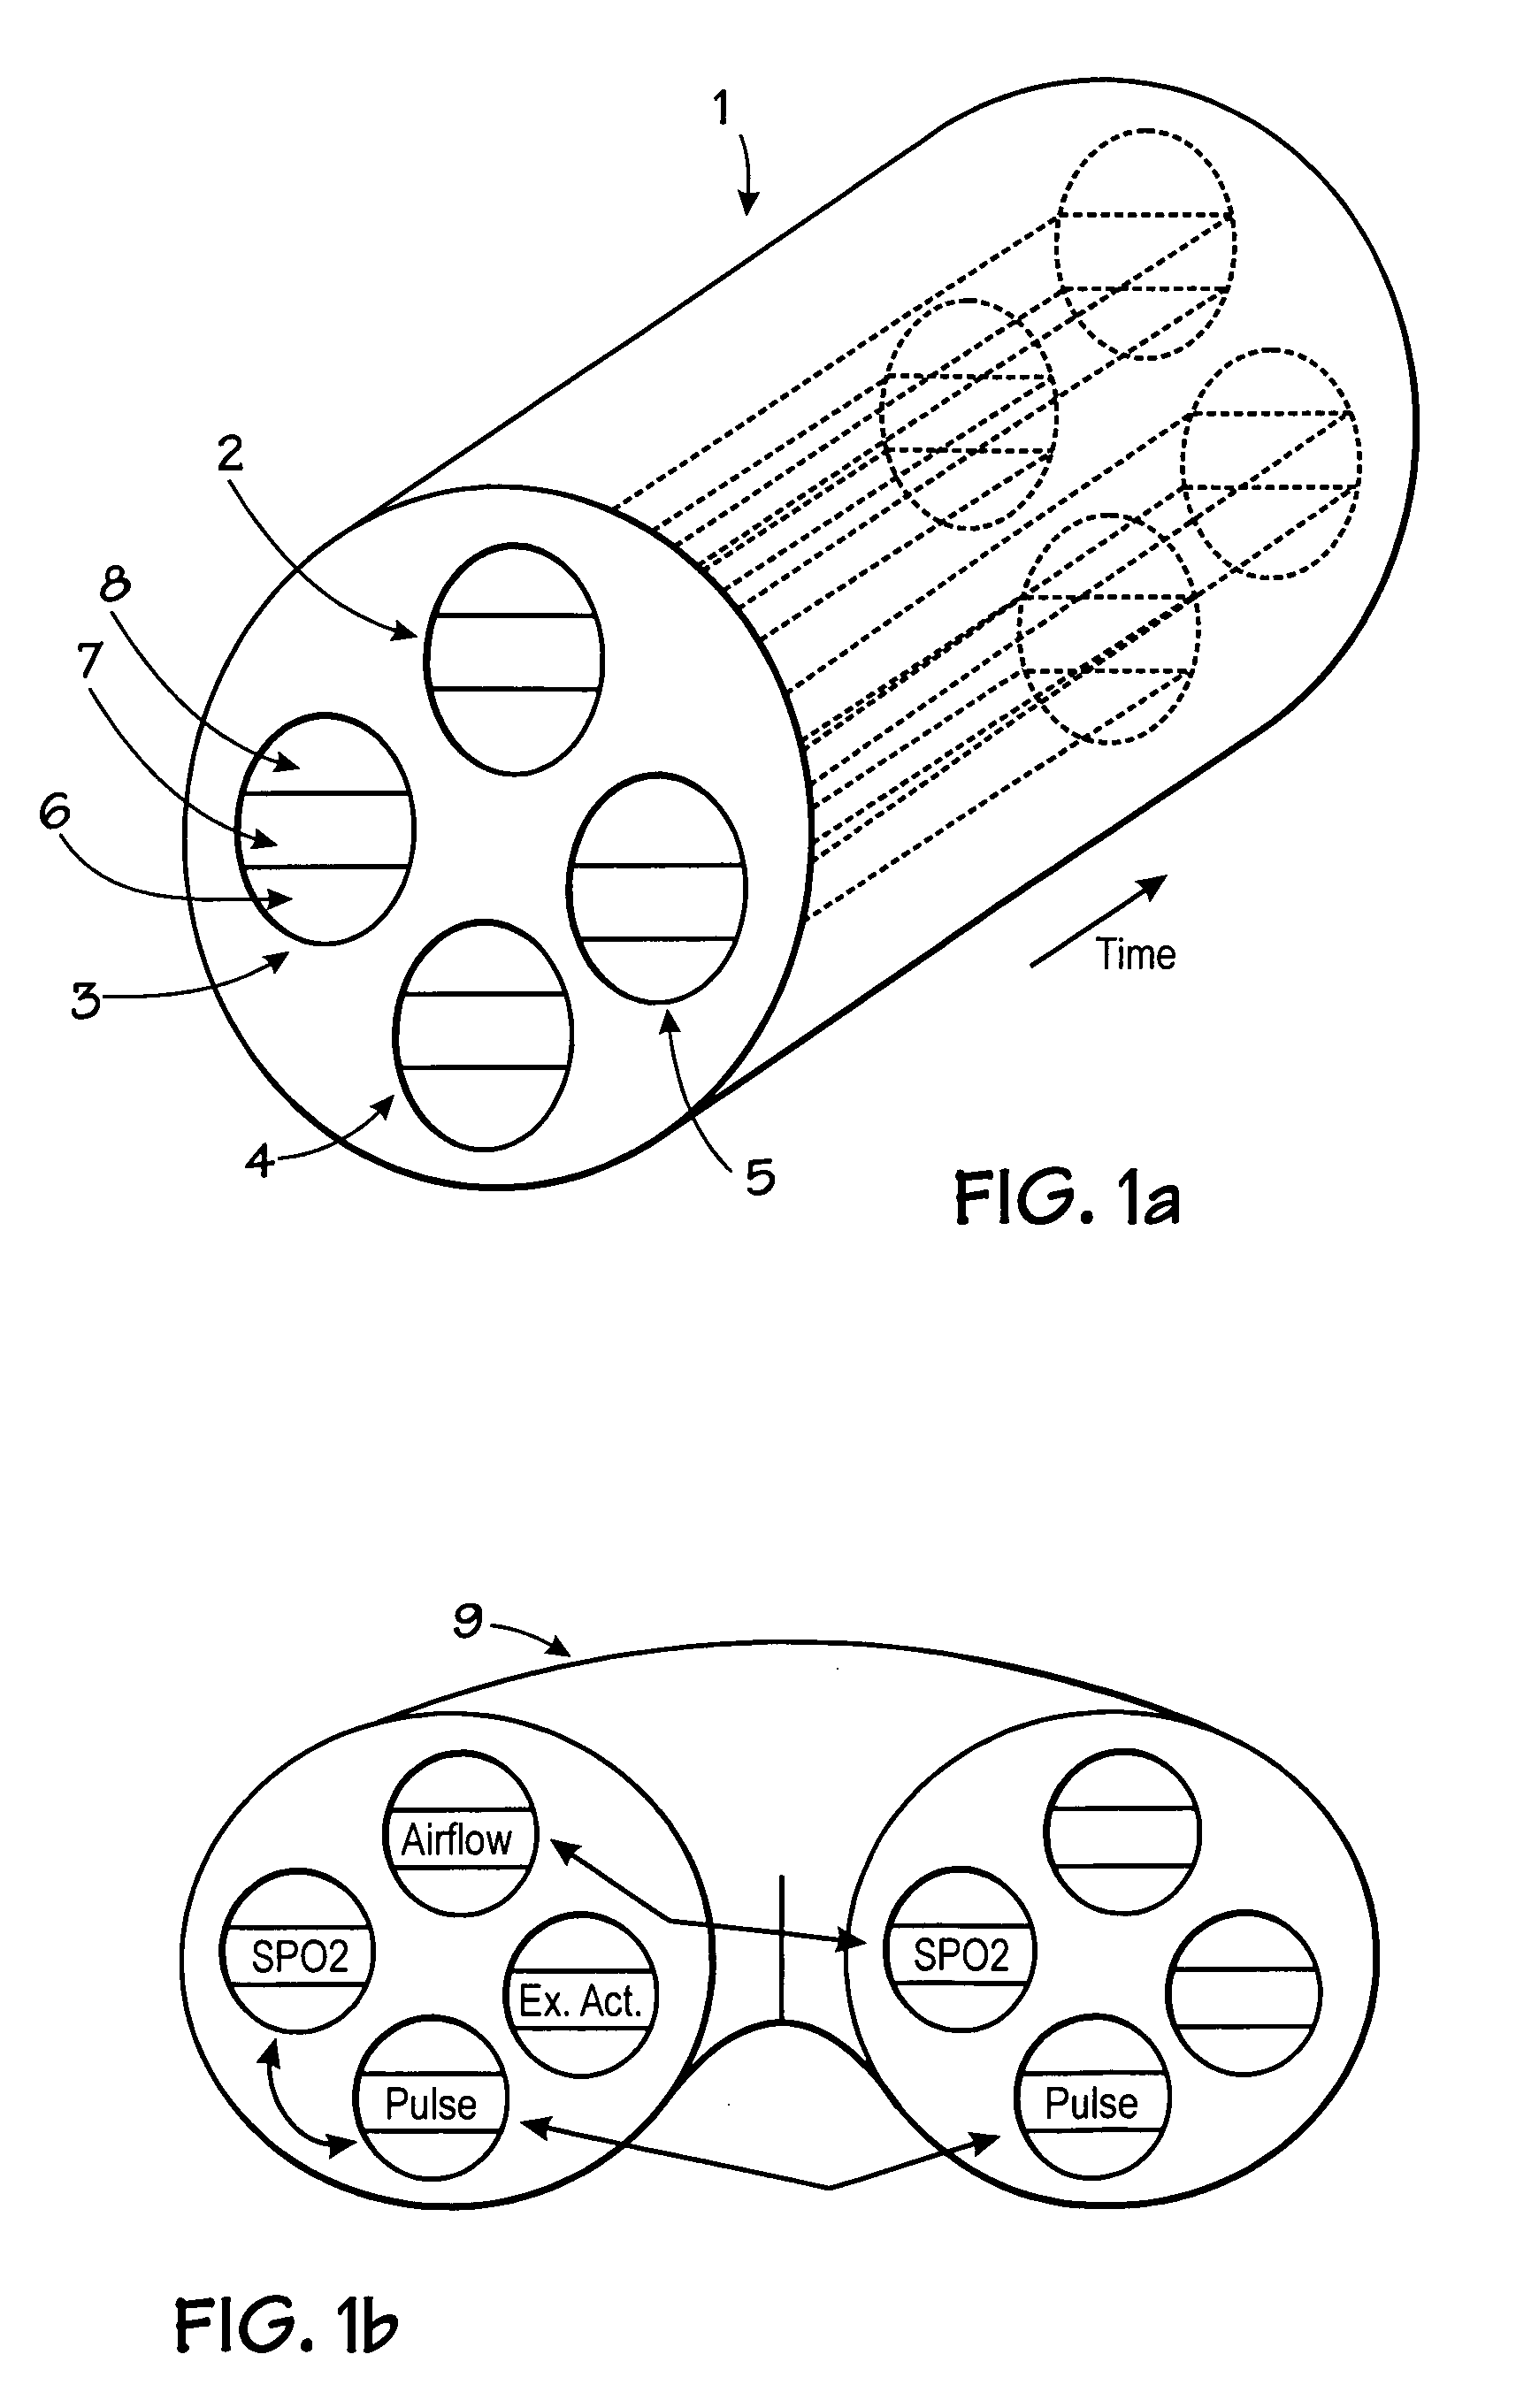
[0050] In a preferred embodiment, the processor system can automatically output an indication of pathophysiologic divergence relating to timed data sets derived from sensors which measure oxygen saturation, ventilation,
heart rate, plethesmographic pulse, and / or
blood pressure, to provide automatic comparisons of linked parameters in real time, as will be discussed. The indication can be provided in a two or three-dimensional graphical format in which the corresponding parameters are presented summary graphical format such as a timed two-dimensional or three-dimensional
animation. This allows the nurse or physician to immediately recognize pathophysiologic divergence.
[0051] According to another aspect of the invention the comparison of signals can be used to define a
mathematical relationship range between two parameters and the degree of variance from that range. This approach has substantial advantages over the simple comparison of a given
signal with itself along a time series to determine variability with respect to that
signal (as is described in US patent to Griffin U.S. Pat. No. 6,216,032, the disclosure of which is incorporated by reference as is completely disclosed herein), which has been shown to correlate loosely with a diseased or aged physiologic system. The
signal variability
processing method of the prior art, which has been widely used with
pulse rate, lacks specificity since variance in a given signal may have many causes. According to the present invention a plurality of signals are tracked to determine if the variability is present in all of the signals, to define the relationship between the signals with respect to that variability, and to determine if a particular signal (such as for example
airflow) is the primary (first) signal to vary with other signals tracking the primary signal. For example,
airway instability,
sepsis,
stroke, and congestive
heart failure are all associated with a high degree of
heart rate variability and this can be determined in relation to a baseline or by other known methods, however in the preferred embodiment the general variability of a plurality of signals is determined and these are matched to determine if a particular signal has a greater variability than the other signals, and more importantly the dynamic relationship between the signals is determined to identify the conformation of that variability. In this respect for example the pulse in
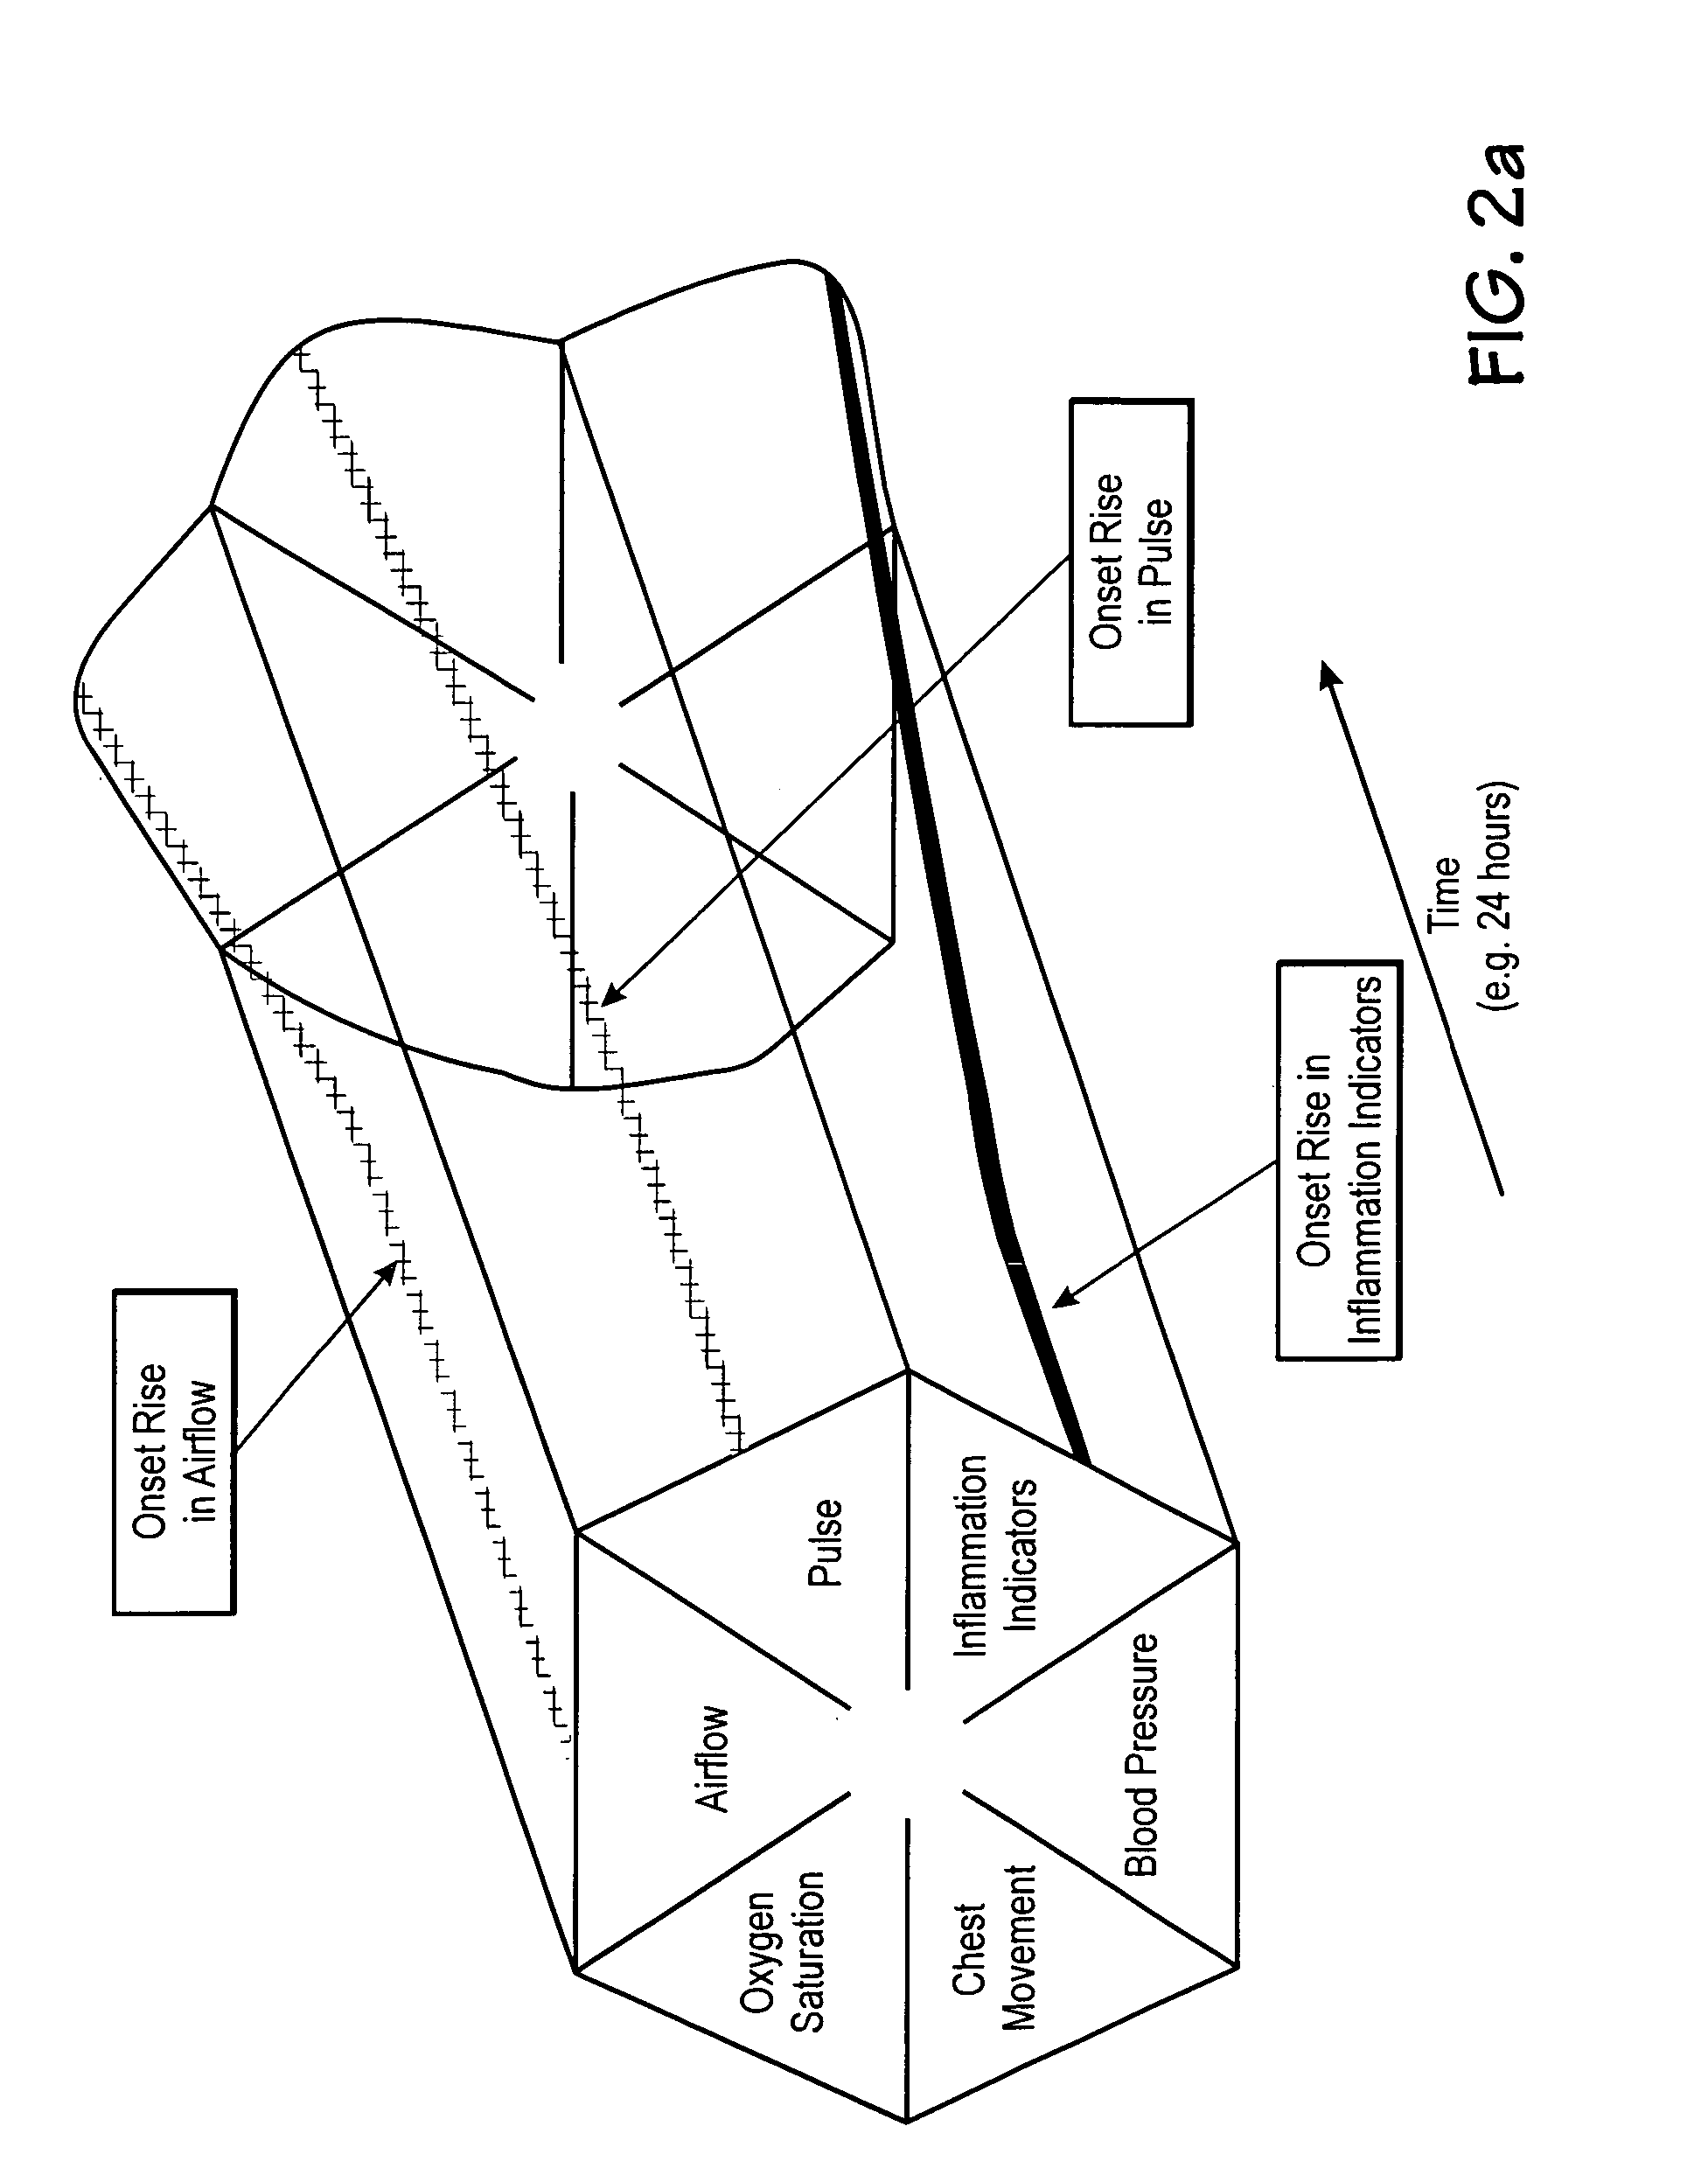
sepsis in a neonate may show a high degree of variability, by confirming that this variability is associated with a general multi-parameter conformation as shown in FIGS. 2a and 2b (and will be discussed in more detail) rather than a conformation of rapidly expanding and contracting parameters, as is typical of
airway instability. In this way the
etiology of the pulse variability is much better identified. Variability is therefore defined in relation to; which parameters are changing, whether they are changing together in a particular category of conformation indicative of a specific
disease process, and the extent to which they follow anticipated subordinate behavior is identified. According to another aspect of the present invention the time series of the parameter “relationship variance” and the time series of the “relationship variability” are analyzed as part of the cylindrical
data matrix.
[0052] Early in the state of
sepsis airflow and
heart rate variability begin to develop. However early the oxygen saturation is closely linked to the
airflow tracking the airflow and showing little variance near the top of its range. As
septic shock evolves variability increases and the tight relationship between airflow and oxygen saturation begins to breakdown. In one preferred embodiment, this relationship is analyzed, as time series of the calculated variance of the airflow, variance of the heart rate, and variance of the oxygen saturation, along with the streaming time series of objects of the original measured values. Timed calculated variability thereby comprising components of a cylindrical
data matrix of objects analyzed according to the methods described herein for time series analysis. Furthermore a time series of the variance from a given relationship and the variability of that variance is derived and added to the
data matrix. In an example an index of the magnitude value of airflow in relation to the magnitude value of oxygen saturation and / heart rate is calculated for each
data point (after adjusting for the
delay) and a time series of this index is derived. Then a time series of the calculated variability of the index is derived and added to the data matrix. The slope or trend of the index of airflow and oxygen saturation will rise significantly as
septic shock evolves and this can be correlated with the slope of the variability of the of that index. In comparison with
septic shock, in
airway instability, time series of these parameters shows a high degree of variability generally but a relatively low degree of variance of the indexed parameters associated with that variability (since despite their precipitous dynamic behavior, these parameters generally move together maintaining the basic relationships of physiologic subordinance). In addition to heart rate, a time series of the plethesmographic pulse (as amplitude, ascending slope,
area under the curve, etc.) variability and variance (as with continous
blood pressure or airflow) can be derived and incorporated with the data matrix for anal sis and comparison to determine variability and variance relationships as well as to define the general collective conformation of the dynamic relationships of all of these parameters.

