
Method for Evaluating the Quality of Data Collection in a Manufacturing Environment

Active Publication Date: 2007-11-08
PDF SOLUTIONS SA
View PDF3 Cites 32 Cited by
  • Summary
  • Abstract
  • Description
  • Claims
  • Application Information

AI Technical Summary

Benefits of technology

[0007] The present invention aims at guaranteeing a good reproducibility and quality level of the collected data, and therefore to ensure an accurate and reproducible data analysis, and at avoiding an inappropriate behavior of the quality control system when the quality of data collection is not sufficient. The present invention also aims at classifying or qualifying the pieces of equipment of a fab according to their data collection capacity.

Problems solved by technology

Due to a continuous technical progress in the field of semiconductors, these equipments are indeed more and more many and / or more and more complex due to the miniaturization of the manufactured components, and require a high degree of reliability for meeting high semiconductor products standards.
More specifically, when a system for production quality control uses pre-treatments such as a “data windowing” scheme to select only the useful data corresponding to what is requested for further data analysis and therefore optimize the necessary amount of collected data to maintain in the data base, and summarization algorithms to translate the raw data into indicators, corresponding to the desired physical and statistical process information needed for production quality control, these pre-treatments are liable to provide false results due to missing or non-synchronized raw data.
In other words, the underlying algorithms are not capable of detecting the origin of the presence of these bad raw data quality.
Therefore, false alarms or the like problems can be generated while the problem arises not from the data values but from the data collection chain.

Method used


Image

  • Method for Evaluating the Quality of Data Collection in a Manufacturing Environment
  • Method for Evaluating the Quality of Data Collection in a Manufacturing Environment
  • Method for Evaluating the Quality of Data Collection in a Manufacturing Environment

Examples


Embodiment Construction

[0036] Now referring to the drawings, the known fab control environment to which the present invention can be applied will first be described.

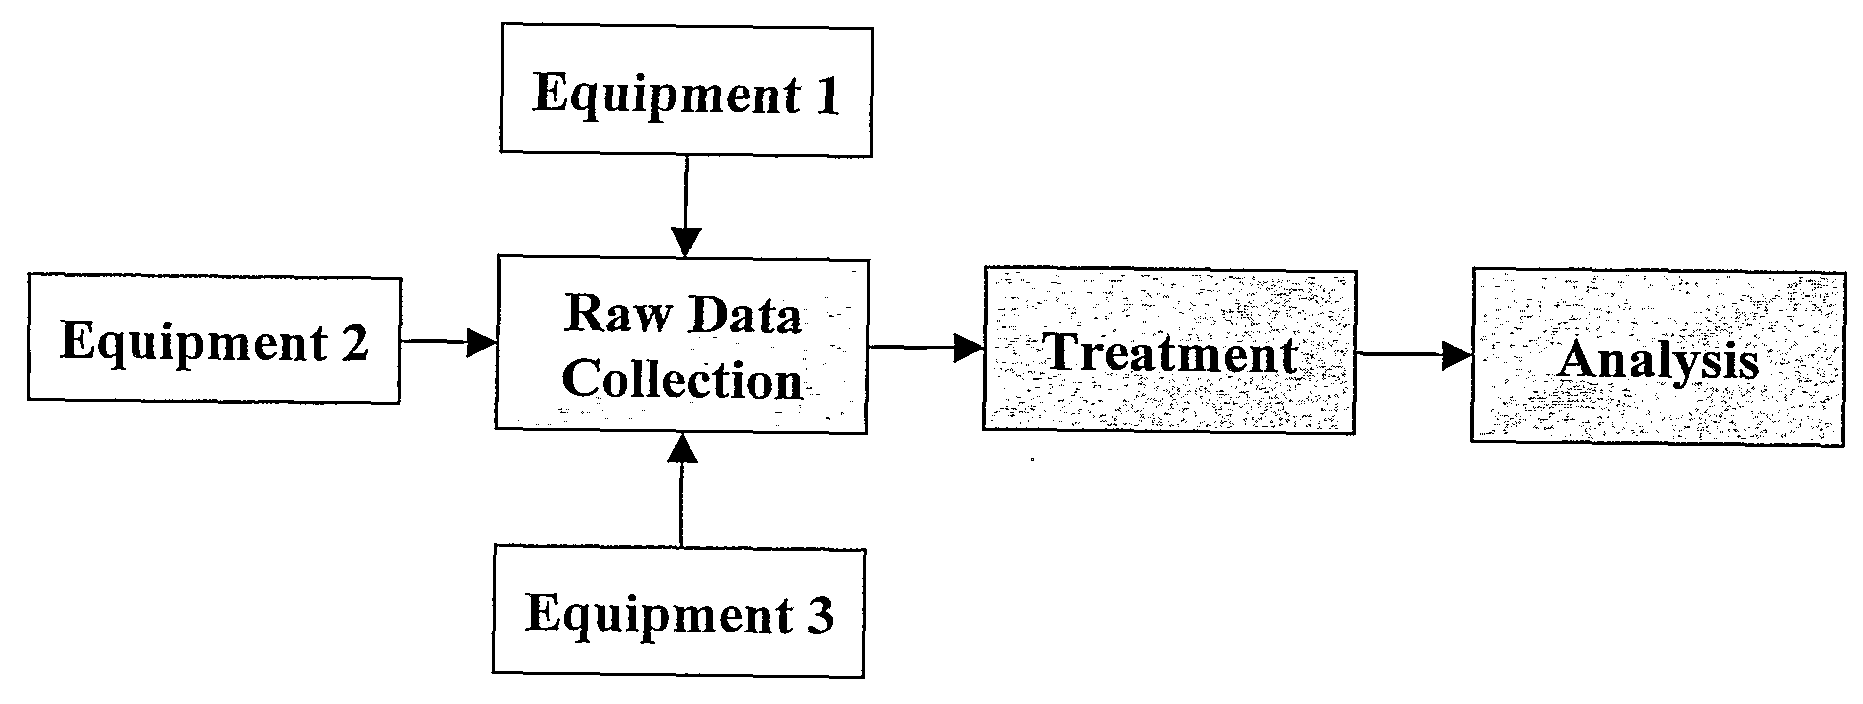
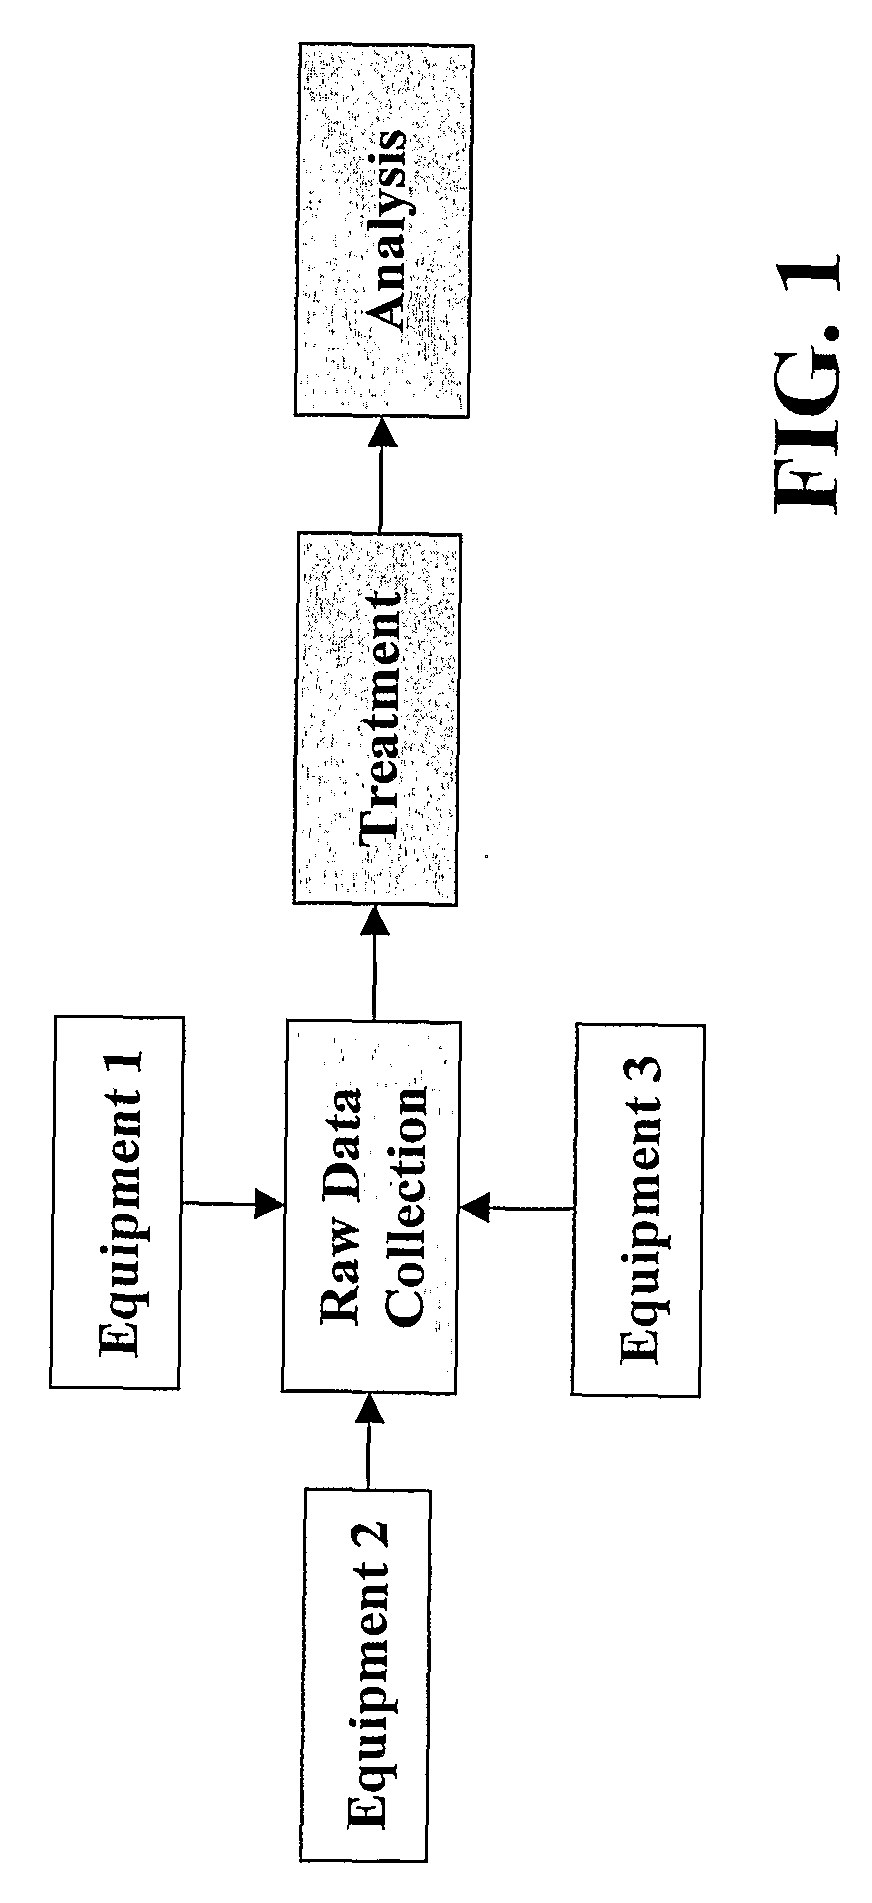
[0037] The block diagram of FIG. 1 diagrammatically shows the main steps implemented by conventional Advanced Process Control (APC) or Advanced Equipment Control (AEC) systems, wherein the processing system collects firstly the raw data coming from the various equipments, then pre-treats them in order to summarize the raw data into appropriate indicators reflecting the process health, and finally analyzes the pre-treated data for giving a result (as for example a diagnostic on the quality of the manufactured semiconductor products).

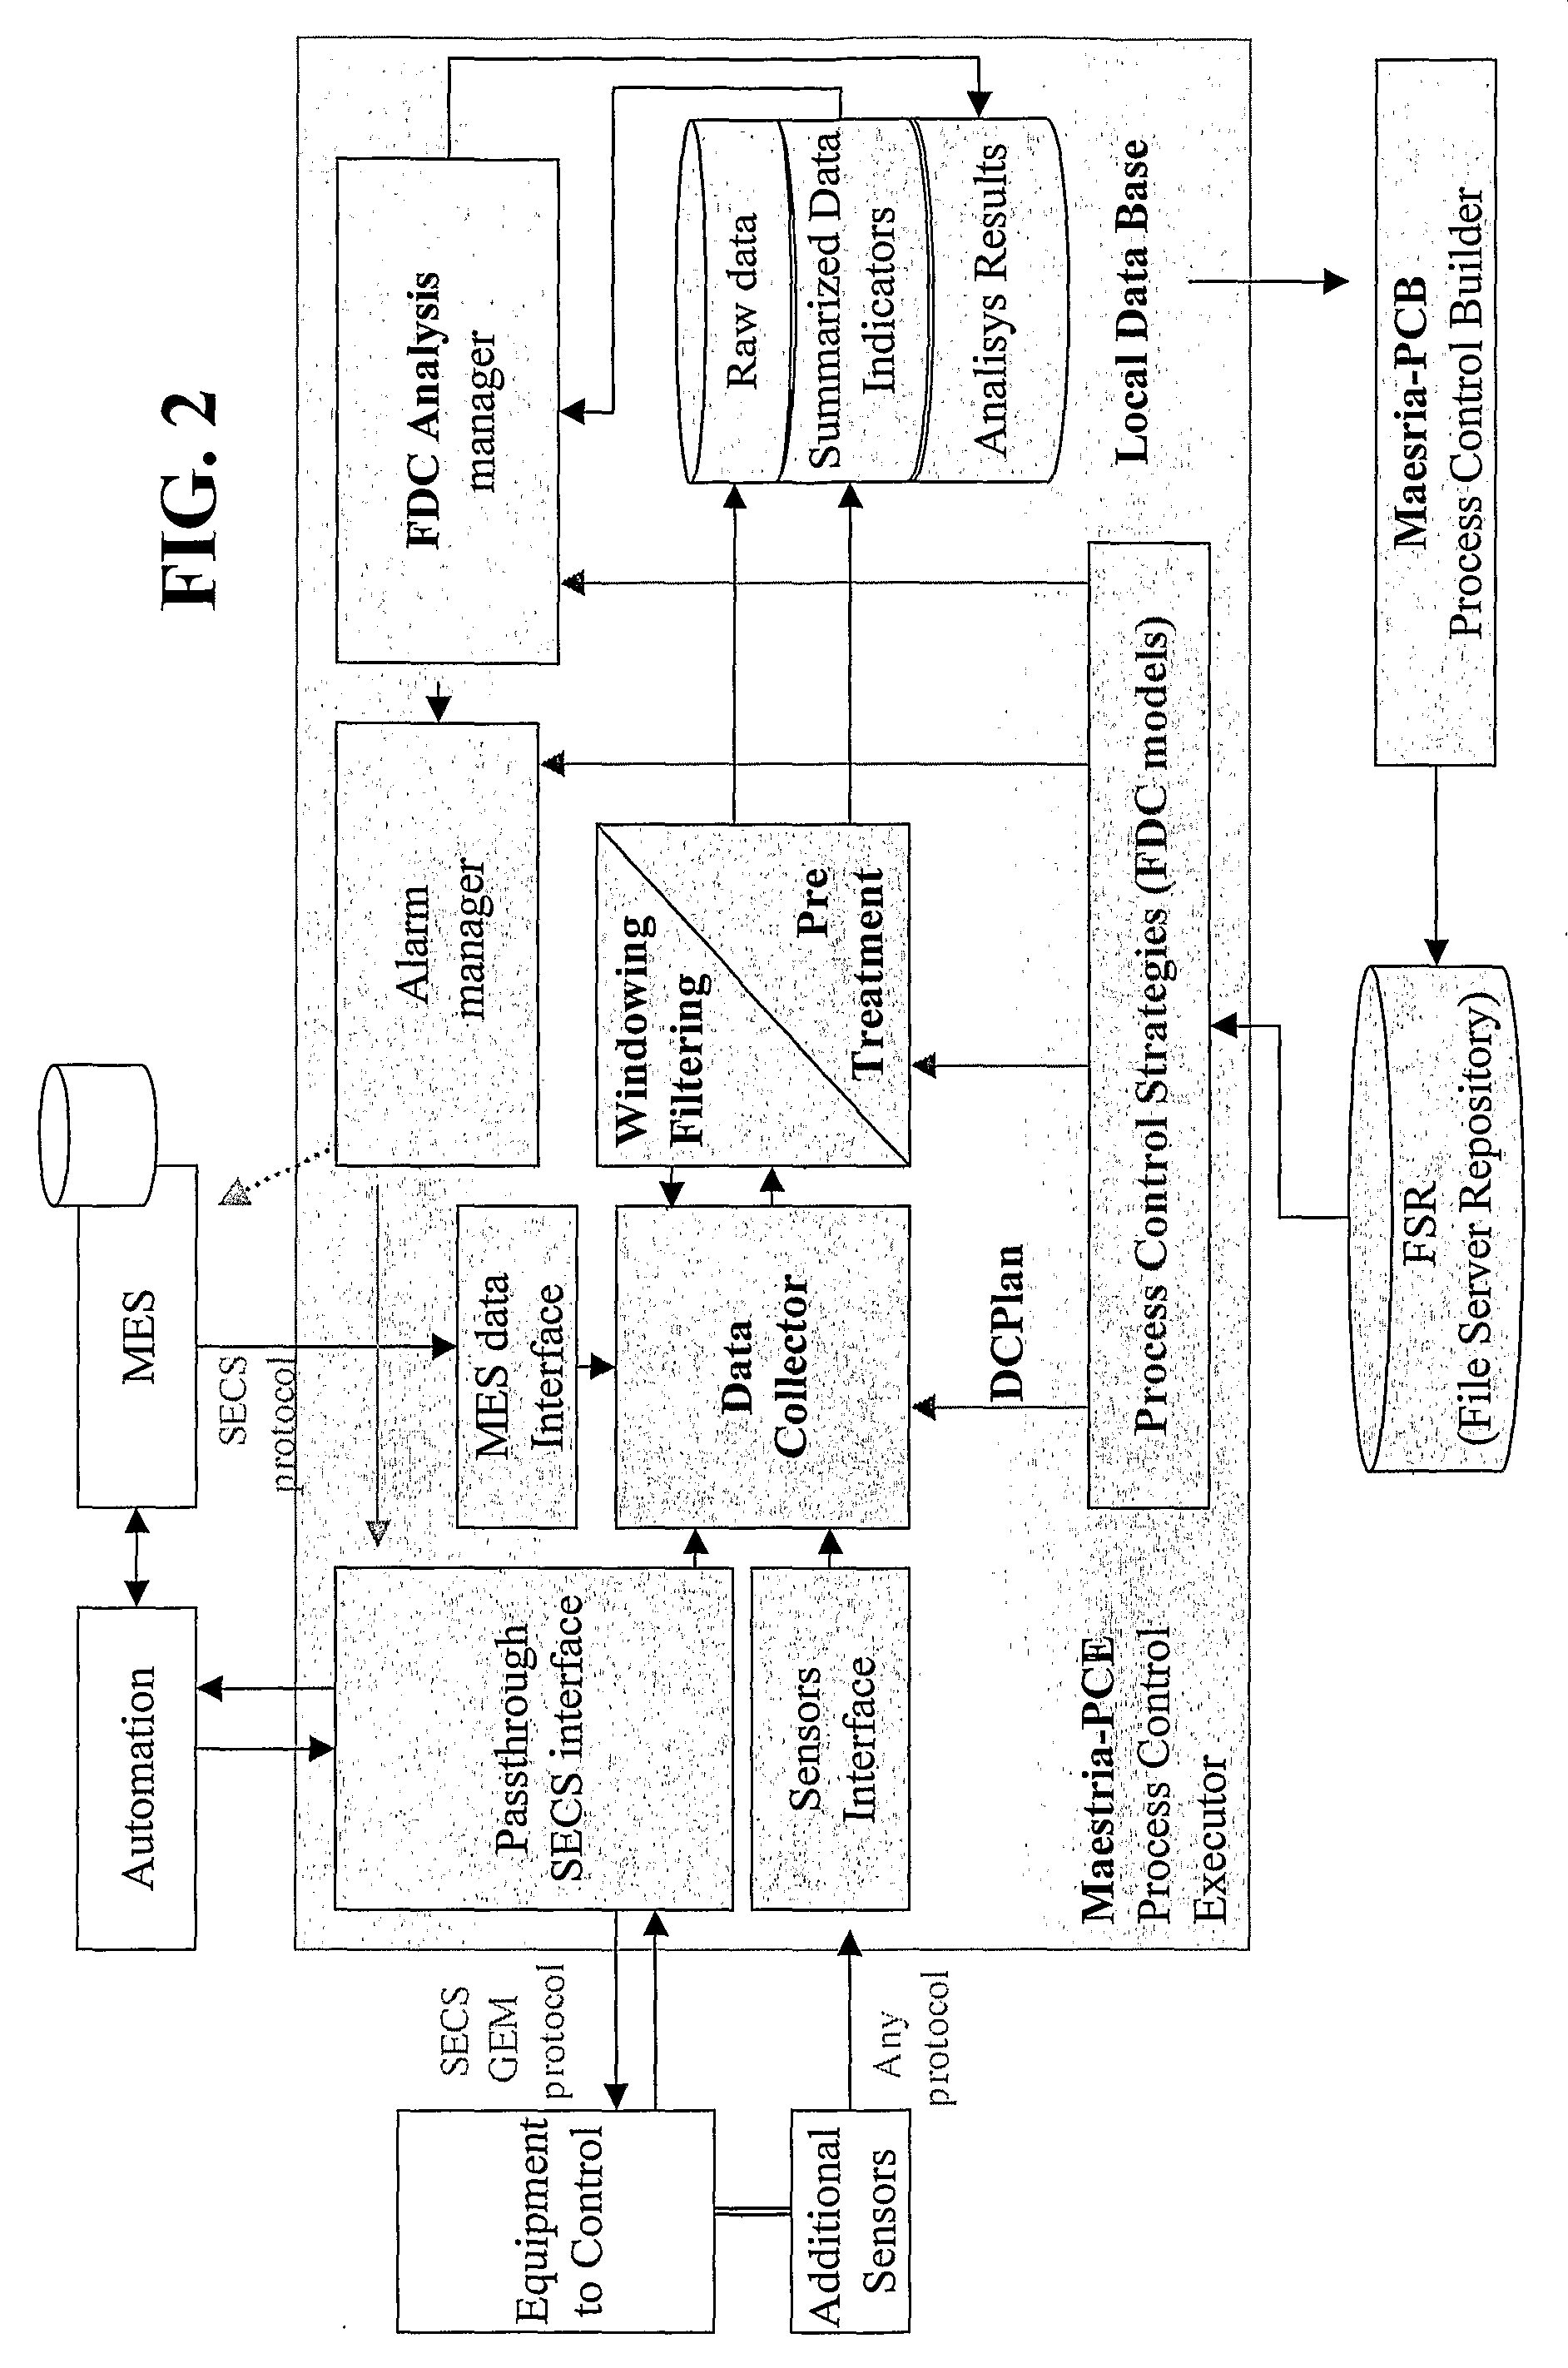
[0038]FIG. 2 of the drawings illustrates a known Fault Detection and Classification (FDC) system architecture, which is currently commercialized by the assignee of the present application under the Maestria range of software tools, that can divided into 5 main modules:

[0039] 1) Data Sources: data are collected fr...


PUM


Abstract

A method for evaluating the quality of data collection in a manufacturing environment is provided. Said data are intended to be analyzed by a process control system. The method comprising the following steps (A) collecting raw data according to a Data Collection plan specifying, and for each data item, a sampling time reference indicating at which time interval it is expected, and associating to each collected data item a timestamp indicating its actual collection time, (B) for at least a part of the raw data included inside a predetermined window, determining a Data Collection Quality Value (DCQV) by: (a) reading the timestamps; (b) computing at least one quality indicator value from the relationship between each timestamp and the corresponding time reference, wherein a shift represents a malfunction of the equipment or of the data collection system; (c) after steps (b) and (c) have been performed for all data items, computing a single data collection quality value (DCQV) indicator for said time window. Application to data qualification for analysis and equipment qualification e.g. in a semiconductor fab.

Description

[0001] The present invention generally relates to a method and system for quantifying and control the quality of a supply chain system collecting data from a manufacturing equipment such as a semiconductor fab, a flat panel display fab of other electronics, optics or optoelectronics manufacturing environments. BACKGROUND OF THE INVENTION [0002] In such environments, data collection operations are typically executed by a central processing system and apply to data usually coming from multiple equipments: Process Equipments, Metrology Equipments, External Additional Sensors, Other application Automation / Manufacturing Execution System (MES), Databases, etc. [0003] Due to a continuous technical progress in the field of semiconductors, these equipments are indeed more and more many and / or more and more complex due to the miniaturization of the manufactured components, and require a high degree of reliability for meeting high semiconductor products standards. [0004] Thus it is a need of a...

Claims


Application Information

Patent Timeline
IPC IPC(8): G06F19/00
CPCG05B23/0264G05B21/02
Inventor RAYMOND, THIERRY
Owner PDF SOLUTIONS SA
Learn More