Methods and Biomarkers for Diagnosing and Monitoring Psychotic Disorders
Inactive Publication Date: 2009-07-09
PSYNOVA NEUROTECH LTD
0 Cites 23 Cited by
AI-Extracted Technical Summary
Problems solved by technology
This is sometimes accompanied by features such as a lack of insight into the unusual or bizarre nature of their behaviour, difficulties with social interaction and impairments in carrying out the activities of daily living.
Auditory hallucinations tend to be particularly distressing when they are derogatory, commanding or preoccupying.
This is primarily because the aetiology of schizophrenia remains unknown (in fact, the aetiology of most psychiatric diseases is still unclear) and classification based on aetiology is as yet not feasible.
They may also become very irritated and may well appear to be ‘arrogant’ in manner.
Excessive involvement in activities that can bring pleasure but may have disastrous consequences (e.g. sexual affairs and spending excessively).
It is difficult to distinguish the symptoms of an individual suffering from the depressed mood of manic depression from someone suffering from a major depression.
The prolonged process currently needed to achieve accurate diagnosis of psychotic disorders may delay appropriate treatment, which is likely to have serious implications for medium to long-term disease outcome.
Unfortunately, at present there are no standard, sensitive, specific tests for psychotic disorders, such as schizophrenia or bipolar dis...
Benefits of technology
[0072]Furthermore, diagnostic biomarker tests are useful to identify family members or patients in the “prodromal phase”, i.e. those at high risk of developing overt schizophrenia. This permits initiation of appropriate therapy, for ...
Abstract
The invention relates to methods of diagnosing or monitoring a psychotic disorder in a subject comprising providing a test biological sample from the subject, performing spectral analysis on said test biological sample to provide one or more spectra, and, comparing the one or more spectra with one or more control spectra. The invention also relates to methods for diagnosing or monitoring psychotic disorders such as schizophrenic or bipolar disorders, comprising measuring the level of one or more biomarkers present in a biological sample taken from a test subject, said biomarkers being selected from the group consisting of transthyretin, ApoA1: VLDL, LDL and aromatic species such as plasma proteins. The invention also relates to sensors, biosensors, multi-analyte panels, arrays, assays and kits for performing methods of the invention.
Application Domain
Nervous disorderMagnetic measurements +5
Technology Topic
Spectral analysisTransthyretin +7
Image
Examples
- Experimental program(4)
Example
Example 1
[0230]Plasma samples from 21 pairs of monozygotic twins discordant for schizophrenia and 16 matched control twins were collected under standardised conditions by Dr Fuller Torrey, Stanley Medical Research Institute, Bethesda, USA. All study participants gave their written informed consent and the original study was approved by an Institutional Review Board. The GAF of each individual was derived by consensus of the two interviewers who did the SCID interview Structured Clinical Interview for DSM-IV-TR (SCID). SCID is a clinical rating scale which involves a semi-structured diagnostic interview designed to assist clinicians, researchers, and trainees in making reliable DSM-IV psychiatric diagnoses. The plasma was obtained from both twins simultaneously as part of a lymphocyte collection aphoresis procedure carried out at mid-morning, with both twins having been on similar diets and residing in a hotel together. Blood plasma samples (50 μl) were made up to a final volume of 500 μl by the addition of D2O in preparation for 1H NMR analysis. Plasma samples were diluted to a final volume of 550 μl by the addition of isotonic saline solution containing 10% D2O for the NMR field-frequency lock.
[0231]Twin samples were divided into aliquots and stored at −80° C. None of the samples underwent more than 3 freeze-thaw cycles prior to acquisition of NMR spectra. All experiments were performed under blind and randomized conditions. Plasma samples (50 μl) were made up to a final volume of 500 μl by the addition of D2O in preparation for 1H NMR analysis. Plasma samples were diluted to a final volume of 550 μl by the addition of isotonic saline solution containing 10% D2O for the NMR field-frequency lock.
1H NMR Spectroscopy of Plasma Samples:
[0232]Standard 1-D 600 MHz 1H NMR spectra were acquired for all samples using a pre-saturation pulse sequence to effect suppression of the water resonance (pulse sequence: relaxation delay-90°-t1-90°-tm-90°-acquire FID; Bruker Analytische GmbH, Rheinstetten, Germany). In this pulse sequence, a secondary radio frequency irradiation is applied specifically at the water resonance frequency during the relaxation delay of 2s and the mixing period (tm=100 ms), with t1 fixed at 3 μs. Typically 256 transients were acquired at 300K into 32K data points, with a spectral width of 6000 Hz and an acquisition time of 1.36s per scan. Prior to Fourier transformation, the free induction decays (FID's) were multiplied by an exponential weight function corresponding to a line-broadening factor of 0.3 Hz.
Data Reduction and Pattern Recognition Procedures:
[0233]To evaluate efficiently the metabolic variability within and between biofluids derived from patients and controls, spectra were data reduced using the software program AMIX (Analysis of MIXtures version 2.5, Bruker Rheinstetten, Germany) and exported into SIMCA-P (version-10.5, Umetrics AB, Umeå, Sweden) where a range of multivariate statistical analyses were conducted. Initially principal components analysis (PCA) was applied to the data in order to discern the presence of inherent similarities in spectral profiles. Where the classification of 1H NMR spectra was influenced by exogenous contaminants, the spectral regions containing those signals were removed from statistical analysis. In order to confirm the biomarkers differentiating between the schizophrenia patients and matched controls, projection to latent structure discriminant analysis (PLS-DA) was employed. Where appropriate, data were subjected to one-way analysis of variance (ANOVA) using the Statistical Package for Social Scientists (SPSS/PC 13; SPSS, Chicago). Where the F ratio gave P<0.05, comparisons between individual group means were made by Dunnett T3 test at significance levels of P=0.05.
Results
[0234]Plots of PLS-DA scores based on 1H NMR spectra of plasma from 21 pairs of monozygotic twins discordant for schizophrenia and 16 matched control twins differentiated affected and unaffected twins from age-matched control twins (FIGS. 1A and 1B). The loading coefficients indicated that resonances from VLDL (0.92-0.88 ppm and 1.28-1.32 ppm), LDL (0.84-0.88 ppm and 1.24-28 ppm) and aromatic groups (˜δ7.5; most likely representing plasma proteins) were predominantly responsible for the separation (Table 3; FIG. 1C). Co-twins with schizophrenia showed a 23% (p=0.015; ANOVA) increase in plasma VLDL signals (1.28-1.32 ppm) compared to control twins. Corresponding unaffected co-twins were also found to have increased 1.28-1.32 ppm signals, however, differences were not quite significant for the unaffected group (p=0.18; ANOVA). LDL levels in the three groups showed a trend similar to that of the VLDL signals but, again, did not reach statistical significance (data not shown). In addition, discordant schizophrenia twins had lower plasma protein levels represented by aromatic signals around 7.5 ppm (14% and 8% reduction for the affected and unaffected co-twins respectively; p<0.01). No difference was observed in HDL signals (0.6-0.7 ppm) between the groups. Further analyses showed a much more pronounced differentiation of female twins (FIG. 2). The key chemical shifts that differentiated the groups are listed in Table 3. Interestingly, PLS-DA analyses between the female affected and healthy discordant twins alone showed that the same scores and loading plots that significantly separated the discordant twins from control twins is responsible for the separation between the discordant twins themselves. This implies that the identified metabolic alterations are a genuine disease-related signature. Furthermore, signals between 1.24-1.28 ppm (mainly LDL) correlated strongly with scores obtained from the DSM IV Axis V Global Assessment of Functioning (GAF) Scale (R2=0.62, FIG. 3), which represents one of the most widely used methods for assessing impairment among patients with psychiatric disorders. The rating is made on a scale from 1 to 100 with ratings of 1-10 representing severe impairment and ratings of 90 or more indicating superior functioning (DSMIV; Moos et al., 2002). Plasma VLDL signals (1.28-1.32 ppm) of female twins also show a strong correlation with GAF scores (R2=0.54; FIG. 3). No correlation was found when all twins or male twins alone were considered (data not shown). Age did not appear to have an effect on disease-related chemical shifts. However, antipsychotics drug exposure (measured as fluphenezine equivalent) also correlated with GAF scores and metabolic signature respectively of the female twins.
[0235]On the other hand, corresponding plots of PLS-DA scores of plasma 1H NMR spectra derived from male twins discordant for schizophrenia showed a less prominent differentiation between affected and unaffected twins (FIG. 4A). Unlike the female twins, the loading coefficients indicated that resonances from the aromatic region, corresponding to plasma proteins, are mainly responsible for the separation amongst male twins (FIG. 4B). No correlation was found between the glucose signals and antipsychotic treatment, age, duration of illness, substance abuse and GAF scores (data not shown) for male twins. No significant difference was found between male control twins and unaffected co-twins (FIG. 4A).
Discussion of Example 1
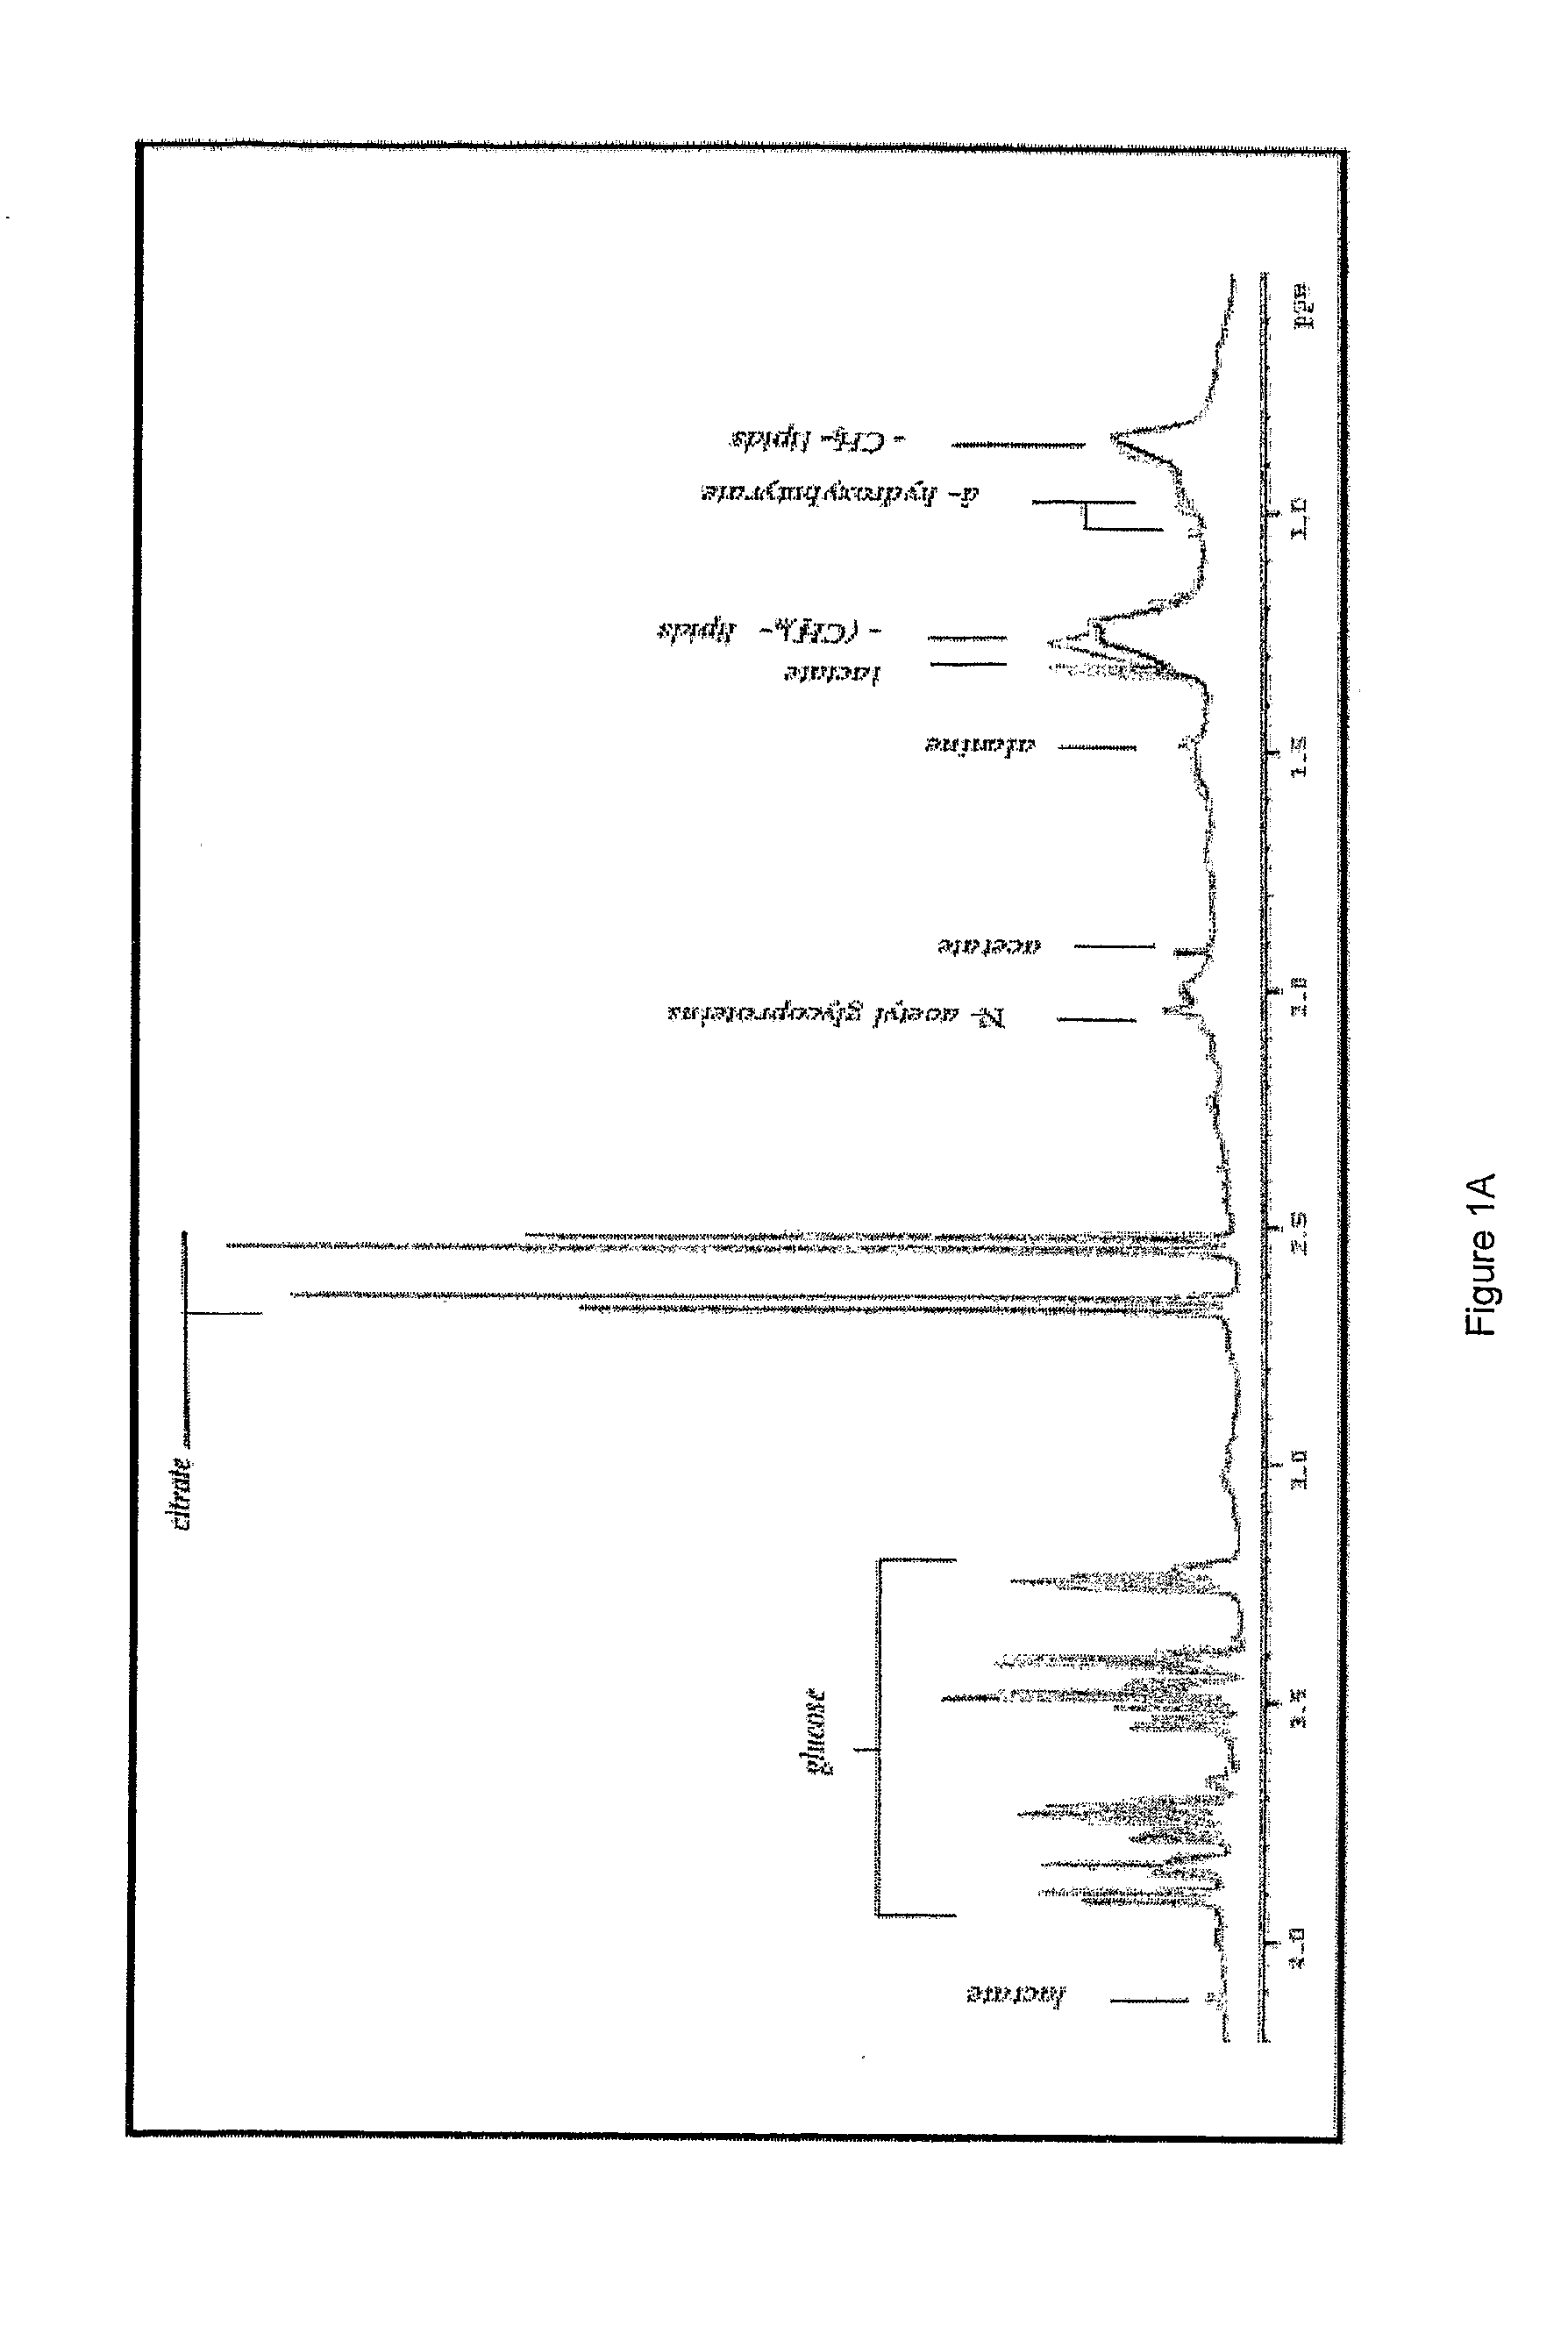
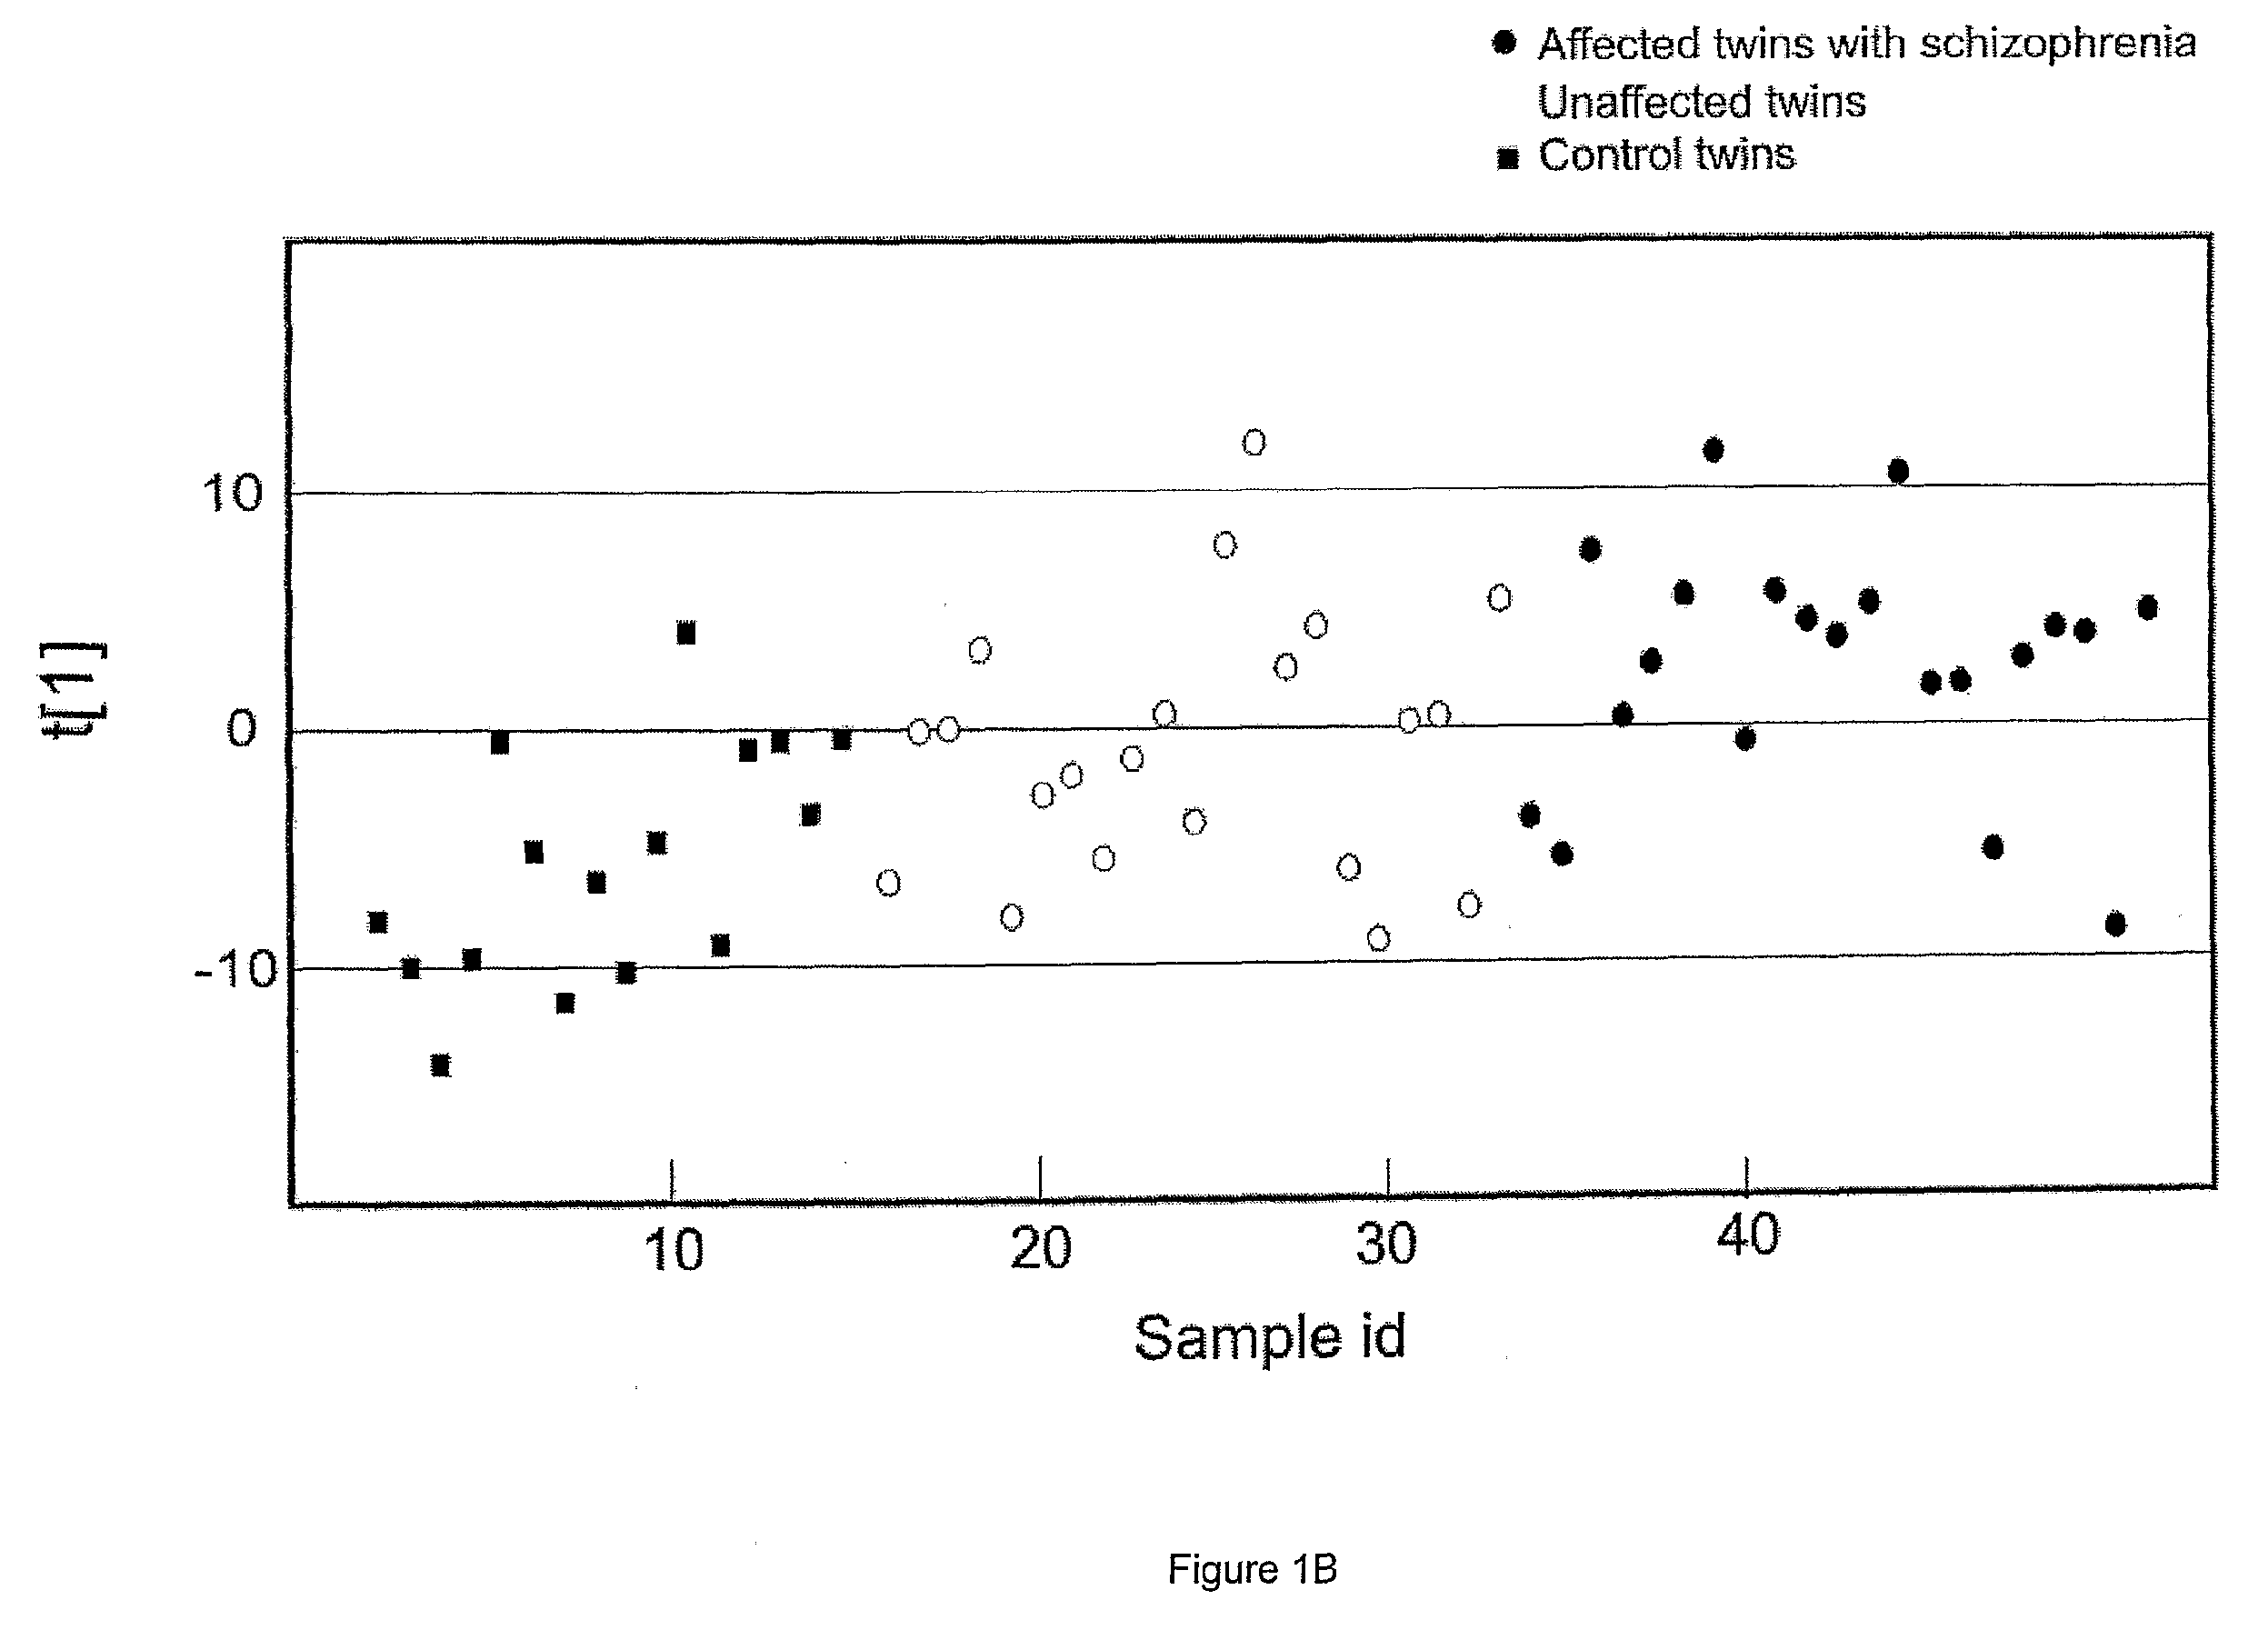
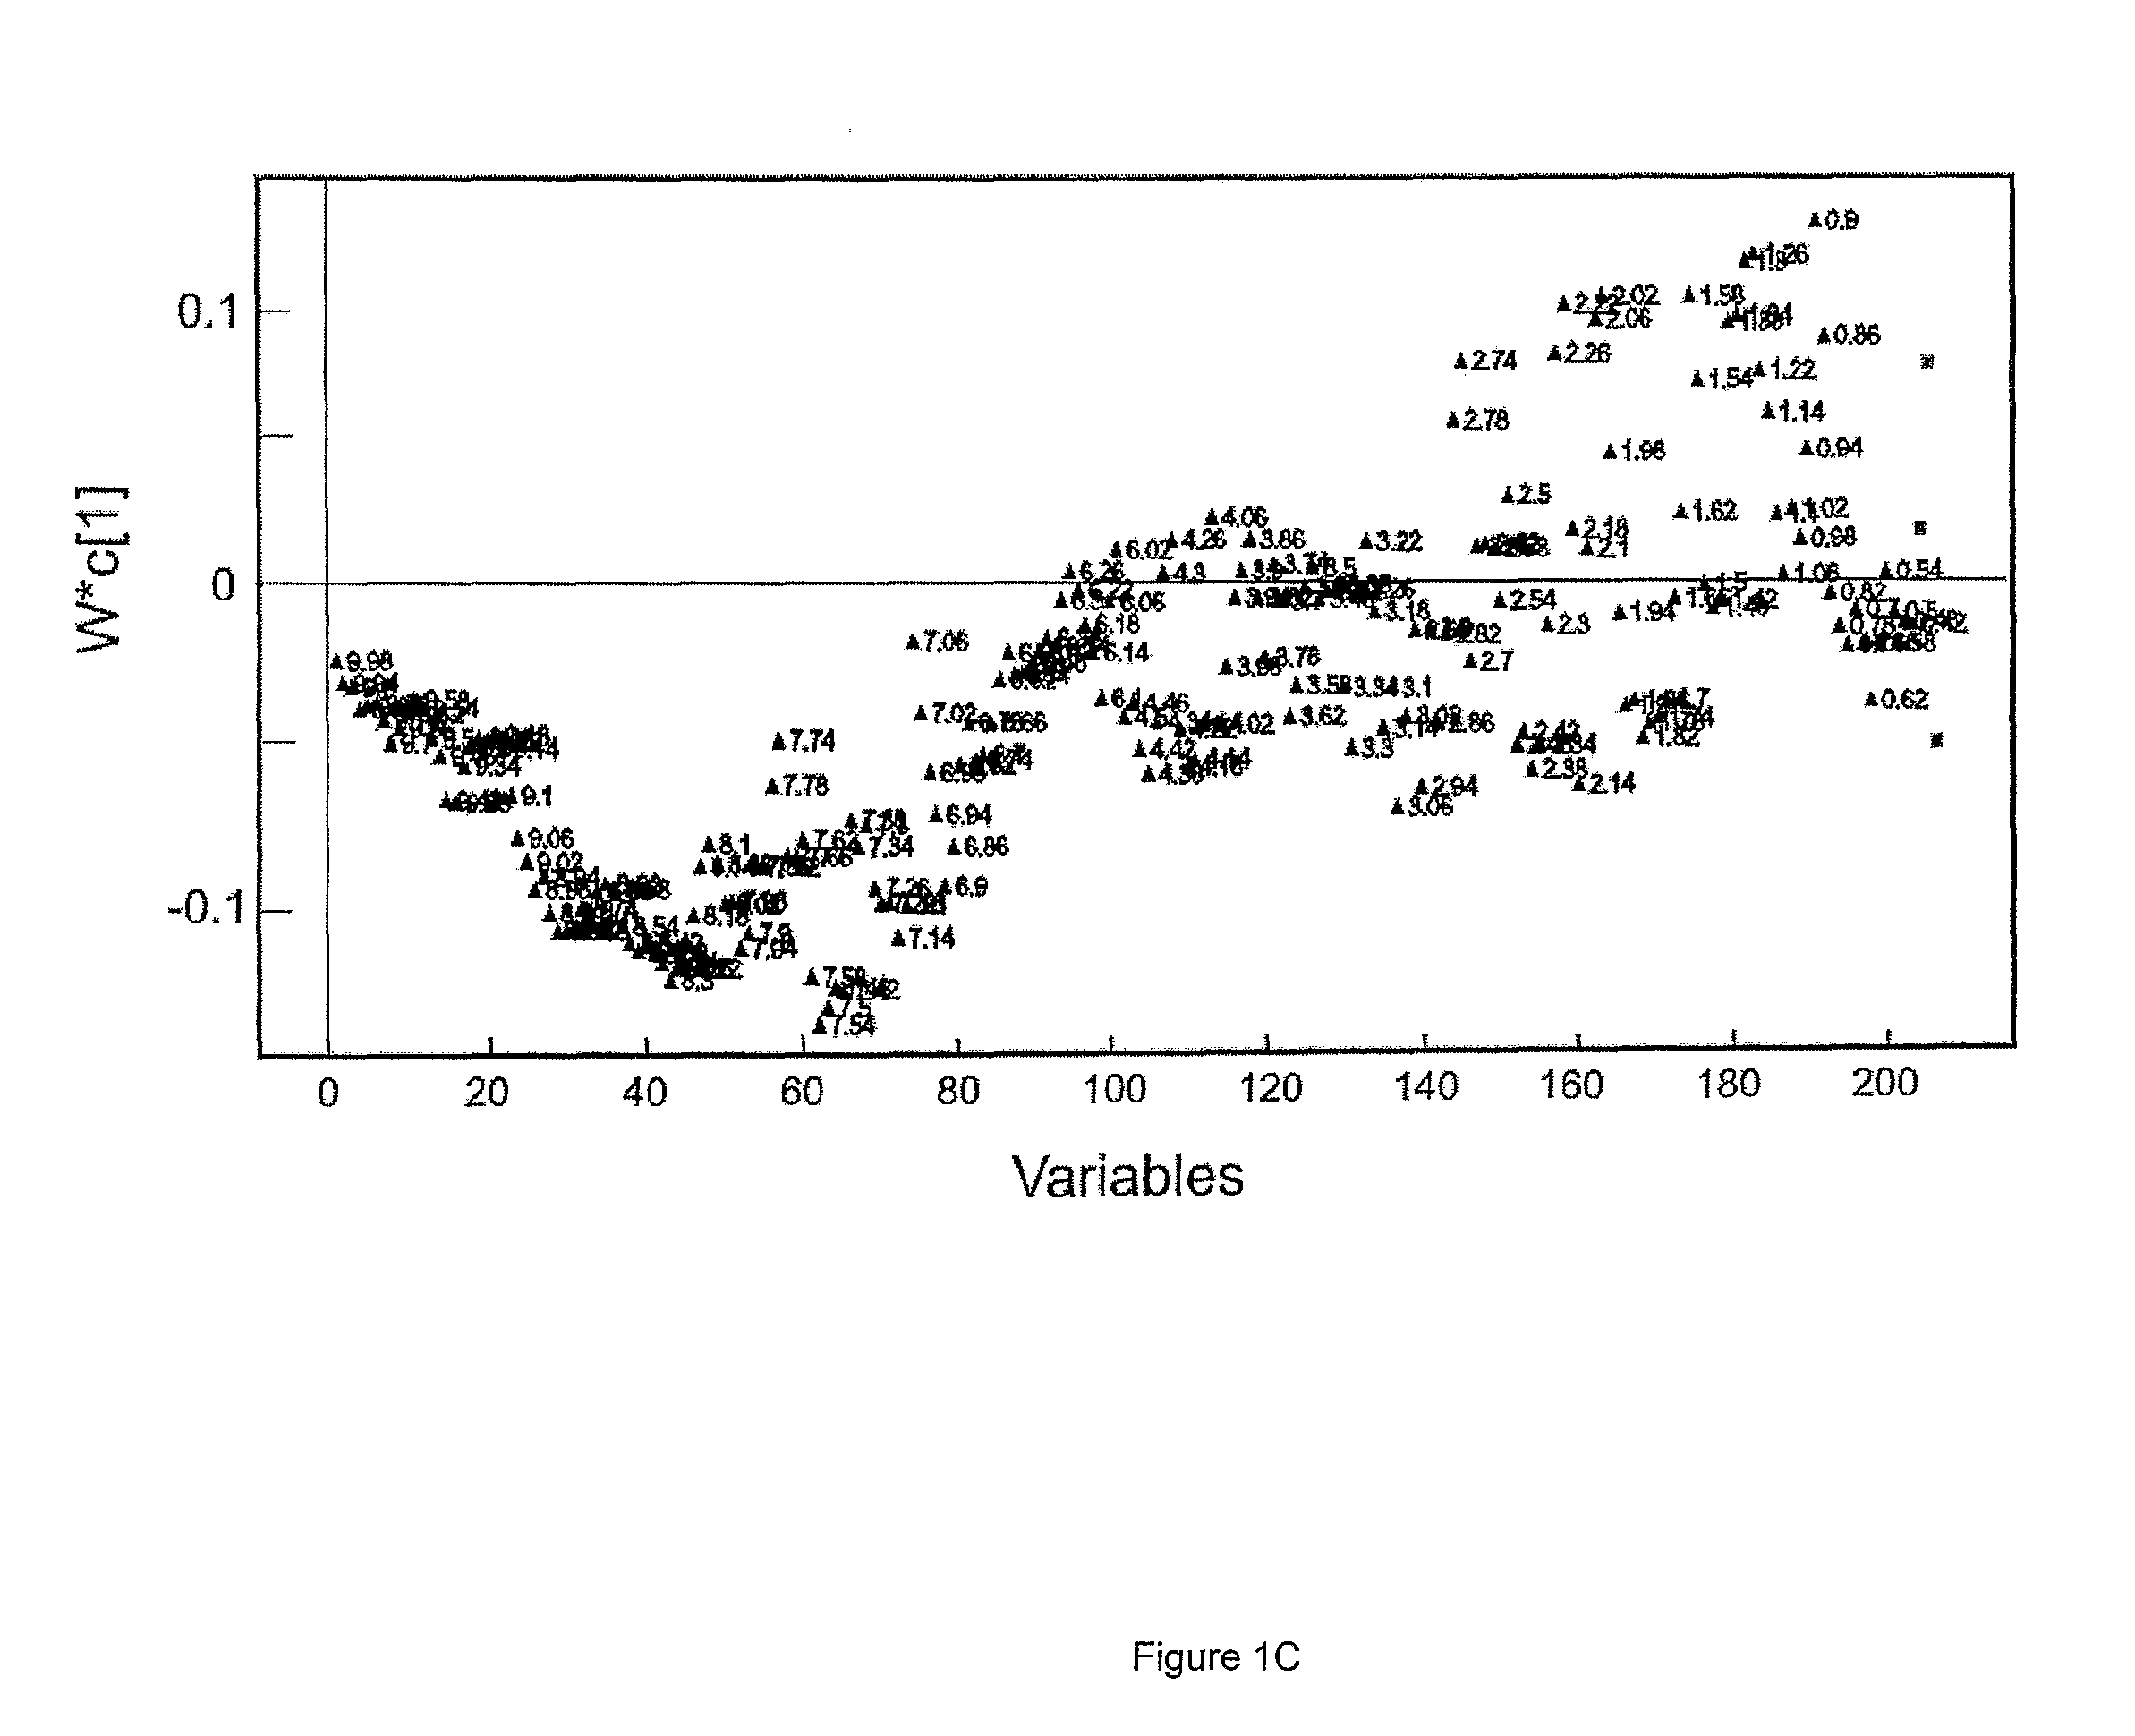
[0236]The present study examined the metabolic plasma profiles of a total of 42 monozygotic twins discordant for schizophrenia and 16 matched control twins using 1H NMR in order to explore the role of genetic and environmental factors contributing to schizophrenia. The result show that signals from VLDL, LDL and aromatic regions are the most important factors differentiating ill and healthy co-twins discordant for schizophrenia from control twins. Interestingly, this differentiation was much more pronounced for female twins.
[0237]Overall, similar metabolic changes were observed in male and female schizophrenia twins, in the female group a potential predisposing disease signature was found in unaffected co-twins. This could imply a greater genetic loading for female twins. A marked sex difference in schizophrenia is a well established fact; female schizophrenia patients have, on average, a later age of onset and better prognosis. This has been attributed to protective effect of oestrogens. Women suffering from acute psychotic episodes have been shown to exhibit lower levels of oestrogen (Huber et al., 2005). Oestrogens are known to have neuroprotective properties and may reduce cell death associated with excitotoxicity as well as oxidative stress.
[0238]In female twins suffering from schizophrenia, alterations were highly associated with disease severity as well as exposure to typical antipsychotics, making it difficult to evaluate the contribution of environmental factors and drug effects. However, several lines of evidence suggest that the effect is not a drug effect: in that similar changes were identified in unaffected co-twins; also, anti-psychotic medication was not found to correlate with Global Functioning Scores in affected male twins.
[0239]One of the most interesting findings in this study is the close association of VLDL/LDL signals and Global Functioning Scores (DSMIV, Axis V) in female subjects. This is apparently the first report showing a strong correlation between a subjectively-derived clinical rating score and an objective biomarker; Thus these biomarkers are useful as an aid in diagnosis and in establishing clinical response.
TABLE 2 Demographic details of monozygotic twins Drug Duration of DSM IV Gender Total Age treatment# illness (yrs) (Axis V) (m/f) Twins discordant for schizophrenia Affected 21 33.0 ± 6.1 26757 ± 27320 12.4 ± 7.0 40.1 ± 13.7& 13/8 Unaffected 21 33.0 ± 6.1 0 0 82.5 ± 5.0&& 13/8 Control twins 16 32.1 ± 7.5 0 0 86.8 ± 4.5 6/10 MALE Twins discordant for schizophrenia Affected 13 32.5 ± 6.2 27430 ± 32607 13.4 ± 6.9 43.4 ± 11.9& Unaffected 13 32.5 ± 6.2 0 0 82.1 ± 4.8&& Control twins 6 38.7 ± 6.7* 0 0 88.7 ± 1.5 FEMALE Twins discordant for schizophrenia Affected 8 33.9 ± 6.4 25662 ± 17537 11.8 ± 7.3 34.8 ± 15.5& Unaffected 8 33.9 ± 6.4 0 0 83.3 ± 5.4 Control twins 10 29.3 ± 6.4 0 0 85.6 ± 5.4 *p = 0.04, control twins vs. discordant twins with schizophrenia, Oneway ANOVA #Fluphenezine equivalent. &p < 0.01, vs. the unaffected and control twins, oneway ANOVA. &&p < 0.05, vs. control twins, Oneway ANOVA.
TABLE 3 Statistical analysis of major chemical shifts that are changed in plasma from female monozygotic twins Chemical shift Assignment& Affected twins Unaffected twins Control twins 0.84-0.88 ppm Lipid (LDL mainly) 2.62 ± 0.12* 2.37 ± 0.12 2.25 ± 0.18 0.88-0.92 ppm Lipid (VLDL mainly) 1.91 ± 0.16* 1.72 ± 0.10 1.61 ± 0.10 1.24-1.28 ppm Lipid (LDL mainly) 3.72 ± 0.62* 2.96 ± 0.23# 2.64 ± 0.28 1.28-1.32 ppm Lipid (VLDL mainly) 3.15 ± 0.98* 2.31 ± 0.36 1.97 ± 0.19 ~7.5 ppm Aromatic groups 0.142 ± 0.009* 0.153 ± 0.007# 0.166 ± 0.008 Data are shown as mean ± S.D. &The assignments of signals are based on a study by Nicholson and Foxall14. *p < 0.05 vs. unaffected twins and control twins; Oneway ANOVA #p < 0.05 vs. control twins; Oneway ANOVA
Example
Example 2
[0240]Extensive protein/peptide profiling analysis of CSF samples from a total of 139 CSF samples (80 controls and 59 first onset, drug-naïve schizophrenia patients) was performed using SELDI mass spectrometry in combination with computerized pattern recognition analysis. Highly significant and reproducible differences were found in samples obtained from first-onset, drug-naïve patients with a diagnosis of paranoid schizophrenia as compared to age-matched controls.
TABLE 4 Demographic details of subjects in the first CSF SELDI experiment Gender Age* (male/female) First-onset, drug-naïve 28.7 ± 9.2 30/11 schizophrenia patients Healthy volunteers 28.3 ± 7.0 24/16 *Data are shown as average ± S.D.
TABLE 5 Demographic details of subjects in the CSF validation sample set Gender Age* (male/female) First-onset, drug-naïve 27.6 ± 7.9 10/8 schizophrenia patients Healthy volunteers 27.3 ± 3.8 20/20 *Data are shown as average ± S.D.
TABLE 6 Demographic details of subjects in the analysis in FIG. 3C (Western blot analysis of post-mortem analysis for transthyretin expression). Gender Fluphenazine mg. Age* (male/female) Equivalents Control subjects 46.2 ± 6.0 4/1 N/A Schizophrenia patients 44.8 ± 8.8 3/2 70,000 ± 70,200 *Data are shown as average ± S.D.
TABLE 7 Sensitivity and specificity of PLS models calculated from the two independent experiments (Healthy volunteers/schizophrenia) Samples Sensitivity1 Specificity2 Initial experiment (40/41) 80% 95% Validation experiment (40/18) 90% 98% 1Sensitivity is defined as the proportion of true positives it detects of all the positives. 2Specificity is defined as the proportion of true negatives it detects of all the negatives.
Clinical Samples
[0241]The Ethical committee of the Medical Faculty of the University of Cologne reviewed and approved the protocol of this study and the procedures for sample collection and analysis. All study participants gave their written informed consent. All clinical investigations were conducted according to the principles expressed in the Declaration of Helsinki. CSF and serum samples were collected from drug-naïve patients diagnosed with first episode paranoid schizophrenia or brief psychotic disorder due to duration of illness (DSM-IV 295.30 or 298.8, n=59) and from demographically matched healthy volunteers (n=80) (Tables 4 and 5). Fresh-frozen prefrontal cortex tissue (Brodmann area 9) from gray matter of 8 schizophrenia and 8 well-matched control individuals was obtained from the Neuropathology Consortium of the Stanley brain collection (Stanley Medical Research Institute, USA).
Preparation of CSF Samples for SELDI Analysis
[0242]5 μl of each CSF sample was applied to the chips with different chemical properties at various pH conditions. The best condition was chosen at pH 9.0 on strong anion exchanger Q10 chip based on number and separation of peaks resolved. Briefly, the array spots were pre-activated twice with binding buffer (100 mM Tris-HCl, pH9.0) at room temperature for 10 min on a shaker (frequency=600 rpm). 50 μl binding buffer composition was added into each protein spot prior to the addition of 5 μl CSF sample. The protein chips were incubated on a shaker for 60 min at room temperature. The chips were washed twice with binding buffer and once with H2O, and then air-dried. The chips were then sequentially treated twice with 0.6 μl of a 100% saturated sinapinic acid (3,5-dimethoxy-4-hydroxycinnamic acid) in 50% acetonitrile and 0.5% trifluoroacetic acid. The chips were analyzed with the Ciphergen ProteinChip Reader (Ciphergen ProteinChip System Series 4000). Each sample was analyzed twice to confirm reproducibility in identifying the differentially expressed proteins.
SELDI-TOF-MS Analysis
[0243]The arrays were analyzed with the Ciphergen ProteinChip System Series 4000 (Ciphergen Biosystems, USA). Mass spectra of proteins were generated by using an average of 254 laser shots at a laser intensity of 1800 arbitrary units. For data acquisition, the detection size range was between 3 and 200 kDa. The laser was focused at 10 kDa. The mass-to-charge ratio (m/z) of each of the proteins captured on the array surface was determined according to externally calibrated standards (Ciphergen Biosystems; USA): bovine insulin (5,733.6 Da), human ubiquitin (8,564.8 Da), bovine cytochrome c(12,230.9 Da), bovine superoxide dismutase (15,591.4 Da), horseradish peroxidase (43,240 Da) and BSA (66,410 Da). The data were analyzed with PROTEINCHIP data analysis software version 3.0 and Ciphergen Express Software 3.0 (Ciphergen Biosystems; USA). The Ciphergen Express Software 3.0 was used to compile all spectra and autodetect quantified mass peaks. Peak labelling was completed by using second-pass peak selection with 0.2% of the mass window, and estimated peaks were added. The peak information of all spectra was exported for further statistic analyses.
Peptide and Protein Identification
[0244]Identification of the schizophrenia specific peptides was performed by a combination of purification step (either on-chip) followed by C18 Zip-Tip purification. Typically, 10 μl CSF samples from each the control and schizophrenia groups were subjected to Q10 protein chips at pH 9.0 (50 mM Tris-HCl). Proteins/peptides bound to the chip were eluted with 5 μl elution buffer (30% acetonitrile, 50 mM sodium acetate pH3.0) by pipetting and was desalted using a C18 Ziptip according to manufacturer's manual. The peptides eluted with 0.1% formic acid/50% aqueous acetonitrile (2 μl) were further examined by MALDI mass spectrometry for confirmation of the peak in CSF samples from schizophrenia patients. The eluted peptides were also loaded into a C18 nano-column linked with ESI-MS/MS (Applied Biosystems, USA) for de novo sequencing.
[0245]For protein biomarkers, CSF proteins were purified from pooled CSF by a combination of anion exchange chromatography (HyperD F; Ciphergen Biosystems; USA) followed by SDS-PAGE. The bands around the matched mass were cut out and the proteins from ⅓ of the excised protein band was eluted passively using previous described method20 to confirm the mass in the spectrum. The rest of the protein band was in-gel digested with trypsin (1:50; Promega, UK) overnight at room temperature. The resulting peptide mixtures were then sequenced using LC-MS/MS (Applied Biosystems, USA).
[0246]S-cysteinylated or S-glutathionylated isoforms (which are isoforms are generated in vivo) of proteins were confirmed by comparing the spectra before and after on-chip reduction using β-mecaptoethanol. In brief, CSF protein and peptide binding was performed as described above and in the final step each spot was washed with 100 ul 1 mM HEPES pH 7.5. The proteins and peptides on the chips were then reduced with 1/40 β-mecaptoethanol (1 μl) for 30 min at room temperature. 1 ml of water was added onto each spot and evaporated. This procedure was repeated twice. Matrix was then added on and data were acquired using ProteinChip Reader (Ciphergen ProteinChip System Series 4000).
Quantitative Analysis of Transthyretin in Human Serum Samples by Enzyme-Linked Immunosorbent Assays (ELISA)
[0247]Samples were defrosted from −80° C. and vortexed for 10 min before experimental work. All samples were assayed blind to the clinical conditions. The identity of all subjects was blind by a code number until all biochemical analyses were completed.
[0248]Transthyretin standard (Sigma, UK), controls and patient-derived human serum samples were diluted 1000 times with phosphate buffered saline, pH 7.4, (Sigma, UK), Transthyretin standard and samples were then loaded onto ELISA Maxisorb plates (Nunc™, Denmark) and incubated for 1 h. All samples were tested in duplicate. After washing with Washing buffer (0.03% Tween 20 in PBS), the plates were blocked with 5% skimmed milk powder for 60 min. 100 μl transthyretin antibody (DakoCytomation, Denmark, 1:500 diluted in 2.5% skimmed milk powder) was incubated in 96-well plates for 60 min. The plates were washed four times with Washing buffer followed by addition of 100 μl secondary antibody (anti-rabbit HPP-linked IgG (Cell Signalling, UK; 1:2000) to each well and incubated for 60 min. After washing with Washing Buffer three times, 100 μl substrate (TMB One solution, Promega) was added into each well and the mixture was incubated at room temperature for 10 min. The plate was read at 450 nm (BIO-RAD, Model 680).
Western Blot Analysis
[0249]The preparation of human brain samples for Western blot analysis and the details of performing Western blotting were as described previously21. In brief, equivalent amounts of protein (30 μg per sample) were resolved electrophoretically on 10% polyacrylamide gels and transferred onto nitrocellulose, which was then incubated with primary antibody (anti-transthyretin, DakoCytomation) in 3% milk-PBS overnight at 4° C., followed by incubation of a secondary antibody (HRP conjugated anti-rabbit secondary antibody (Cell Signaling, 1:2500) at room temperature for 1 hr. Enhanced chemiluminescence (LumiGlu™, Cell Signaling) was used to detect signals from the blot. Consistency of protein loading and transfer was determined by Ponseau S staining.
Statistic Analysis
[0250]Multivariate statistical analysis including principal component analysis (PCA), partial least squares discriminate analysis (PLS-DA) and PLS were employed to summarize the data output from Ciphergen Express. Holdout cross-validation was performed three times so that the sensitivity and specificity of the PLS model could be estimated. In each of the three rounds of holdout cross-validation, one third of the samples were randomly selected to form the validation data and the remaining samples were used as the training data. All multivariate analyses were performed using SIMCA-P+ 10 (Umetrics AB, Sweden). Sensitivity is defined as the proportion of true positives it detects of all the positives and specificity is defined as the proportion of true negatives it detects of all of the negatives. Where appropriate, t test was performed using the Statistical Package for Social Scientists (SPSS/PC+; SPSS, Chicago).
Alterations of CSF Protein/Peptide Profiles in First-Onset, Drug-Naïve, Paranoid Schizophrenia Patients
[0251]In a first set of experiments protein/peptide profiles of CSF samples from 41 first-onset, drug-naïve, paranoid schizophrenia patients and 40 demographically matched healthy volunteers were examined using SELDI mass spectrometry. CSF proteins and peptides were profiled using Q10 (strong anion exchanger) chips at pH 9.0. An example of the CSF protein/peptide profile of a healthy volunteer is shown in FIG. 5A. Approximately 75 peaks can be readily detected with a signal to noise ratio >5 under this Q10 protein chip binding condition. Plots of PLS-DA scores based on SELDI spectra of CSF samples showed a clear differentiation between healthy volunteers and drug-naïve patients with first onset, paranoid schizophrenia (FIGS. 5B and C). Similar results were found using principle component analysis (data not shown). The loading plot showed significant reductions in clusters of peaks between 13,600-14,000Da. The sensitivity and specificity of this model based on holdout cross validation was 80% and 95%, respectively (Table 7).
Identification of the 13.6-14 kDa Protein Cluster as Transthyretin
[0252]The protein cluster between 13.6-14.1 kDa contained four peaks (FIG. 6B), three of which were consistently down-regulated in CSF from first onset, drug-naïve schizophrenia patients (p<0.01; FIG. 6B, bottom panel). Studies have suggested that these peaks may be from S-cysteinylated or S-glutathionylated derivatives of transthyretin protein22,23, a thyroid hormone-binding protein that transports thyroxine from the bloodstream to the brain. On-chip reduction of CSF peptide/protein performed using β-mercaptoethanol at room temperature showed that the three peaks 13,741, 13,875, and 13,923Da were reduced to a single peak (FIG. 6C), confirming they were derived from the same protein. To identify the protein, a pair of CSF samples from a healthy volunteer and a schizophrenia patient were applied to an anion exchanger column (HyperD) and eluted with pH 9-pH 3 buffers. A major band ˜13-15 kD was eluted in the pH3 fraction (FIG. 6D, left panel). The band was confirmed to be the peak cluster around 13.6-14 kDa in the SELDI spectrum by eluting the protein from the band and running on a NP20 chip to match the mass (FIG. 66E). This protein was then digested with trypsin and sequenced using LC-MS/MS. The protein was identified as transthyretin (FIG. 6D, right panel).
Down-Regulation of Transthyretin in Serum Samples from the Same Subjects as Well as Prefrontal Cortex Tissue from Schizophrenia Patients
[0253]It has been estimated that 3% of transthyretin in the ventricular CSF and 10% of the transthyretin in lumbar CSF are derived from blood. To evaluate the contribution of blood transthyretin to the changes found in CSF in schizophrenia, serum transthyretin levels taken from the same individuals (at the same time when CSF was collected) who had been studied in FIGS. 5 and 8 (for demographics, see Tables 4 and 5) were investigated using ELISA. A moderate but significant decrease of transthyretin in sera was found from schizophrenia patients compared to controls (15% decrease, p=0.0007, t test) (FIG. 7A). However, no correlation between CSF and serum transthyretin levels from the same individuals was found, suggesting that transthyretin levels are regulated independently in CSF and serum (FIG. 7B). Transthyretin levels were decreased in both CSF and serum samples. However, there is no correlation of CSF transthyretin levels and serum transthyretin level.
[0254]Interestingly, a ˜40% down-regulation of transthyretin in post-mortem prefrontal cortex from schizophrenia patients as compared to controls using Western blot was found (FIG. 7C).
Validation of Protein/Peptide Biomarkers in an Independent Sample Set
[0255]The biomarker model in FIG. 5 was validated using an independent sample set consisting of a further 18 first-onset, drug-naïve schizophrenia patients and 40 demographically matched healthy volunteers. These samples were run using identical conditions as in the previously described experiment. PLS-DA scores and loadings plots showed a very similar result as found in FIG. 5 with in the cluster of 13,600-14,000 proteins (FIG. 8). This suggests that these identified alterations in CSF proteins and peptides are a consistent finding and thus may reflect genuinely the early pathophysiology of schizophrenia. The sensitivity and specificity of this model was 95% and 98%, respectively (Table 7).
Discussion of Example 2
[0256]Initial analysis of SELDI spectra of a total of 81 CSF samples (41 schizophrenia; 40 controls) showed a differential distribution of samples from drug-naïve patients with first onset paranoid schizophrenia away from healthy volunteer samples (FIGS. 5B, 5C and 5D). The protein/peptide profile of CSF was found to be characteristically altered in paranoid schizophrenia patients and a key alteration was the down-regulation of transthyretin around 14 kDa. These schizophrenia specific protein/peptide changes were replicated/validated in an independent sample set (n=58) using identical conditions (FIG. 8). Both experiments achieved an astonishingly high specificity (rate of true negative) of 95/98% and a sensitivity of 80/90%, respectively (Table 7). This means that virtually no control samples clustered with the schizophrenia group (FIGS. 5B and 5C). For a high diagnostic validity and consequent therapeutic interventions an accurate identification of those individuals who truly have the disease is most critical.
[0257]A moderate but consistent decrease of transthyretin was observed in CSF from first onset schizophrenia patients. ELISA results on the serum samples collected from the identical individuals whose CSF samples were investigated in this study showed that there is a ˜15% decrease in transthyretin levels in serum (p=0.0007, t test; FIG. 7A), however, there was no correlation between the levels of serum transthyretin and SELDI signals from CSF transthyretin, suggesting that liver derived transthyretin may not contribute to the down-regulation in CSF (FIG. 7B). Experiments perfusing isolated sheep brains showed that all newly synthesized transthyretin was secreted from the choroid plexus towards the ventricles. The synthesis of this protein is required for the transport of thyroxine16. Thus, the decreased level of transthyretin in CSF suggests a lowered thyroxine transport in brains of schizophrenia patients. Indeed, the results found in this study showing a down-regulation in transthyretin protein in post-mortem brain tissue from schizophrenia patients (FIG. 7C) further support this notion. It is noteworthy that thyroid dysfunction is relatively common in patients with schizophrenia24,25 and indeed other psychiatric disorders26, possibly genetically linked to the disorders. In addition, in patients with severe forms of both hypo- and hyper-thyroidism, psychotic symptoms may occur and the clinical picture frequently resembles that of schizophrenia27, which may imply that an increase in CNS thyroxine function may be linked. Interestingly, long-term administration of clozapine has been shown to induce transthyretin expression in rat hippocampus and cerebral cortex18, implying that clozapine enhances CNS thyroxine function in light of the results herein, supporting the clinical relevance of transthyretin in the early pathophysiology of schizophrenia.
[0258]The application of SELDI mass spectrometry can provide an efficient means for early diagnosis of paranoid schizophrenia.
Example
Example 3
Clinical Samples
[0259]The protocols of this study including procedures for sample collection and analysis were approved by ethical committees. Informed consent was given in writing by all participants and clinical investigations were conducted according to the principles expressed in the Declaration of Helsinki. CSF and serum samples were collected from drug-naïve patients diagnosed with first episode paranoid schizophrenia or brief psychotic disorder due to duration of illness (DSM-IV 295.30 or 298.8; n=41 for CSF; n=35 for serum; Table 8) and from demographically matched healthy volunteers (n=40 for CSF; n=63 for serum; Table 8).
[0260]For post-mortem studies, fresh-frozen prefrontal cortex tissue (Brodmann area 9; 8 schizophrenia and 8 well matched control individuals) and liver samples (15 schizophrenia and 15 well matched controls) were obtained. The demographic details are listed in Table 8.
[0261]For red blood cell (RBC) experiments, a total of 40 blood samples (7 first-onset, drug-naïve schizophrenia patients and 13 schizophrenia patients treated with atypical antipsychotic medication as well as 20 demographically-matched healthy volunteers, see Table 8 for demographic details) were collected from two centres using an identical sample collection procedure.
TABLE 8 Demographic details of schizophrenia and control subjects Schizophrenia Control CSF Sample size n = 41 n = 40 Age 28.7 ± 9.2 28.3 ± 7.0 Gender (M/F) 30/11 24/16 Liver Sample size n = 15 n = 15 Age 44.7 ± 6.2 42.5 ± 6.9 Gender (M/F) 9/6 9/6 Fluphenazine mg Equivalents 93,460 ± 88,322 N/A RBC Sample size n = 20 n = 20 Age 34.5 ± 9.2 38.8 ± 11.0 Gender (M/F) 17/3 15/5 Serum Sample size n = 35 n = 63 Age 28.0 ± 8.8 27.6 ± 5.7 Gender (M/F) 21/14 33/30 Brain Sample size n = 8 n = 8 Age 43.0 ± 6.5 47.8 ± 7.1 Gender (M/F) 5/3 6/2 Fluphenazine mg Equivalents 95,575 ± 97,069 N/A
Preparation of RBC Samples
[0262]Blood samples were collected in anticoagulant EDTA tubes prior to cell isolation and protein extraction (see below). To purify RBCs, 40 ml of freshly drawn blood was diluted with 40 ml of PBS. The diluted blood was gently layered on half volume of a density gradient separation medium (HISTOPAQUE®-1077, Sigma) and centrifuged at 750×g for 10 min. Isolated RBC were then collected from the bottom of the tube and frozen at −80° C. RBC were lysed with erythrocyte lysis buffer (Qiagen, UK) in 1:5 ratios at 4° C. for 15 minutes. Proteins were extracted by precipitation using 100 mM ammonium acetate in methanol overnight at −20° C. and resuspended in ASB14 buffer (8 M urea, 2% ASB14, 5 mM magnesium acetate, 20 mM Tris-HCl, 1% Triton-X100, pH 8) containing complete protease inhibitor cocktail (Roche, Switzerland) and phosphatase inhibitors (1 mM sodium pyrophosphate, 1 mM sodium orthovanadate, 10 mM β-glycerophosphate, and 50 mM sodium fluoride). Protein concentration was determined using a detergent-compatible protein assay kit (BioRes). The highly abundant protein, haemoglobin, was first pre-fractionated from the RBC proteome using a ZOOM® IEF Fractionator (Invitrogen). This is a simple and convenient method to reproducibly fractionate cell lysate on the basis of isoelectric point (pI) using solution phase isoelectric focussing (IEF). Fractionated proteins with a pI between 6.2 and 10, containing Hb were discarded. The remaining fractions from each individual patient/control (pI 3-6.2) were pooled and proteins were re-extracted by ammonium acetate precipitation and subjected to 2D-DIGE analysis.
2D-DIGE Analysis
[0263] 2D-DIGE analyses of liver samples were performed using 24 cm, pH4-7, IDG DryStrips. The detail procedures are as described previously (18).
CSF Protein Profiling Using SELDI-TOF Analysis and Protein Biomarker Identification
[0264]5 μl samples of each CSF was applied to protein chips with different chemical properties at various pH conditions. The best condition was chosen at pH 9.0 on strong anion exchanger Q10 chip, based on number and separation of peaks resolved. Briefly, the array spots were pre-activated twice with binding buffer (100 mM Tris-HCl, pH 9.0) at room temperature for 10 minutes on a shaker (frequency=600 rpm). 50 μl binding buffer was added into each spot prior to the addition of the 5 μl CSF sample. The protein chips were incubated on a shaker for 60 min at room temperature, then washed twice with binding buffer, once with H2O, and air-dried. The chips were then sequentially treated twice with 0.6 μl of a 100% saturated sinapinic acid (3,5-dimethoxy-4-hydroxycinnamic acid) in 50% acetonitrile and 0.5% trifluoroacetic acid. The chips were analyzed using the Ciphergen ProteinChip Reader (Ciphergen ProteinChip System Series 4000). Each sample was analyzed twice to confirm reproducibility in identifying the differentially expressed proteins. Mass spectra of proteins/peptides were generated by using an average of 254 laser shots at a laser intensity of 1800 arbitrary units. For data acquisition, the detection size range was between 3 and 200 kDa. The laser was focused at 10 kDa. The mass-to-charge ratio (m/z) of each of the proteins captured on the array surface was determined relative to external calibration standards (Ciphergen Biosystems; USA): bovine insulin (5,733.6 Da), human ubiquitin (8,564.8 Da), bovine cytochrome c (12,230.9 Da), bovine superoxide dismutase (15,591.4 Da), horseradish peroxidase (43,240 Da) and BSA (66,410 Da). The data were analyzed with PROTEINCHIP data analysis software version 3.0 and using Ciphergen Express Software 3.0 (Ciphergen Biosystems; USA). The Ciphergen Express Software 3.0 was used to compile all spectra and autodetect quantified mass peaks. Peak labelling was completed by using second-pass peak selection with 0.2% of the mass window, and estimated peaks-were added. The statistic analyses of peak information were performed using Ciphergen Express Software 3.0.
[0265]For identification of protein biomarkers, CSF proteins were purified from pooled CSF by a combination of anion exchange chromatography (HyperD F; Ciphergen Biosystems; USA) followed by SDS-PAGE. The band expected correspond to the SELDI peak was cut from the gel and the gel band was in-gel digested with trypsin (1:50; Promega, UK) overnight at room temperature. The resulting peptide mixtures were then analyzed by LC-ESI-MS/MS (QSTAR, Applied Biosystems, USA), and the protein identified by database searching using Mascot software (Matrix Science, London). To confirm the gel band is the protein of interest, an antibody capture experiment was performed. Briefly, 2 μl of antibody (0.2 mg/ml) was coupled to RS100 reactive chip surface, followed by blocking with 2M Tris-HCl (pH8.0) at room temperature according to the manufacturer's protocol. 5 μl CSF samples were then applied directly to spots with or without antibody coupling and incubated for 1 hr. After washing 5 times with 10 μl HEPES buffer (50 mM, pH7.2), the chips were analyzed with Ciphergen ProteinChip System Series 4000.
Western Blot Analysis
[0266]Western blot analysis of brain tissues has been described previously (32). Briefly, after determining the protein concentration, samples were diluted in sample buffer (Invitrogen), to a final concentration of 4 mg/ml. 30 μg of protein was loaded into each well and separated on 4%-12% SDS pre-cast-gel (Invitrogen) alongside ApoA1 standard (Sigma) as a positive control. Separated proteins were transferred onto nitrocellulose membranes at room temperature. The nitrocellulose membranes were incubated with blocking solution (5% dried skimmed milk) for 60 minutes at room temperature followed by incubation with anti-human ApoA1 polyclonal antibody (1:1000) (CalBiochem) overnight at 4° C. Membranes were washed four times with wash buffer and then incubated with horseradish peroxidase-conjugated secondary antibody (Cell Signalling, 1:5000) at room temperature for 1 hr. Chemiluminescent visualization (GE Heathcare) was used to visualize the signals.
ELISA
[0267]Serum samples were randomized and the identity of all subjects was blinded by a code number until all biochemical analyses were completed. ApoA1 standard (Sigma, UK) alongside human serum samples from patients and control subjects were diluted 1:1000 with phosphate buffered saline, pH 7.4 (PBS, Sigma, UK). ApoA1 standard and samples were then loaded onto ELISA Maxisorb plates (Nunc™, Denmark) and incubated for 1 hr. After washing with washing buffer (0.03% Tween 20 in PBS), the plates were blocked with 5% dried skimmed milk powder in PBS for 60 minutes. 100 μl ApoA1 primary antibody (rabbit) (CalBiochem, UK; 1:1000) was incubated in 96-well plates for 60 minutes. The plates were washed four times with wash buffer followed by the addition of 100 μl anti-rabbit secondary antibody (Cell Signalling, UK; 1:2000) to each well, and incubated for 60 minutes. All incubations were carried out on a shaker (600 rpm) at room temperature. Finally, after washing four times with wash buffer, 100 μl substrate (TMB One solution, Promega) was then added to each well and incubated at room temperature for 10 minutes. The plates were read with a plate reader (BIO-RAD, Model 680) at 450 nm. Statistical analysis of serum samples was performed by t-test using the Statistical Package for Social Scientists (SPSS/PC+; SPSS, Chicago). All measurements were replicated in an independent experiment.
TABLE 9 Summary of ApoA1 expressions in CSF, post-mortem brain, liver tissues, RBC and sera in schizophrenia patients and control subjects Sample size Tissue/body fluid Technique (patient/control) Result* CSF SELDI-TOF 41/40 −35%; p = 0.00001 Liver 2D-DIGE 15/15 −30%; p = 0.017 RBC 2D-DIGE 20/20 −60%; p = 0.0034 Serum ELISA 35/63 −18%; p = 0.00039 Brain Western Blot 8/8 −32%; p = 0.07 *p value is derived from student t test.
PUM


Description & Claims & Application Information
We can also present the details of the Description, Claims and Application information to help users get a comprehensive understanding of the technical details of the patent, such as background art, summary of invention, brief description of drawings, description of embodiments, and other original content. On the other hand, users can also determine the specific scope of protection of the technology through the list of claims; as well as understand the changes in the life cycle of the technology with the presentation of the patent timeline. Login to view more.
Similar technology patents
Compounds and compositions for targeting brain injuries and methods of use thereof
ActiveUS20180296696A1improve outcome
Owner:SANFORD BURNHAM PREBYS MEDICAL DISCOVERY INST
Apparatus for generating and transmitting annotated video sequences in response to manual and image input devices
InactiveUS20200365258A1improve outcome
Owner:LANGER DAVID J +2
Novel benzodiazepinones as modulators of metabotropic glutamate receptor functions and neurological uses thereof
ActiveUS20150025064A1enhance activityimprove outcome
Owner:SANFORD BURNHAM MEDICAL RES INST
Analysis of methylated DNA comprising methylation-sensitive or methylation-dependent restrictions
PendingUS20220154285A1improve outcome
Owner:GUARDANT HEALTH
Classification and recommendation of technical efficacy words
- improve outcome
Systems and methods for guiding cuts to a femur and tibia during a knee arthroplasty
ActiveUS20090043309A1faster assemblyimprove outcome
Owner:RASMUSSEN INSTR LLC
Method And Means For Data Searching And Language Translation
PendingUS20120143858A1improve outcomegood search result
Owner:VAANANEN MIKKO
Metabolic Biomarkers Of Drug-Induced Cardiotoxicity
InactiveUS20110081675A1improve outcome
Owner:WISCONSIN ALUMNI RES FOUND +1
Apparatus for generating and transmitting annotated video sequences in response to manual and image input devices
InactiveUS20200365258A1improve outcome
Owner:LANGER DAVID J +2