Lung cancer detection by optical analysis of body fluids

Inactive Publication Date: 2010-03-25
KING SAUD UNIVERSITY
View PDF17 Cites 10 Cited by
  • Summary
  • Abstract
  • Description
  • Claims
  • Application Information

AI Technical Summary

Benefits of technology

[0014]These and other features of the present invention will become readil

Problems solved by technology

Cancer is often a fatal disease.
Others, such as biopsy, endoscopy, bone marrow, and cytoscopy, are invasive tests that often result in considerable discomfort to the patient.
Still others, such as CAT scans and MRI scans, are quite expensive and require complex instrumentation.
In particular, cancer of the lung has a very low su

Method used


Image

  • Lung cancer detection by optical analysis of body fluids
  • Lung cancer detection by optical analysis of body fluids
  • Lung cancer detection by optical analysis of body fluids

Examples


example 1

[0042]A disposable syringe is used to uptake 5 ml of venous blood from the subject. The blood is placed in a sterile vial containing ethylenediaminetetraacetic acid (EDTA) anticoagulant. The blood is centrifuged at 4000 rpm for 15 minutes, and the supernatant plasma is separated out and collected in a sterile vial. The formed elements containing mostly cells, such as erythrocytes, are treated with acetone in the ratio of 1:2 (i.e., to 1 ml of formed elements, 2 ml of acetone). The sample is vigorously shaken 100 times and then centrifuged at 4000 rpm for 15 minutes.

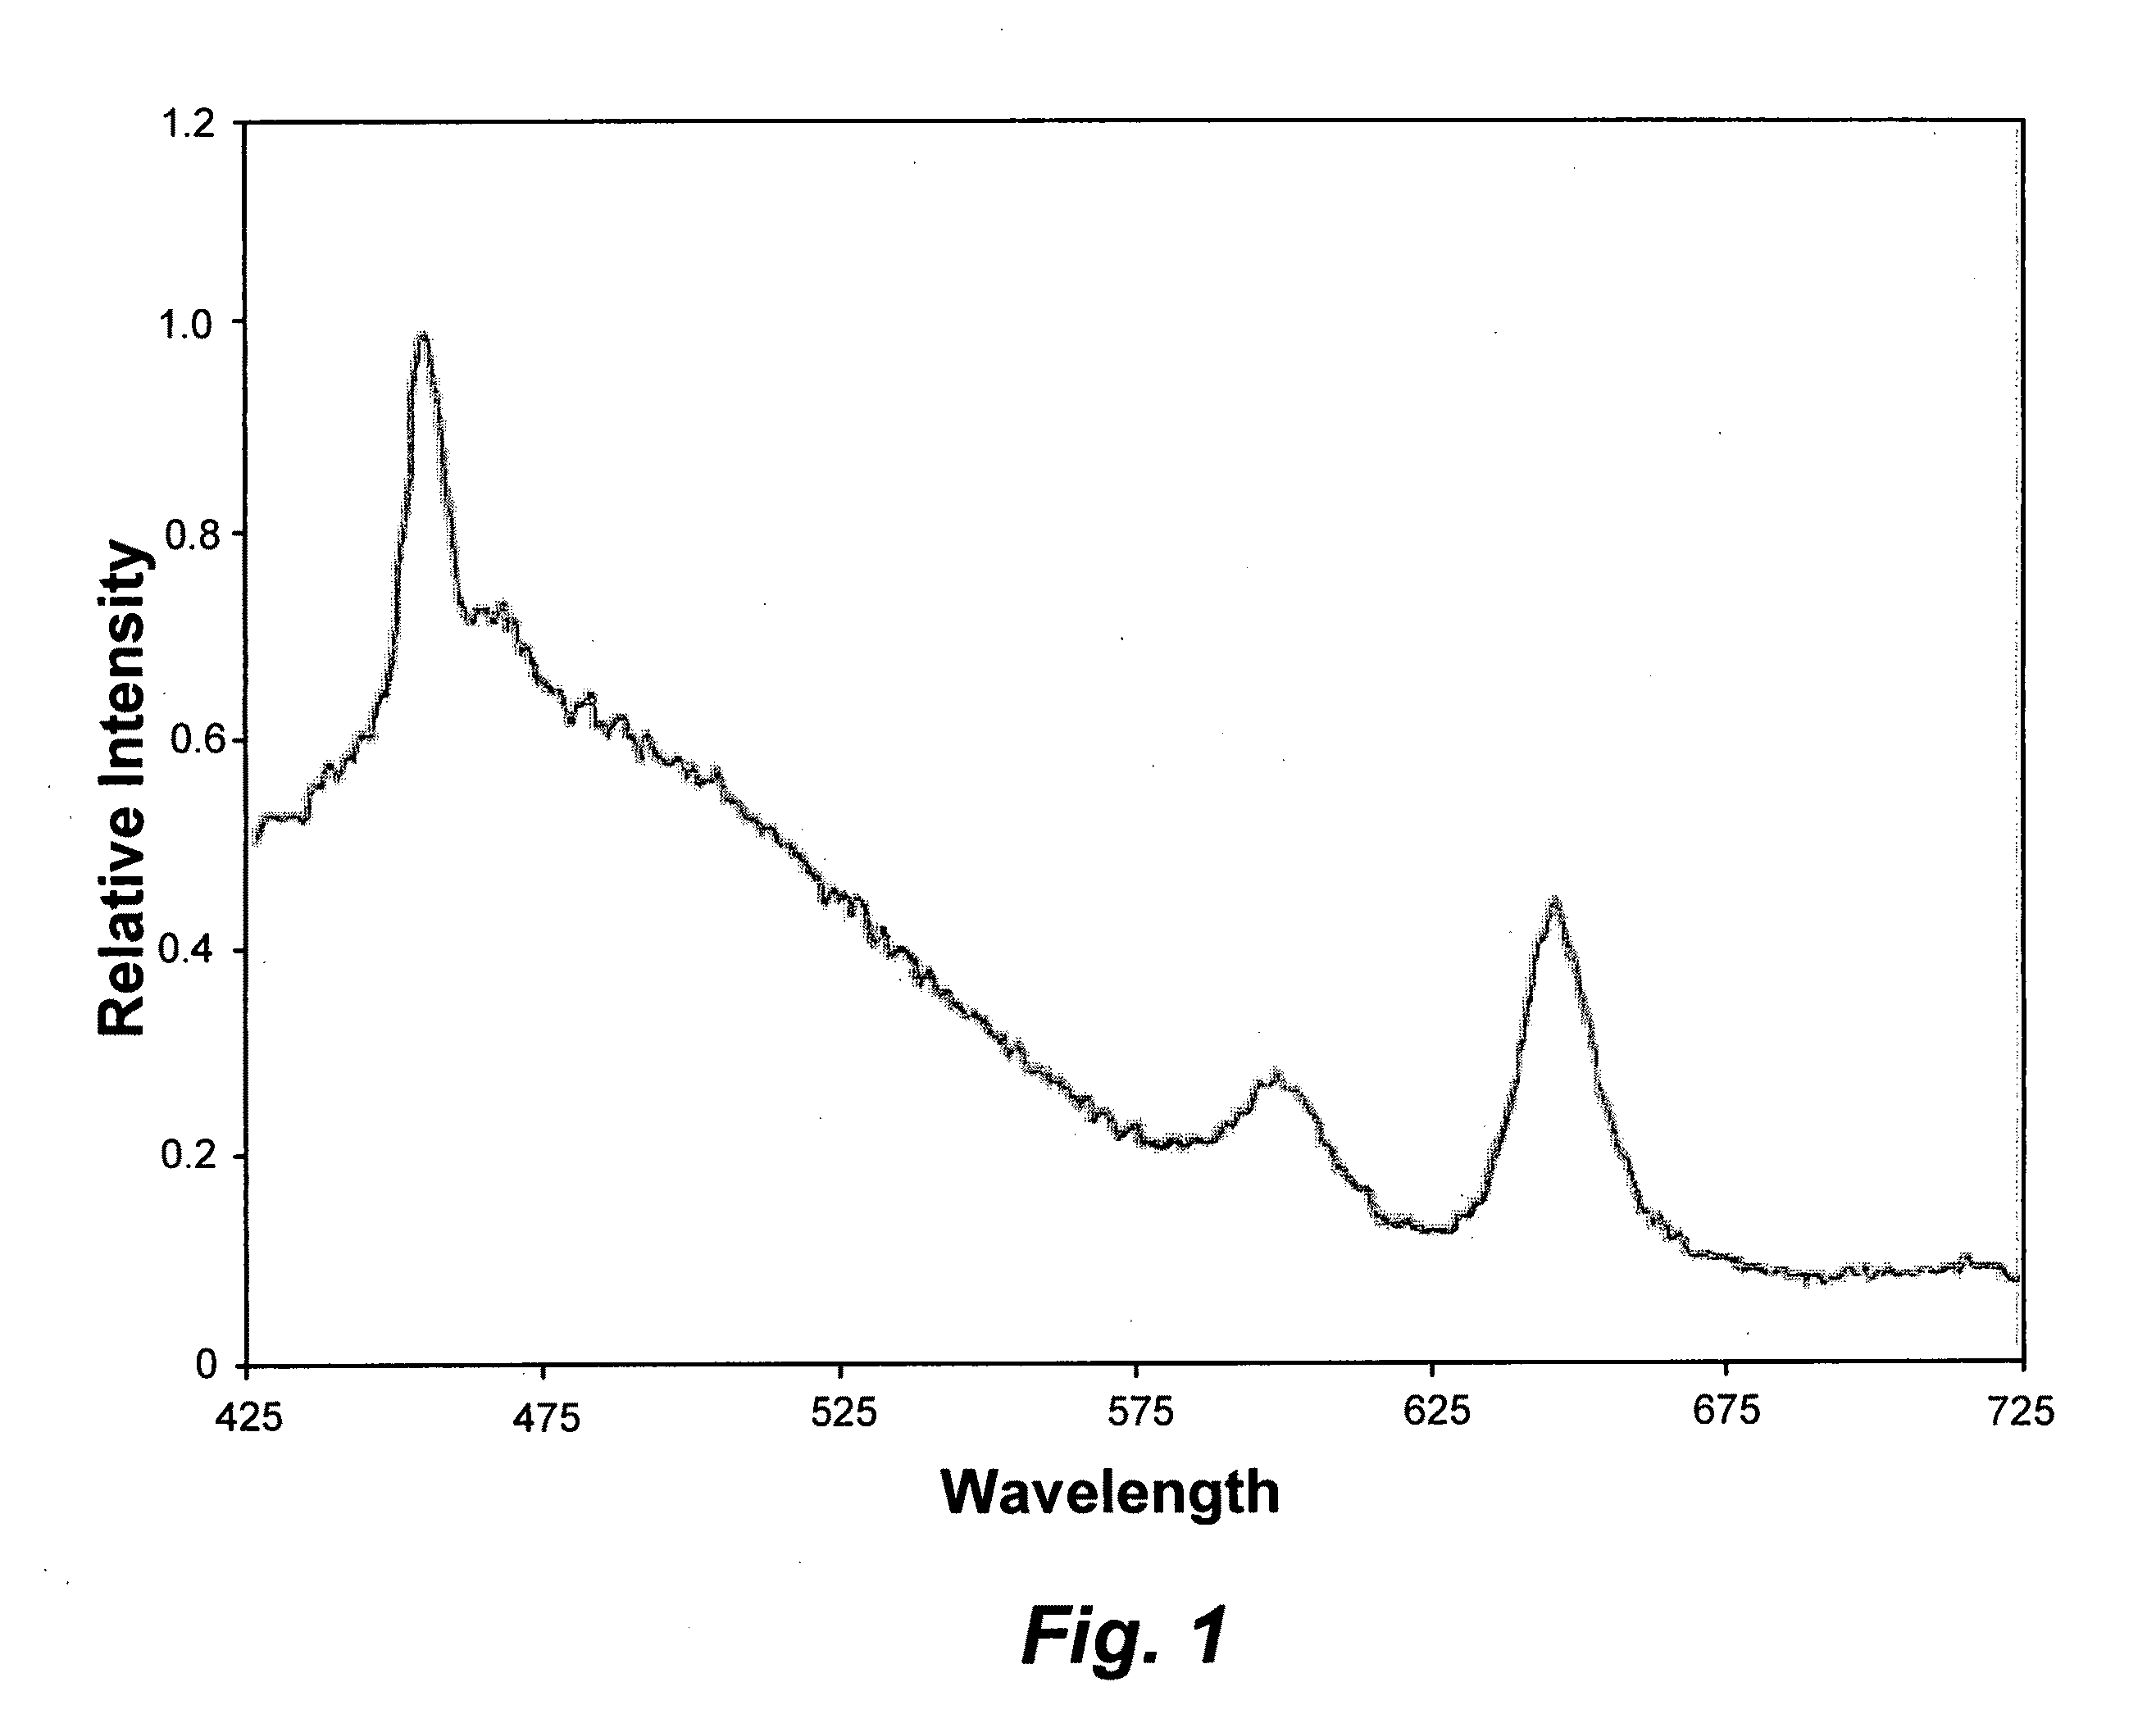
[0043]The supernatant thus obtained is a clear solution containing the bio-molecules that are tumor markers. It is subjected to the optical analysis as described before. The wavelength of excitation is fixed at 400 nm by adjusting the interference filter or grating, and the fluorescence emission spectrum is obtained in the range of 425 to 720 nm.

[0044]A typical result is shown in FIG. 1 for a sample from a healthy individ...

example 2

[0054]Urine samples are prepared for analysis as follows. The subject is required to give the first voided urine in a sterile vial after 48 hours of strict abstinence from non-essential medicines (including herbal and ayurvedic), spicy meals, and meats. 2 ml of urine is dropped in a quartz cuvette. The excitation wavelength is set at 400 nm, and the fluorescence spectrum from 425 to 700 nm is obtained. Exemplary spectra for a healthy individual and a lung cancer patient are shown in FIG. 4. Among the many bands, we ignore all except the 470, 520, 550, and 620 nm bands, which are consistent. A set of cancer-defining ratio parameters is given in Table II.

TABLE IIRatio Parameters R7 through R9PreAdvancedRatioMalignancyEarly Cancerstage LungParameterNormalof lungof lungCancerR6 = (I520 / I470)1.2-1.41.4-1.6>1.6R7 = (I620 / I470)0.3-0.50.5-0.8>0.8R8 = (I550 / I470)0.6-0.80.8-1.0>1.0

[0055]It will be noted that the FES peak shifts from 500 nm to 535 nm as the disease progress from pre-malignant ...

example 3

[0056]Fluorescence excitation spectra of the samples were obtained where the emission grating is fixed and the excitation grating is rotated to obtain the excitation spectra, which is similar to, but not identical to, the absorption spectra. With suitable modifications in the system, one can get Synchronous Spectra (SS). Here, the excitation grating and emission grating are set at a wavelength difference of 70 nm or 30 nm, as required for the specific analysis. That is, when one grating is at 200 nm, the other is set at 270 nm, with the offset wavelength difference being 70 nm. Then, both gratings are synchronously scanned. The fluorescence obtained with the excitation of 200 nm is collected from 270 nm onwards. Then the excitation grating moves to 210 and synchronously the emission grating moves to 280 and collects fluorescence; this kind of synchronous scanning can go on up to 600 nm.

[0057]This is a compounded spectrum of fluorescence emission and excitation bands of many molecule...


PUM


Abstract

The method for lung cancer detection by optical analysis of body fluids relates to analyzing samples of blood, urine and sputum by fluorescence spectroscopy in order to detect the presence of naturally occurring molecules in the fluids that serve as biomarkers indicative of cancer in the human body. The analysis can be carried out based on fluorescence emission spectra, fluorescence excitation spectra and synchronous (emission and excitation) spectra of bio-samples. The early detection and diagnosis of lung cancer may be made by comparison of ratios of fluorescence emissions and/or excitation intensities of tryptophan, tyrosine, elastin, collagen, bile pigments, NADPH, flavins and various species of porphyrins.

Description

CROSS-REFERENCE TO RELATED APPLICATIONS[0001]This application is a continuation-in-part of U.S. patent application Ser. No. 12 / 458,489, filed Jul. 14, 2009, which claims priority to U.S. provisional patent application Ser. No. 61 / 129,728, filed Jul. 15, 2008. This application is also a continuation-in-part of U.S. patent application Ser. No. 12 / 285,670, filed Oct. 10, 2008, which is a continuation-in-part of U.S. patent application Ser. No. 12 / 000,233, filed Dec. 11, 2007, the contents of which are hereby incorporated by reference in their entirety and which is a continuation-in-part of U.S. patent application Ser. No. 11 / 017,913, filed Dec. 22, 2004, now abandoned, which claims priority to U.S. provisional patent application 60 / 531,987, filed Dec. 24, 2003. This application also claims priority to India patent application number 587 / CHE / 2003, filed Jul. 22, 2003 and issued as India patent number 209084 on Aug. 20, 2007.BACKGROUND OF THE INVENTION[0002]1. Field of the Invention[0003...

Claims


Application Information

Patent Timeline
IPC IPC(8): C12Q1/02G01N21/64
CPCG01N33/57423G01N2800/56G01N2800/50
Inventor MASILAMANI, VADIVELELANGOVAN, MASILAMANIALSALHI, MOHAMADAL-DIAB, ABDULRAHMAN
Owner KING SAUD UNIVERSITY
Why Eureka
Try Eureka