Methods for measuring microbiological content in aqueous media

a technology of microorganisms and aqueous media, applied in the field of fluorescence-based assays, can solve the problems of health risks, affecting the operation cost of the system, shortcomings and defects of both, and achieves the effects of low cost, high degree of sensitivity, and convenient us

Inactive Publication Date: 2010-05-06
GENERAL ELECTRIC CO
View PDF49 Cites 2 Cited by
  • Summary
  • Abstract
  • Description
  • Claims
  • Application Information

AI Technical Summary

Benefits of technology

[0007]The various embodiments provide improved methods for measuring total microbiological content in aqueous media, which are easy to use, inexpensive and accurate with a high degree of sensitivity and can be completed in a short period of time.

Problems solved by technology

The presence of microbial activity in public water systems can cause health risks.
Furthermore, detection and control of microorganisms in industrial systems is critical to various businesses, because the presence of such organisms contributes significantly to system corrosion, deposition and fouling and directly impacts the operation costs of the systems.
Both of these methods quantify microbial population; however, there are intrinsic shortcomings and defects affiliated with both of these methods.
The culture-based method requires lengthy incubation time and often underestimates the microbial numbers due to the composition of the incubation medium.
The biochemluminescence method is fast, but has poor accuracy and false positive and false negative results are frequently obtained.
In addition to the fouling, corrosion problems and health concerns noted above, biofilms can reduce heat transfer and hydraulic pressure in industrial cooling water systems, plug water injection jets and clog water filters, and result in microbial influenced corrosion.

Method used


Image

  • Methods for measuring microbiological content in aqueous media
  • Methods for measuring microbiological content in aqueous media
  • Methods for measuring microbiological content in aqueous media

Examples


example 1

Calibration Curve in Phosphate Buffer Saline (PBS):

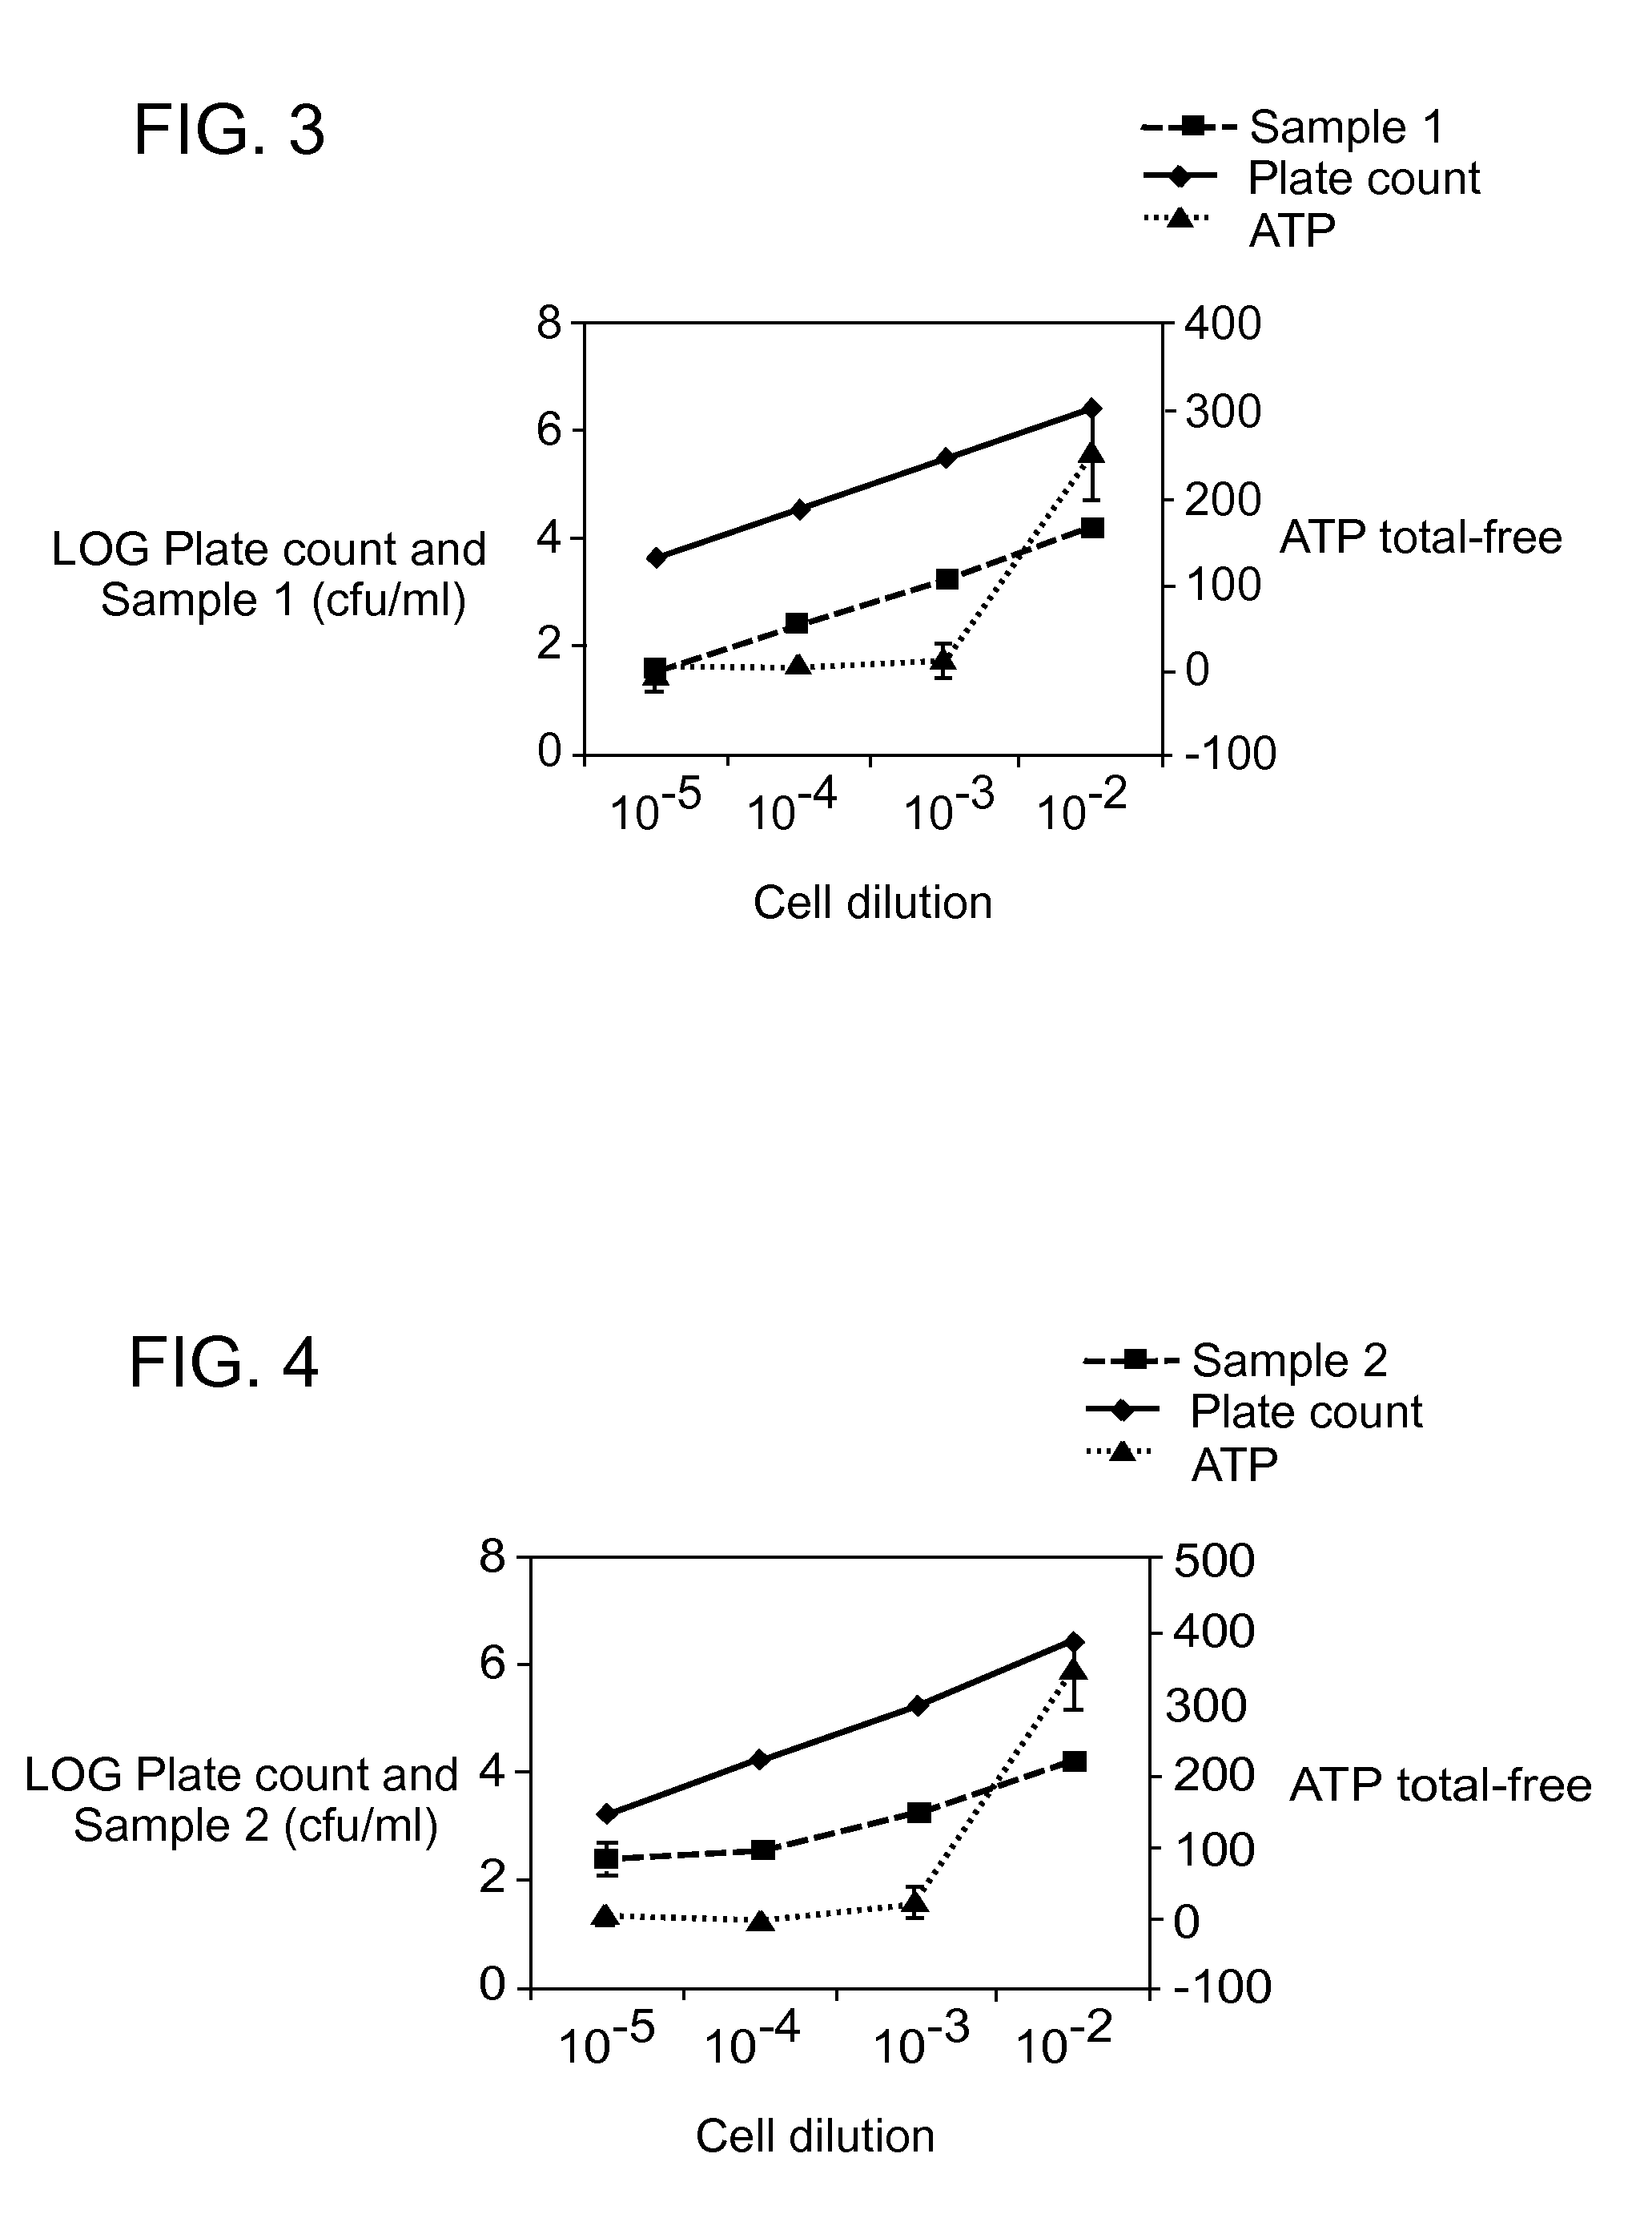
[0064]Pseudomonas fluorescens cells were grown over night in a liquid culture media and added to 10 ml of PBS to form an initial sample. Serial dilutions were prepared from the initial sample. 0.1 ml of the initial sample was added to 9.9 ml of PBS to make a 1% (10−2) solution. 1 ml of the 1% solution was added to 9 ml of PBS to make a 0.1% (10−3) solution. 1 ml ofthe 0.1% solution was added to 9 ml of PBS to make a 0.01% (10−4) solution. 1 ml of the 0.01% solution was added to 9 ml of PBS to make a 0.001% (10−5) solution. 10 ml of the PBS was used for a cell-free blank

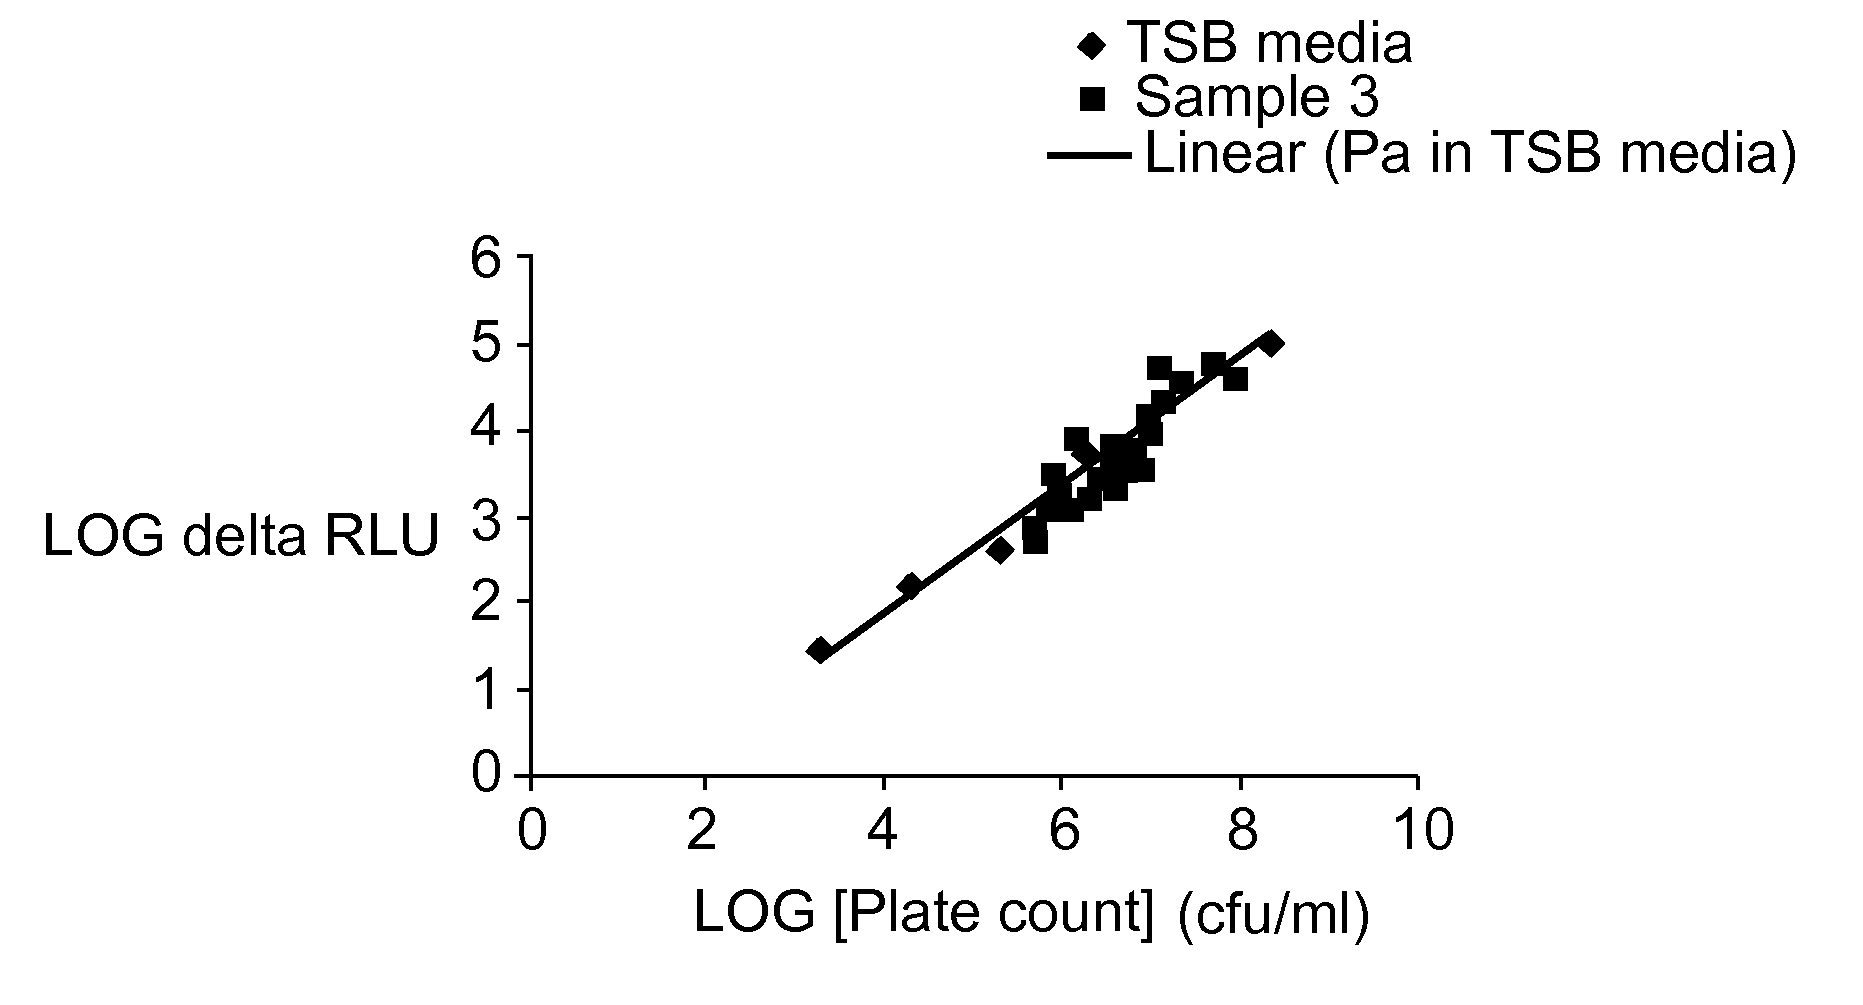
[0065]170 μl samples were taken from each of the diluted samples and the cell-free blank and each sample was mixed with 20 μl of 10× SYBR® Green I dye and 10 μl of 20× CyQUANT™ cell lysis buffer (available commercially from Molecular Probes). Fluorescence intensity was measured for each of the samples (cell-free blank, 10−2, 10−3, 10−4 and 10−5) at an excitation wavel...

example 2

Calibration Curve:

[0070]A calibration curve was prepared as in Example 1 except that filtered water from a cooling tower was used instead of the PBS.

[0071]About 50 ml of water from a cooling tower was filtered through a PVDF filter (Millipore SLGV033RB) to remove residual microorganisms. 10 ml of the filtered water was used for a cell-free blank

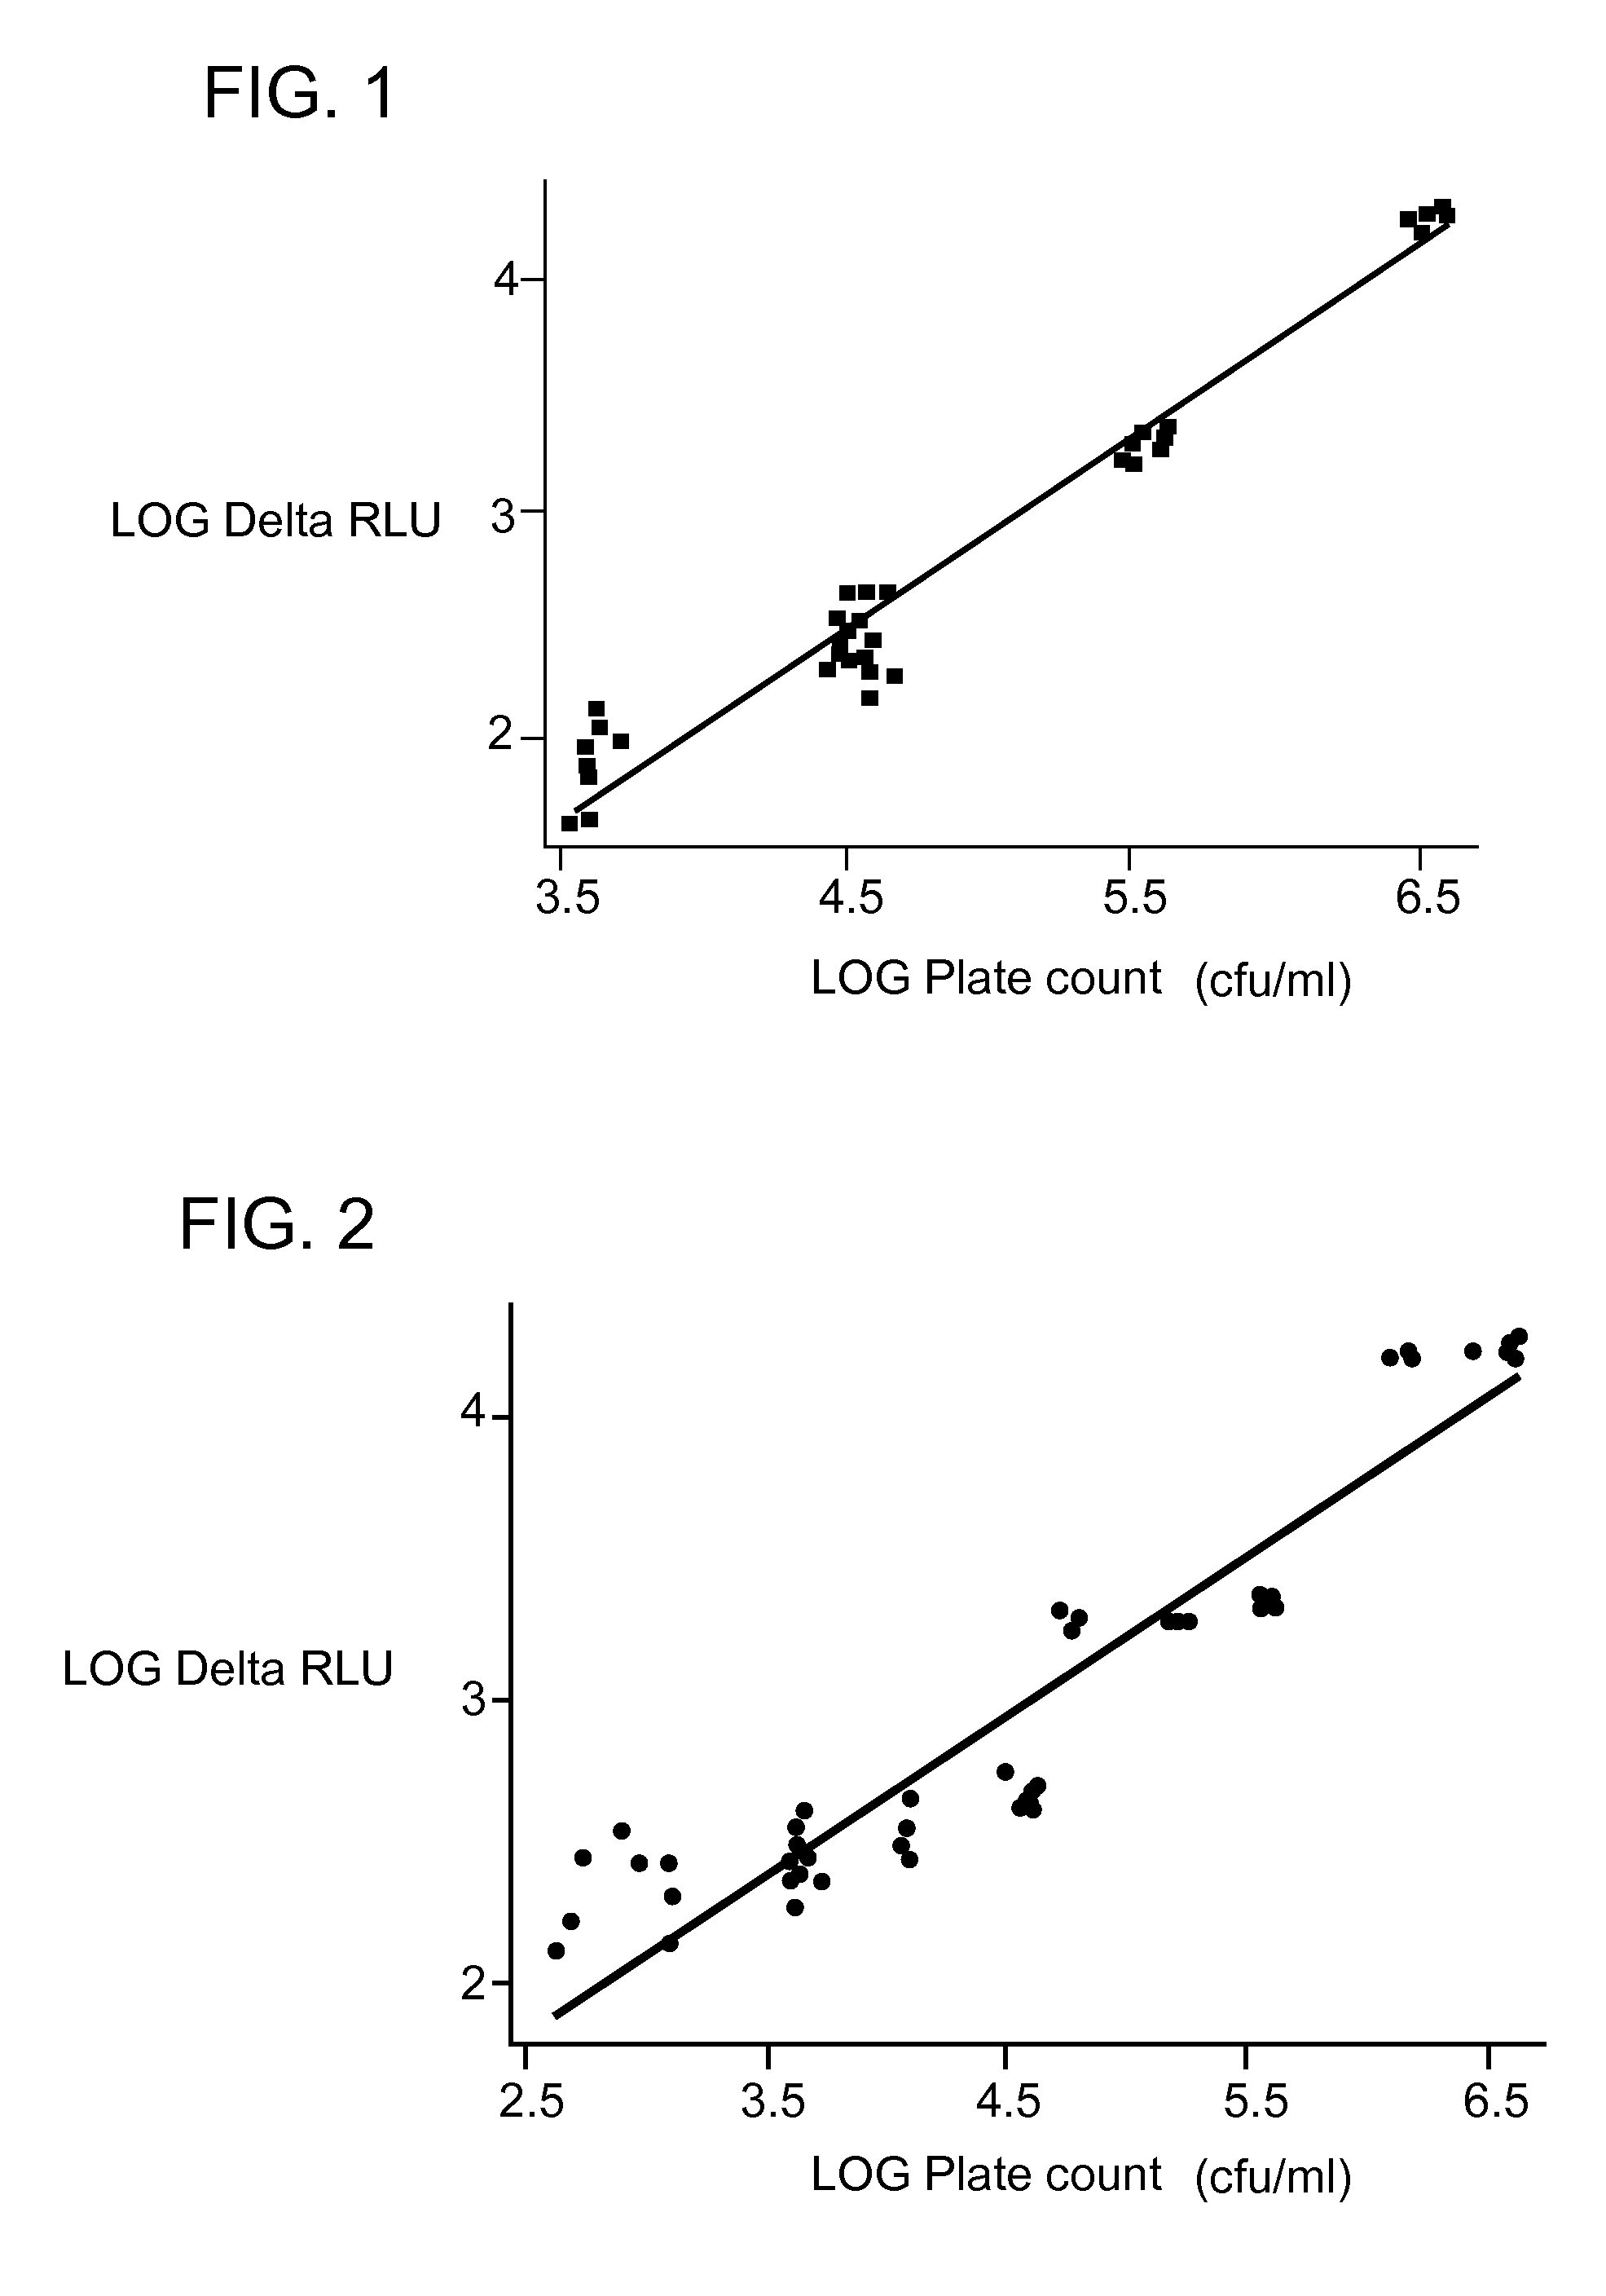
[0072]Concentrations of the total Pseudomonas fluorescens bacteria were obtained for each sample (cell-free blank, 10−2, 10−3, 10−4 and 10−5) by the plate count method.

[0073]Regression analysis was performed between the log value of the delta fluorescence intensity (RLU) and the log value of the plate count (cfu / ml) to obtain a calibration curve as shown in FIG. 2. The regression equation is y=0.383+0.576×(R−Sq=90.7%).

example 3

[0074]Pseudomonas fluorescens cells were grown over night on a culture plate and added to several 170 μl samples of phosphate buffer saline. Each sample was mixed with 20 μl of 10× SYBR® Green I dye (from Molecular Probes) and 10 μl of 20× CyQUANT™ cell lysis buffer.

[0075]Fluorescence intensity was measured for each of the samples at an excitation wavelength of 497 nm and an emission wavelength of 520 nm. The fluorescence was measured four times for each sample and averaged to obtain a fluorescent baseline signal.

[0076]The samples were heated at 60° Celsius for 2 minutes and then cooled down to room temperature. Fluorescence intensity was measured for each of the samples at an excitation wavelength of 497 nm and an emission wavelength of 520 nm. The fluorescence was measured four times for each sample and averaged to obtain a second fluorescent signal.

[0077]A delta fluorescence intensity (Δ) was obtained by subtracting the fluorescent baseline signal from the second fluorescent sign...


PUM

PropertyMeasurementUnit
emission wavelengthaaaaaaaaaa
temperatureaaaaaaaaaa

Abstract

A process for measuring total microbiological content in an aqueous medium includes adding a fluorescent dye to the aqueous medium, measuring the fluorescent signal in the aqueous medium to obtain a baseline fluorescent signal, releasing intracellular content of the microbiological matter into the aqueous medium by lysing the microbiological matter, measuring the fluorescent signal in the aqueous medium with the released intracellular content of the microbiological matter to obtain a second fluorescent signal, subtracting the baseline signal from the second fluorescent signal to obtain a net fluorescent signal and equating the net fluorescent signal with a microbiological content. Methods for measuring biofilm and adjusting for background noise are also provided.

Description

FIELD OF THE INVENTION[0001]This invention relates to methods for quantifying microbiological content in aqueous media and more particularly, to fluorescence-based assays for measuring total microbiological content.BACKGROUND OF THE INVENTION[0002]The presence of microbial activity in public water systems can cause health risks. Furthermore, detection and control of microorganisms in industrial systems is critical to various businesses, because the presence of such organisms contributes significantly to system corrosion, deposition and fouling and directly impacts the operation costs of the systems. Monitoring microbial concentrations in industrial systems and public water systems, and treatment of these systems, such as by the application of biocides, is an important part of maintaining these systems.[0003]Conventional monitoring systems for microbial detection use culture-based methods or biochemluminescence-based methods. Both of these methods quantify microbial population; howev...

Claims


Application Information

Patent Timeline
Patent Type & Authority Applications(United States)
IPC IPC(8): C12Q1/06G01N33/00
CPCC12Q1/04G01N33/1826
Inventor BOYETTE, SCOTT MARTELLCAI, HONGHIRST, PAUL RONALDJIN, YANJIANG, JUANLI, JIEXU, RONGYANG, KECHAO
Owner GENERAL ELECTRIC CO
Why Eureka
Try Eureka