Overview
[0057]The present invention relates to the light illumination and detection principles in dual-modality imaging systems combining fluorescence molecular tomography (FMT) and magnetic resonance imaging (MRI).
[0058]The design of known fluorescence imaging-MRI hybrid systems, compare e.g. Ref. [12] and [13], is dictated by the use of detectors located outside of the magnet requiring fibers for illumination and fluorescence detection that are in close proximity or even contact to the sample.
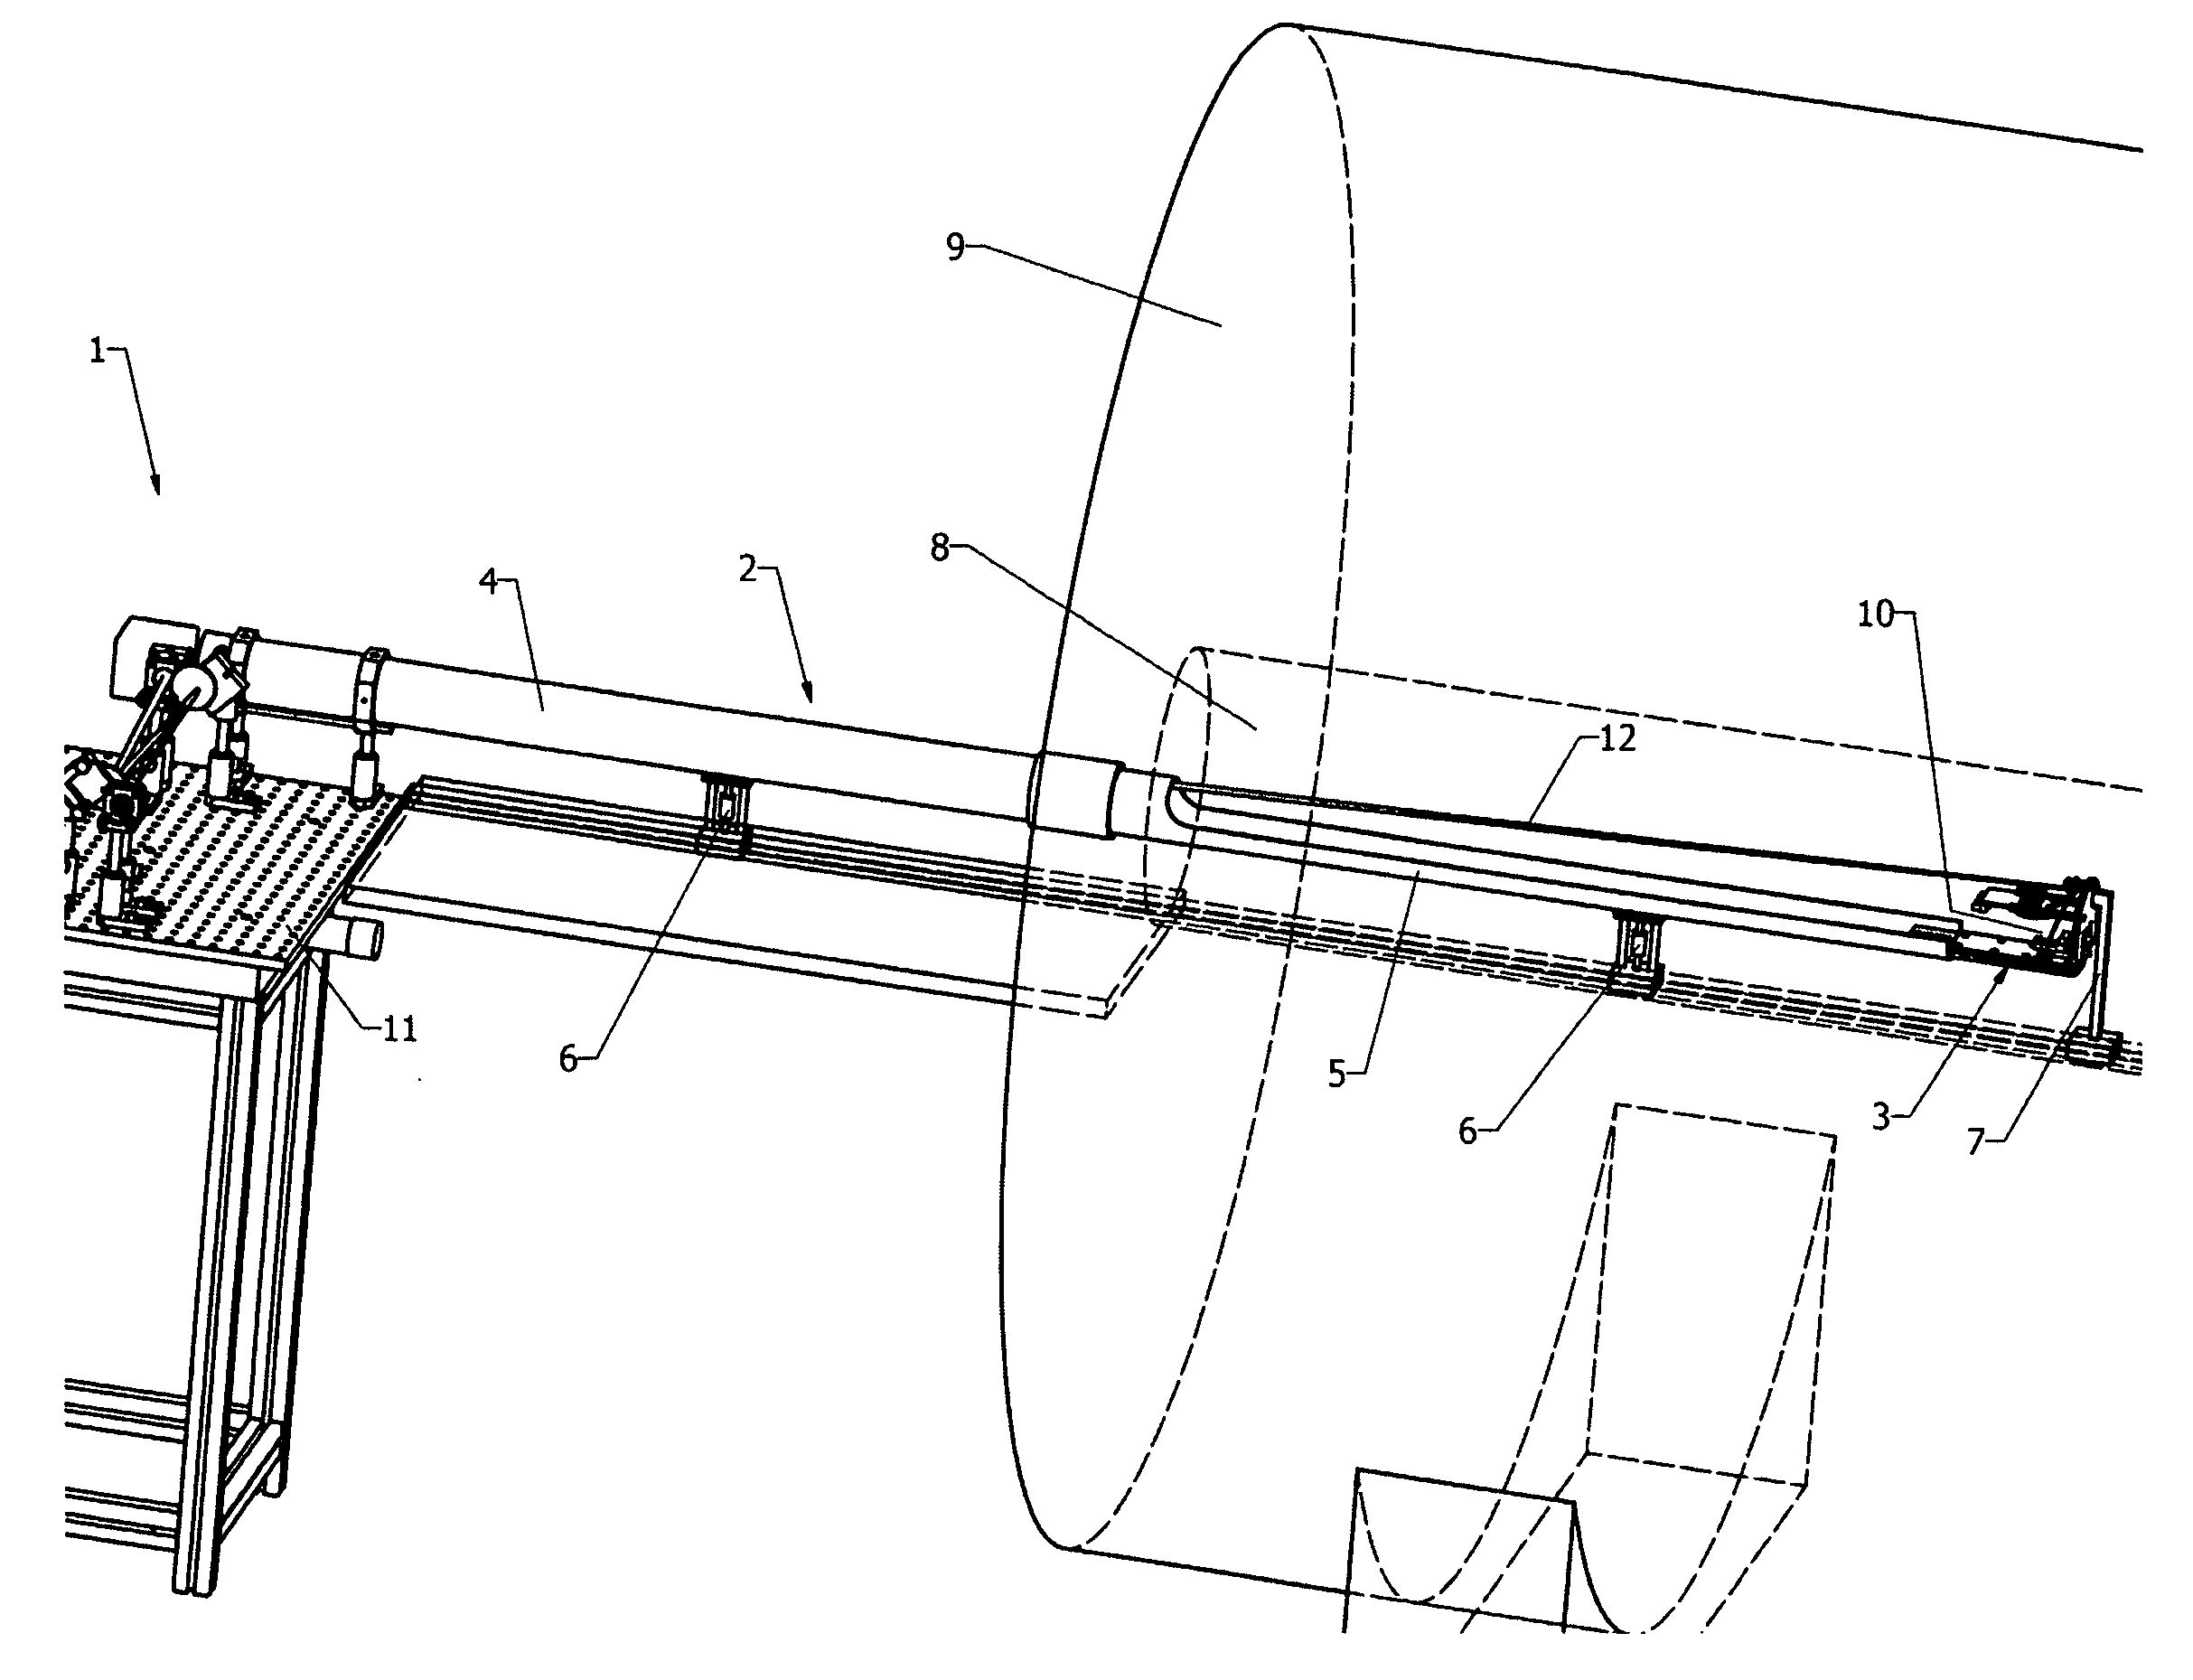
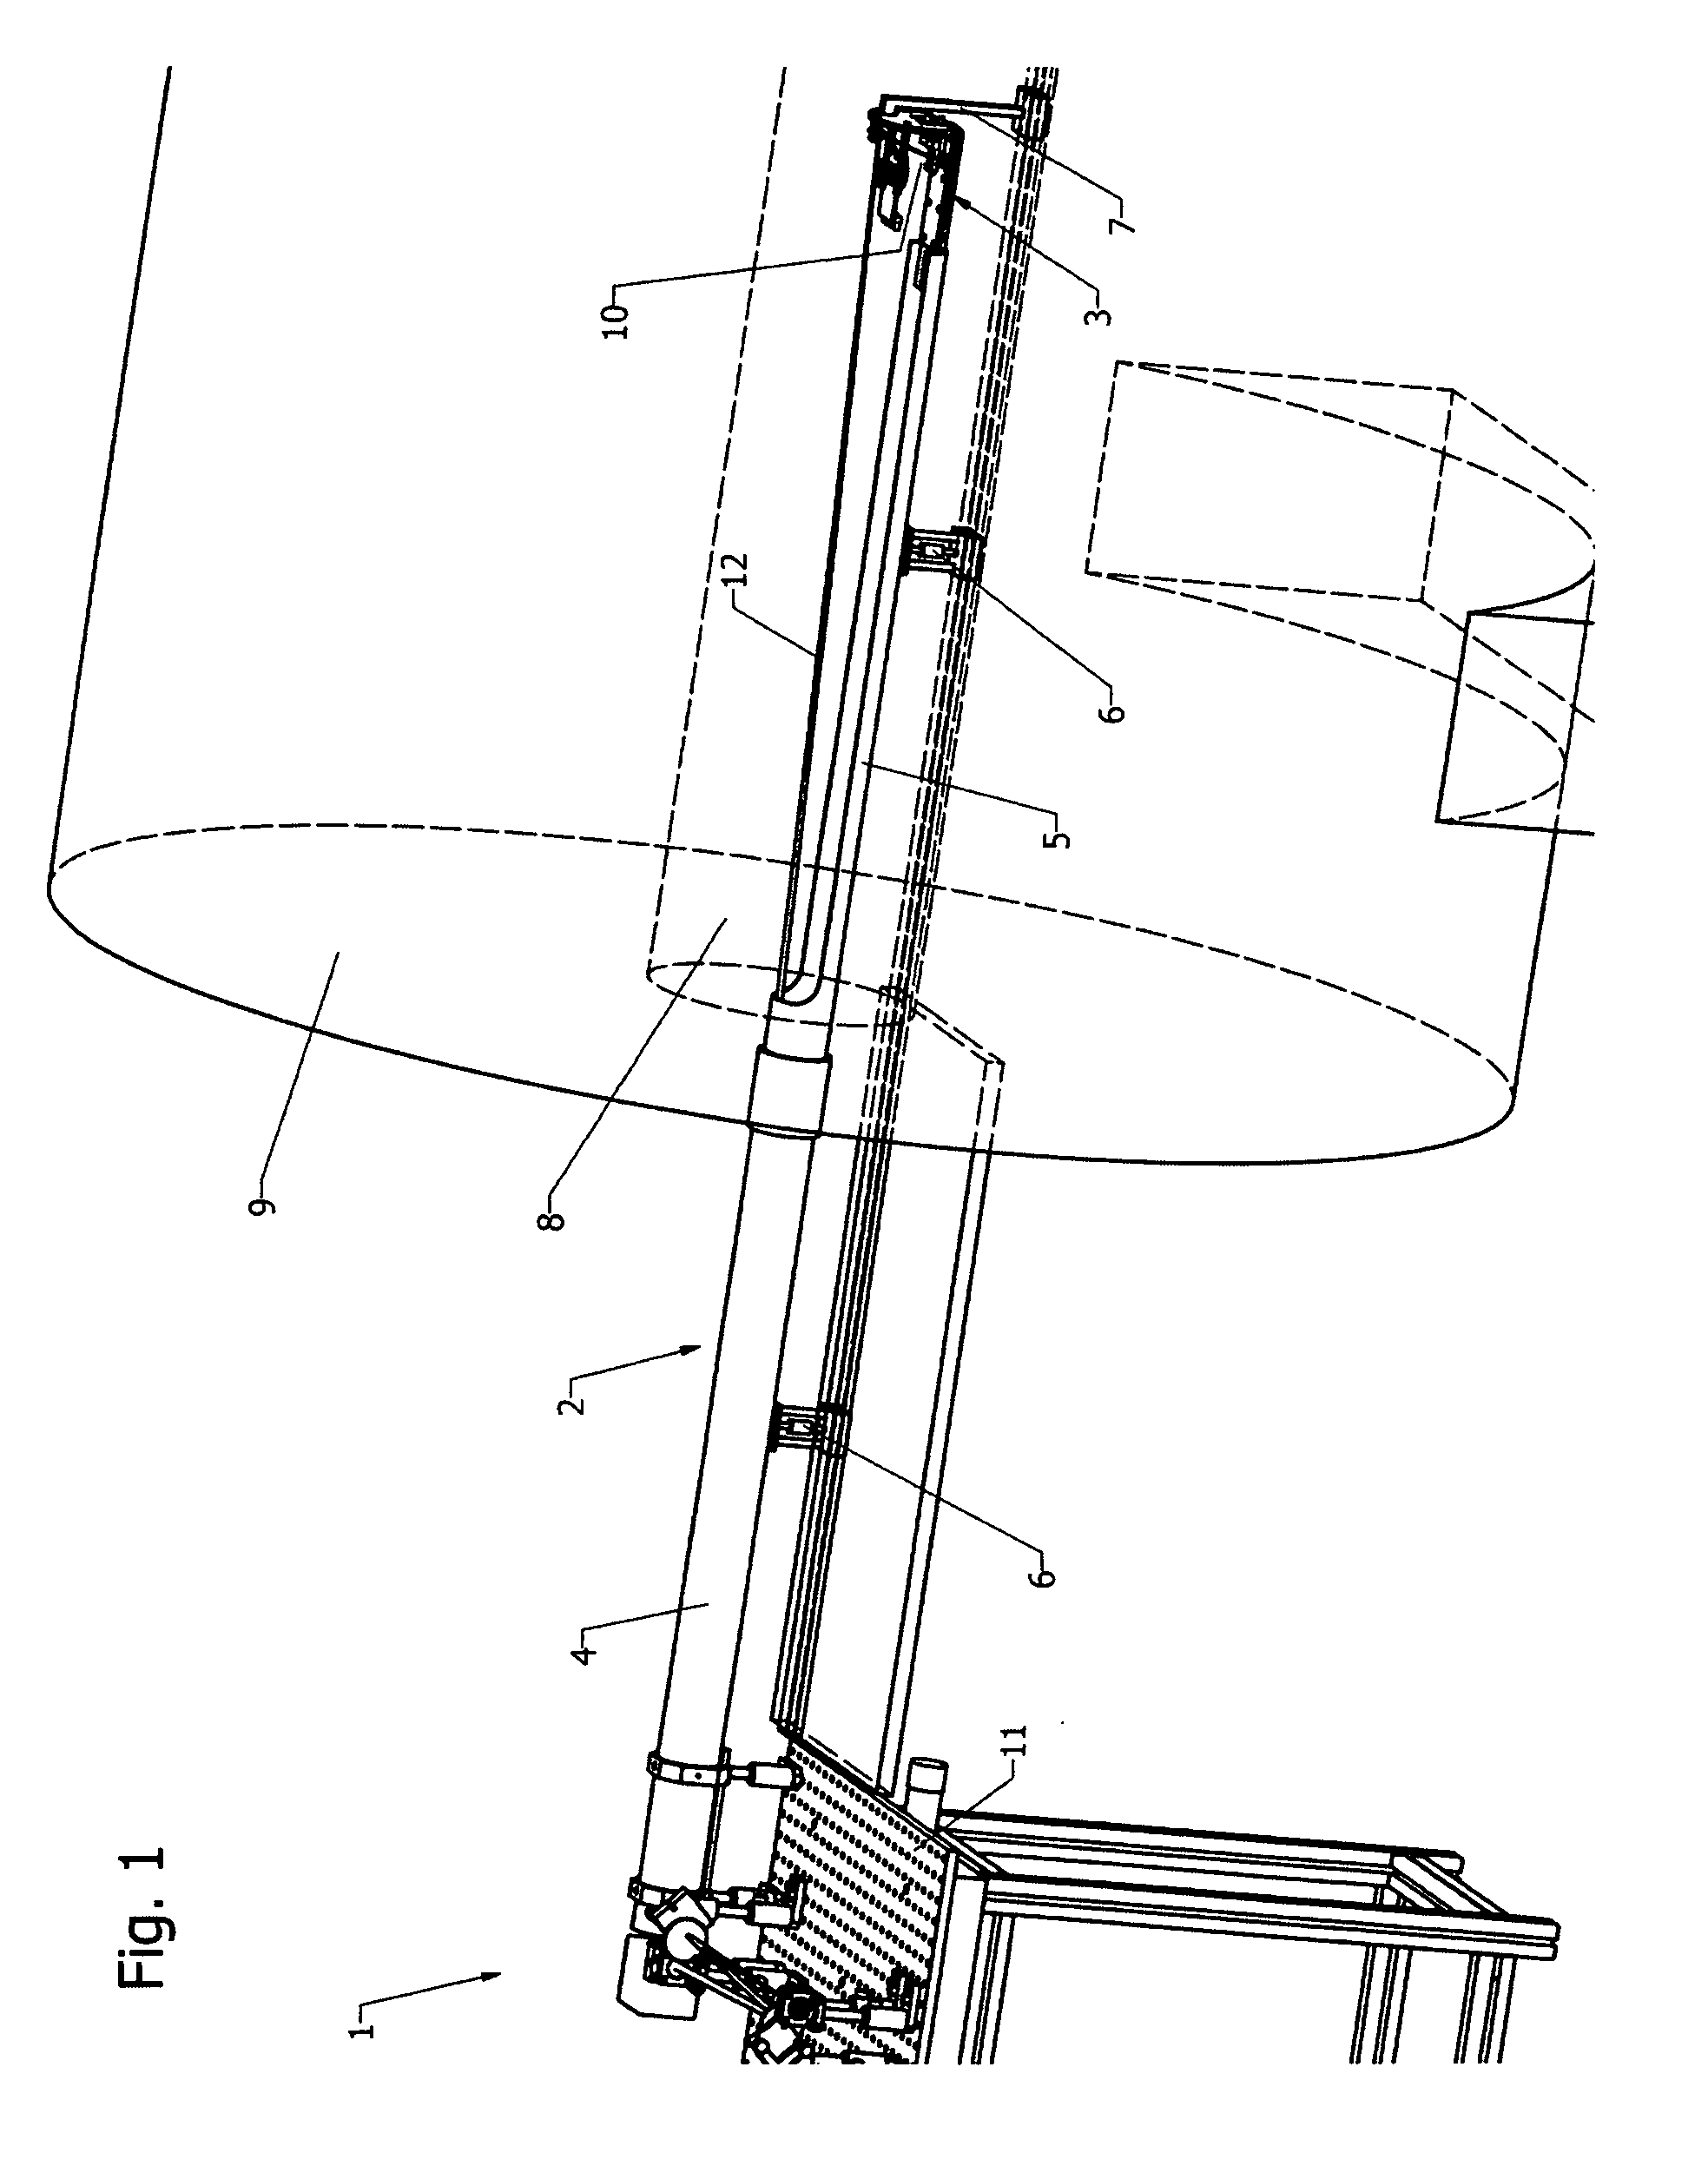
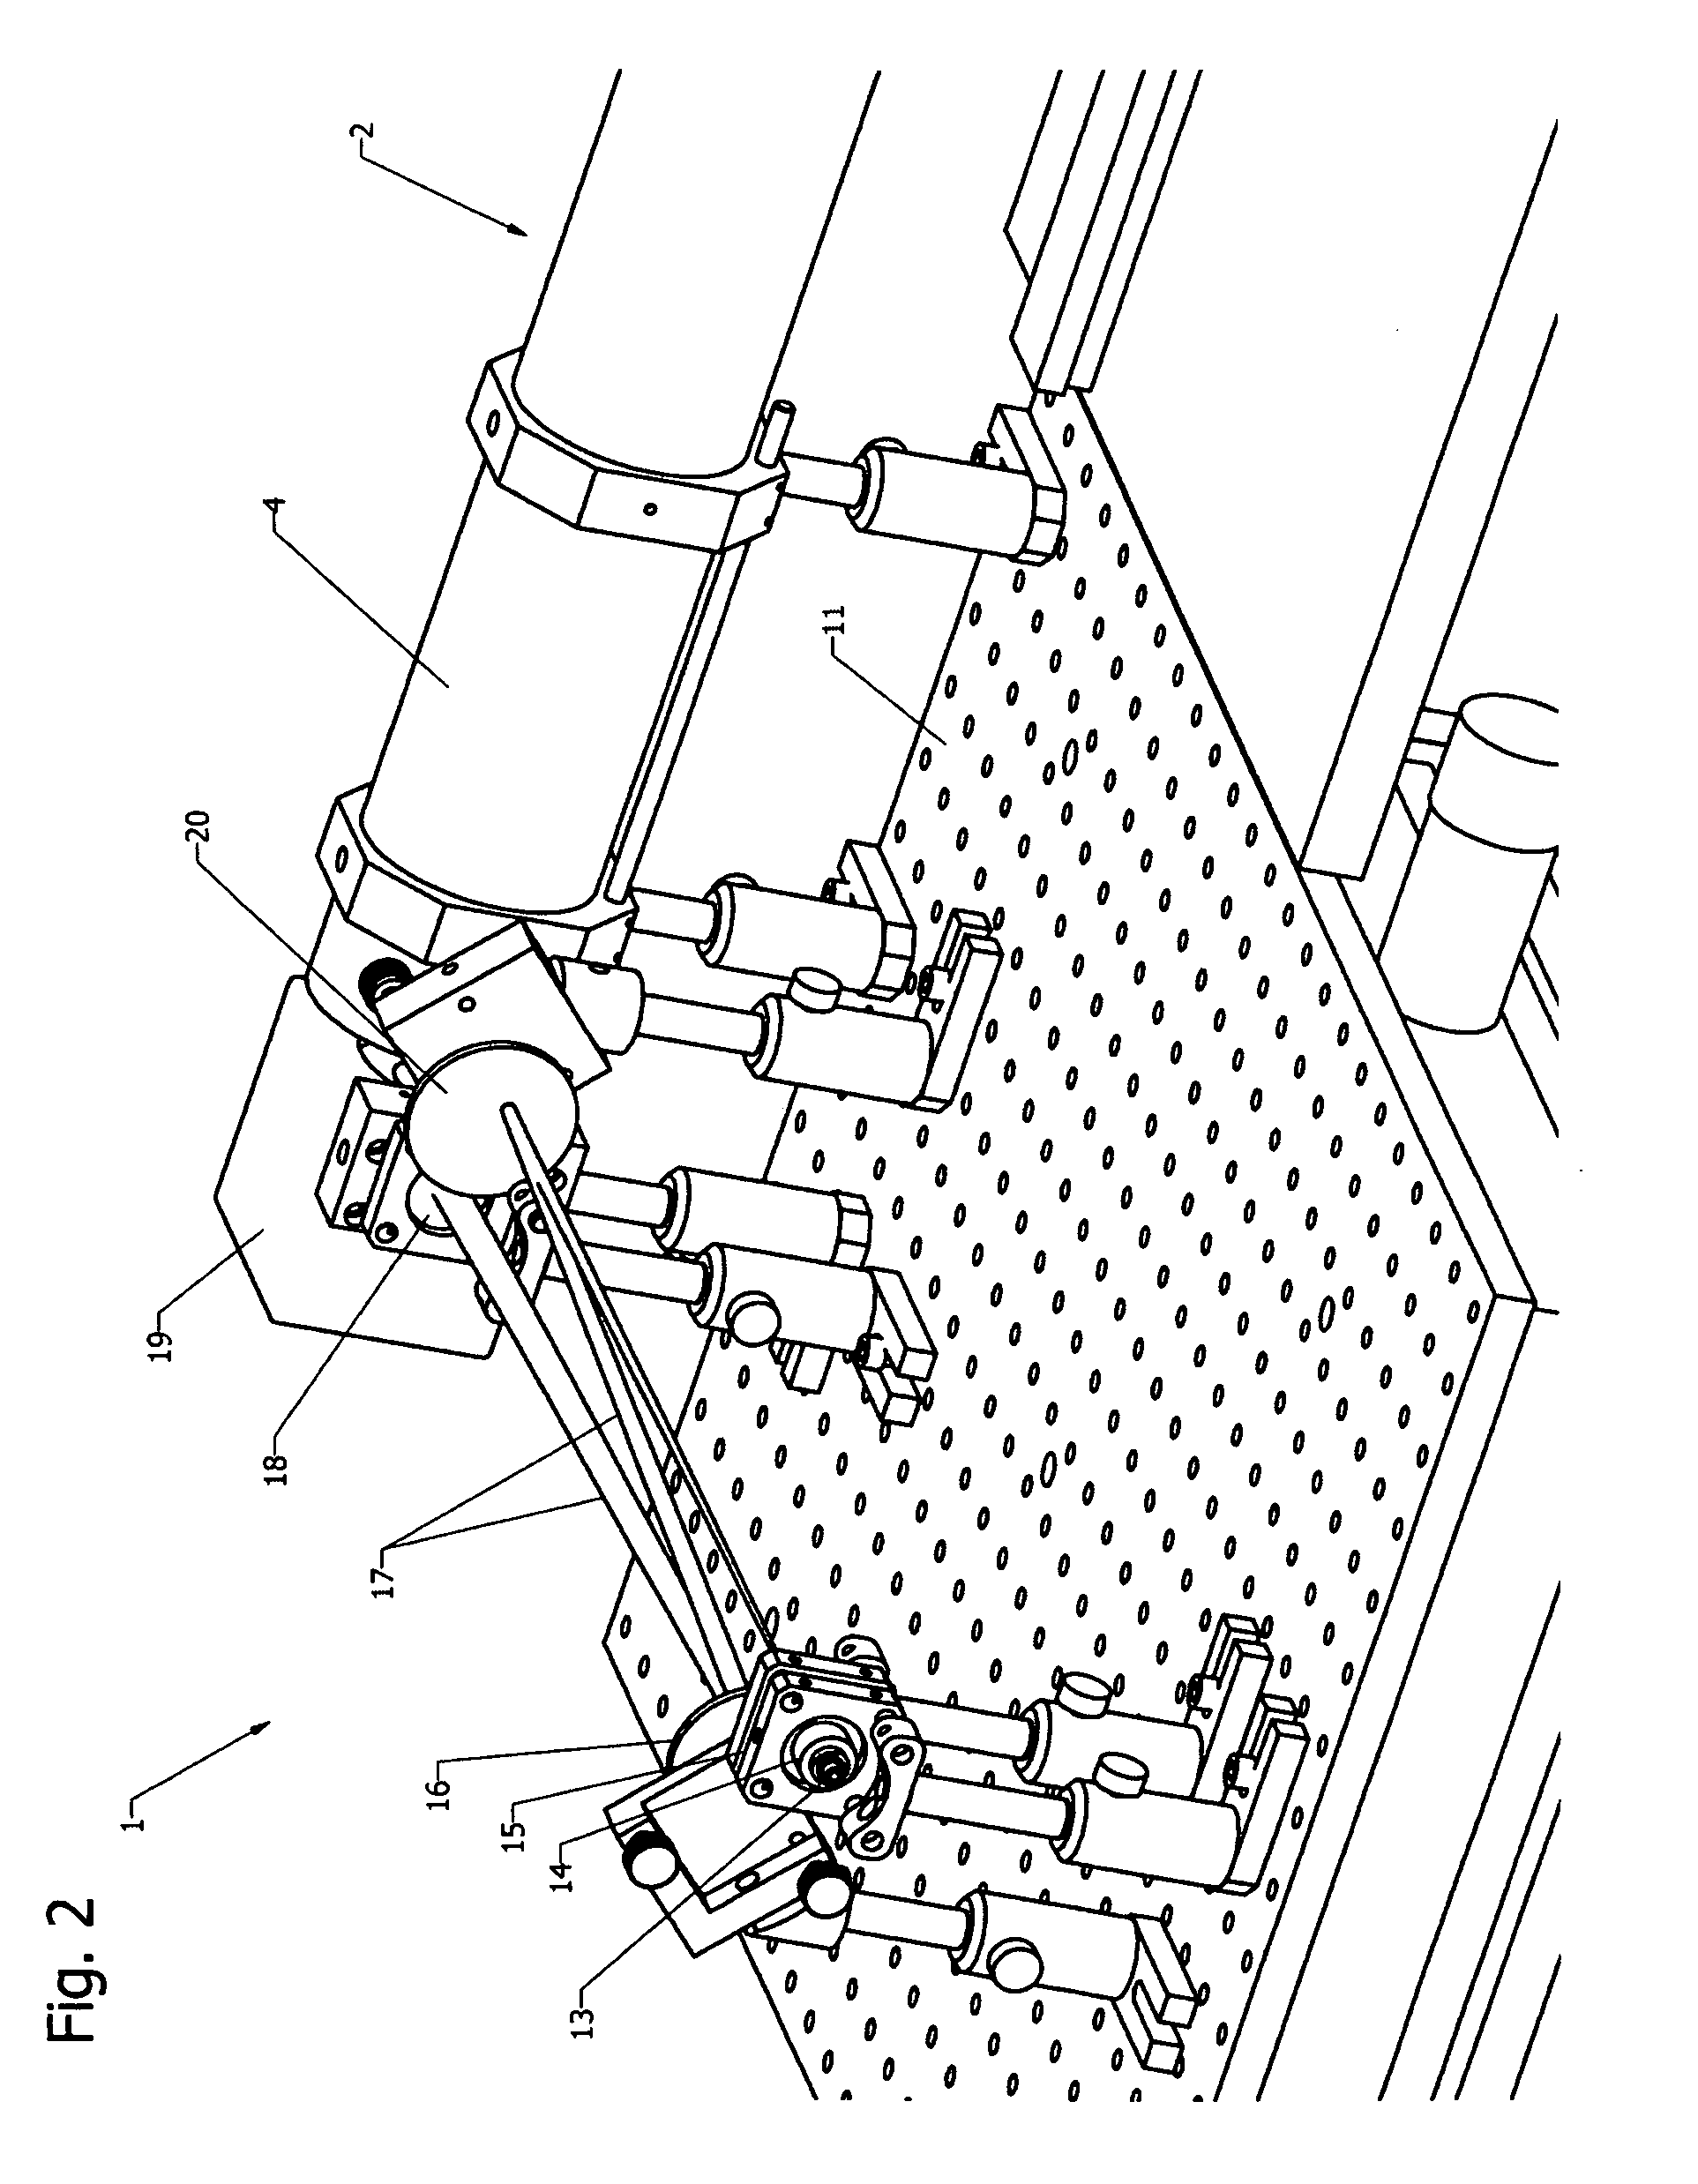
[0059]The present invention describes a fundamentally different approach of a non-contact FMT setup designed to fit into the bore of a magnetic resonance imaging system, in particular a small animal imaging system, avoiding the restrictions due to the limited number of sources and detection fibers. In the preferred embodiment, a single photon avalanche diode (SPAD) array detector is placed inside the magnet near to the sample. Illumination is provided with a free-space laser beam from outside the magnet that is focused on the sample surface and that can be scanned across an area of interest. The number of sources NS can be chosen arbitrarily, while the number of detectors ND is given by the array dimension of the detector. This allows to significantly increase the number of source-detector combination and thereby the image quality.
ASPECTS OF THE INVENTION
[0060]In one aspect of the present invention, a device for providing optical tomography and anatomical MR information is provided. The apparatus includes a sample platform for optical and anatomical imaging inside an MR system.
[0061]In a further aspect of the present invention, a method of guiding light, scanning a point source and detecting an optical signal in an MR system is provided. The method includes a combination of a scanning part with a signal detection part within one single apparatus.
[0062]In another aspect of the present invention, the sample platform is not only constructed for animal brain imaging but can also be adapted to image any part of the present subject. The optical illumination and signal detection works without any contact of the detection and illumination part with the sample.
[0063]In yet another aspect of the present invention, the scanning of the beam takes place outside the high magnetic field of the MR system, whereas the detection part is placed in the MR system.
DESCRIPTION OF AN EMBODIMENT OF THE INVENTIVE APPARATUS
[0064]The figures show an embodiment of the inventive apparatus in more detail. The apparatus setup (with FIG. 1 giving an overview) comprises two major parts:
[0065]a) An illumination part 1 (compare FIG. 2) aligned on a bread board 11 outside a magnet 9 to ensure the accurate function of a delicate scan head, and
[0066]b) A second part representing the sample platform 3 (compare FIG. 4), comprising an optical detector and a radio frequency (RF) coil for the magnetic resonance signal detection, placed at the sample position 10 in the isocenter of an MRI system.
[0067]To ensure a correct alignment of the illumination part 1 and the sample platform 3, they are linked with two joint tempered glass tubes 4, 5 acting as a rigid linkage 2, with the glass tube 4 outside a room temperature bore 8 of the (here superconducting) magnet 9, and the glass tube 5 mostly located inside the bore 8 being cut open on its upper side. Note that other types of rigid linkage, e.g. of framework type, are also possible. The sample platform 3 is properly positioned within the bore 8 by means of a guiding 6 and a stop 7.
[0068]The illumination part 1 is shown in more detail in FIG. 2. A laser beam is coupled into the system at a laser input 13. In the example shown, this is done by an aperture matched collimation lens 14 (note that other coupling mechanisms known to the expert in the field may be used as well). After the lens 14, a pinhole 15 is placed, which is mapped with an anti-reflectance coated spherical singlet lens 18 (with f=1000 mm) by a 2f image on the subject (sample). Before the beam 17 arrives at the lens 18, which is placed directly in front of a scan head 19, the light beam 17 is guided to a small optical resonator is made of two coated economy front surface mirrors 16, 20. The light travels the distance between the mirrors 16, 20 five times before reaching the scan head 19, where it is reflected by two galvanometric driven mirrors (contained within the scan head 19, not shown in detail) which allow the scanning of the sources (i.e. the scanning of the focal spot, compare FIG. 5, by moving these mirrors as optical elements) on the surface of the sample. These mirrors deflect the beam approximately by 90° from the input direction. The scan head 19 acts as the scanning device of the apparatus. The beam is then directed through a rigid linkage 2, which is here separated in the middle (compare FIG. 1, tubes 4, 5) to facilitate handling, to the sample platform placed in the magnet. All components located outside the magnet 9 are fixed on a home build breadboard 11, the position of which can be adjusted in the two orthogonal directions of the horizontal plane.
[0069]FIG. 3 illustrates a further way to scan the light beam (or its focal spot) outside the magnet bore in accordance with the invention, as an alternative to the scan head shown in FIG. 2. A motorized xy stage 22 is placed on the bread board 11. The xy stage 22 carries the laser input 13 (where the output end of a fiber transporting a laser beam from a laser is fixed, not shown) as well as the collimation lens 14, the pinhole 15 and a lens system 21 for focusing the laser beam 12. By moving the equipment carried by the xy stage 22, the laser beam 12 can be shifted in two directions 24, 25 radially relative to the axis of the rigid linkage 2, and thus relative to the sample (typically after a reflection by a mirror, as shown with ref. no. 26 in FIG. 4). By this means, the output end of the fiber at the laser input 13 can be imaged to and scanned on the sample surface by moving said output end.
[0070]As shown in FIG. 4, at the end of the tube 5, the sample platform 3 is mounted. Attached to the sample platform 3 is a blackened rare flange 27, which is linked to a pcb holder 31 for the detector pcb 25 and linked to a deflection mirror 26 for deflection of the laser beam 12 to the sample position 10 (or, more exactly, to the surface of the object). The scan head is scanning arbitrary (grid) points on the sample within the camera field of view.
[0071]As an example, we show the sample platform 3 designed for head imaging. Analogous supports can be designed for imaging any body region of the animals or even for whole body imaging. The sample platform 3 comprises an animal/sample support 36 (where the body of the animal is located, note that the animal is not shown in FIG. 4), and a head support. The head support comprises a pair of integrated stereotactic ear bars for head fixation (compare stereotactic fixation 35). A tooth bar is fixed in the animal face mask, which was used for the administration of anesthesia gases (not shown). The sample platform 3 comprises a water heating, maintaining the animals on the animal support 36 at a constant temperature during the measurement.
[0072]A head adapted RF coil 33 with tuning and matching capacities (see trimmer capacitors 32) is positioned between the sample position 10 and the detector, compare detector pcb 25. The coil design is such that it allows the passage of exciting and fluorescent light through a coil opening (see window 34). The optical detector is here an array of single-photon avalanche diodes (SPAD) bonded on a printed circuit board (pcb) 25. A fixed focus low profile lens (not shown in FIG. 4, compare FIG. 5) is glued directly to the pcb 25 on the top of the detector array providing a field of view (FOV) at a fixed focal distance covering the head of the animal.
[0073]The light beam 12 from outside the magnet bore impinging on the small mirror 26 placed in the back wall (flange 27) of the animal/sample support 36 deflects the beam 12 to the surface of the sample at the sample position 10. The back-scattered light is filtered upon passage through a filter wheel 28 containing optical band pass filter elements 29 for different wavelength domains. The filter wheel 28 is positioned between the animal (sample) and the SPAD detector array.
[0074]For each laser illumination point, the light intensity distribution on the animal's surface is recorded. Imaging data sets are collected at the excitation wavelength and at various emission wavelengths. A small light emitting diode (LED) strip (not shown) mounted to the rear flange 27 of the animal/sample support 36 at the back wall is providing light for the white light illumination during the reference surface image acquirement. All the parts used for the animal/sample support 36 and the sample platform 3 are made from materials not interfering with high magnetic fields.
[0075]It should be noted that the means for directing the light beam shown in the figures are to be understood as examples only, and the expert in the field can use other equipment known to him without departing from the scope of the present invention.
[0076]The setup is fully computer controlled and the software allows an automatic acquirement of the image needed for tomographic reconstruction. Optical tomography is analog to X-ray computed tomography and uses multiple projections to generate the final image. Optical tomography requires a number of optical measurements from light-source/detector pairs through bulk tissue and an appropriate forward model to predict the light propagation within an optically diffusive media to finally solve an inverse problem to gain the fluorescence light distribution within the volume of interest.
[0077]As shown in FIG. 5, to measure the different source/detector pairs, the subject (sample 42) is placed in the field of view (FOV) 40 of the detector 37 (which here is an array of 32×32 one-element-detector elements, shown only schematically in FIG. 5), and the number and arrangement of sources on the subject is chosen and set through the software. A source is a focal spot 41 of the incoming deflected laser beam 30 on the sample 42. During the measurement, the focal spot 41 is scanned to different positions of a point scan grid 39 (in FIG. 5, a 3×3 grid is shown). For each position of the focal spot 41 on the point scan grid 39, the detector 37 records position sensitive images of the field of view 40 of the sample 42. The fluorescence light passes the filter element 29 and an objective lens 38 for this imaging. It should be noted that a typical field of view 40 has a size of 8 mm×8 mm, and a focal spot 41 has a typical diameter of 2 mm. The detector 37 is at a distance of about 20-30 mm to the sample. The distance of the detector 37 to the sample 42 is typically larger than the dimension (and preferably larger than two times the dimension) of its field of view 40 on the sample 42 so the beam 30 can be scanned properly.
[0078]In the following, an experiment performed by the inventors with the inventive apparatus is described.
[0079]Before data acquisition, two calibration measurements were performed: one to match the scan head coordinate system with the pixel coordinate system of the detector, and the other to find the pixel dimensions in centimeters. Then the scanning procedure was started and a fluorescence and excitation data set was acquired with the corresponding filters. The setup shown here was built to acquire in reflectance mode where the detector and the light source are placed at the same side of the subject. One image was recorded for each source position, resulting in an Nx*Ny*NS array of images, where Nx and Ny is the number of pixels in x and y direction and NS is the number of sources. At the end, a background image was acquired for each filter position without any laser irradiation. A white light image of the subject surface was acquired to localize the fiducial markers on the sample which were used later on to match optical and MRI data.
[0080]The light propagation in tissue for setting up the forward problem was modeled by a so-called diffusion approximation of the radiative transfer equation. The diffusion equation was solved for a slab geometry with extrapolated boundary conditions resulting in a system of linear equations.
[0081]Further, a normalized Born algorithm [14] was then applied on the linear equations to get the normalized Born intensities. This algorithm, based on the excitation measurement to account for the intrinsic tissue properties, cancels out the position dependent factors. After discretizing the volume of interest, a system of linear equations can be formulated in matrix form y=W*x, where y are the source-detector measurements now represented by the normalized Born intensities, x the fluorochrome concentration at each position in the generated mesh within the volume of interest, and W is the weight matrix describing the light propagation in tissue. In general, this problem is ill-posed and needs numerical techniques for inversion such as an algebraic reconstruction technique (ART). This iterative algorithm was used for fluorophore distribution reconstruction.
LIST OF REFERENCE SIGNS
[0082] 1. Illumination part [0083] 2. Rigid linkage [0084] 3. Sample platform [0085] 4. Tempered glass tube [0086] 5. Tempered glass tube [0087] 6. Guiding [0088] 7. Stop [0089] 8. Room temperature bore [0090] 9. Magnet [0091] 10. Sample position at isocenter [0092] 11. Bread board [0093] 12. Laser beam sent to the sample [0094] 13. Laser input [0095] 14. Collimation lens [0096] 15. Pinhole [0097] 16. Resonator mirror 1 [0098] 17. Laser beam in the resonator [0099] 18. Lens for beam focusing [0100] 19. Scan head [0101] 20. Resonator mirror 2 [0102] 21. Lens system for beam focusing [0103] 22. Motorized xy-stage for scanning [0104] 23. Scan direction [0105] 24. Scan direction [0106] 25. Detector pcb [0107] 26. Deflection mirror [0108] 27. Rare flange [0109] 28. Filter wheel [0110] 29. Filter element [0111] 30. Deflected laser beam [0112] 31. Pcb holder [0113] 32. Trimmer capacitors [0114] 33. RF coil [0115] 34. Window [0116] 35. Stereotactic fixation [0117] 36. Animal/sample support [0118] 37. Detector [0119] 38. Objective lens [0120] 39. Point scan grid [0121] 40. Field of view [0122] 41. Focal spot [0123] 42. Sample
REFERENCES
[0124] [1] Ciprian Catana, Yibao Wu, Martin S. Judenhofer, Jinyi Qi, Bernd J. Pichler, and Simon R. Cherry. Simultaneous acquisition of multislice PET and MR images: Initial results with MR-compatible PET scanner. The Journal of Nuclear Medicine, 47(12):1968-1976, December 2006. [0125] [2] Bernd J. Pichler, Martin S. Judenhofer, Ciprian Catana, Jeffrey H. Walton, Manfred Kneilling, Robert E. Nutt, Stefan B. Siegel, Claus D. Claussen, and Simon R. Cherry. Performance test of an LSO-APD detector in a 7-T MRI scanner for simultaneous PET/MRI. Journal of Nuclear Medicine, 47:639-647, 2005. [0126] [3] Edward E. Graves, Jorge Ripoll, Ralph Weissleder, and Vasilis Ntziachristos. A submilimeter resolution fluorescence molecular imaging system for small animal imaging. Medical Physics, 30(5):901-911, May 2003. [0127] [4] Vasilis Ntziachristos, Eyk A. Schellenberger, Jorge Ripoll, Doreen Yessayan, Edward Graves, Alexei Bogdanov, Lee Josephson, and Ralph Weissleder. Visualization of antitumor treatment by means of fluorescence molecular tomography with an annexinV-Cy5.5 conjugate. PNAS, 101(33):12294-12299, August 2004. [0128] [5] Murat Guven, Birsen Yazici, Xavier Intes, and Britton Chance. Diffuse optical tomography with a priori anatomical information. Physics in Medicine and Biology, 50:2837-2857, February 2005. [0129] [6] Fluorescence optical tomography with a priori information, volume 6431. SPIE, 2007. [0130] [7] Damon Hyde, Ruben DeKleine, Sarah A. MacLaurin, Eric Miller, Dana H. Brooks, Thomas Krucker, and Vasilis Ntziachristos. Hybrid FMT-CT imaging of amyloid-_plaques in a murine Alzheimer's disease model. Neuroimage, 1:8-9, 2008. [0131] [8] Elucidating Structure and Function In Vivo With Hybrid Fluorescence and Magnetic Resonance Imaging, volume 96. IEEE, March 2008. [0132] [9] Mathieu Allard, Daniel Ĉot´e, Lorinda Davidson, Jun Dazai, and R. Mark Henkelman. Combined magnetic resonance and bioluminescence imaging of live mice. Journal of Biomedical Optics, 12(3):034018-1-034018-11, May/June 2007. [0133] [10] Sean Merritt, Frederic Bevilacqua, Anthony J. Durkin, David J. Cuccia, Ryan Lanning, Bruce J. Tromberg, Gultekin Gulsen, Hon Yu, Jun Wang, and Orhan Nalcioglu. Coregistration of diffuse optical spectroscopy and magnetic resonance imaging in a rat tumor model. Applied Optics, 42(16):2951-2959, June 2003. [0134] [11] David J. Cuccia, Frederic Bevilacqua, Anthony J. Durkin, Sean Merritt, Bruce J. Tromberg, Gultekin Gulsen, Hon Yu, Jun Wang, and Orhan Nalcioglu. In vivo quantification of optical contrast agent dynamics in rat tumors by use of optical spectroscopy with magnetic resonance imaging coregistration. Applied Optics, 42(16):2940-2950, June 2003. [0135] [12] Heng Xu, Roger Springet, Hamid Dehghani, Brian W. Pogue, Keith D. Paulsen, and Jeff F. Dunn. Magentic-resonance-imaging-coupled broadband near-infrared tomography system for small animal brain studies. Applied Optics, 44(11):2177-2188, April 2005.
[0136][13] Britton Chance, Robert F. Alfano, Bruce J. Tromberg, Mamoru Tamaura, and Eva M. Sevick-Muaraca, editors. Combined optical tomography and magnetic resonance imaging of tumor bearing mice, volume 5693 of Optical Tomography and Spectroscopy of Tissue VI. SPIE, 2005. [0137] [14]Vasilis Ntziachristos and Ralph Weissleder. Experimental three-dimensional fluorescence reconstruction of diffuse media by use of a normalized born approximation. Optics Letters, 26(12):893-895, June 2001.