Eureka AIR delivers breakthrough ideas for toughest innovation challenges, trusted by R&D personnel around the world.

Use of biomarkers for detecting ovarian cancer

a biomarker and ovarian cancer technology, applied in the direction of enzymology, peptides, drug compositions, etc., can solve the problems of low sensitivity and specificity of population-based screening tools for early detection and diagnosis of ovarian cancer, and neither technique has sufficient sensitivity and specificity to be applied to the general population, so as to limit the number of markers detected

Inactive Publication Date: 2011-02-10
THE JOHN HOPKINS UNIV SCHOOL OF MEDICINE +1
View PDF0 Cites 0 Cited by
  • Summary
  • Abstract
  • Description
  • Claims
  • Application Information

AI Technical Summary

Benefits of technology

[0002]The best-characterized tumor marker, CA125, is negative in approximately 30-40% of stage I ovarian carcinomas and its levels are elevated in a variety of benign diseases. (Meyer T, et al., Br J Cancer, 2000; 82(9):1535-8; Buamah P., J Surg Oncol, 2000; 75(4):264-5; Tuxen M K, et al., Cancer Treat Rev, 1995; 21(3):215-45). Its use as a population-based screening tool for early detection and diagnosis of ovarian cancer is hindered by its low sensitivity and specificity. (MacDonald N D, et al., Eur J Obstet Gynecol Reprod Biol, 1999; 82(2):155-7; Jacobs I, et al., Hum Reprod, 1989; 4(1):1-12; Shih I-M, et al., Tumor markers in ovarian cancer. In: Diamandis E P, Fritsche, H., Lilja, H., Chan, D. W., and Schwartz, M., editor. Tumor markers physiology, pathobiology, technology and clinical applications. Philadelphia: AACC Press; in press). Although pelvic and more recently vaginal sonography has been used to screen high-risk patients, neither technique has the sufficient sensitivity and specificity to be applied to the general population. (MacDonald N D, et al., supra). Recent efforts in using CA125 in combination with additional tumor markers (Woolas R P X F, et al., J Natl Cancer Inst, 1993; 85(21):1748-51; Woolas R P, et al., Gynecol Oncol, 1995; 59(1):111-6; Zhang Z, et al., Gynecol Oncol, 1999; 73(1):56-61; Zhang Z, et al., Use of Multiple Markers to Detect Stage I Epithelial Ovarian Cancers: Neural Network Analysis Improves Performance. American Society of Clinical Oncology 2001; Annual Meeting, Abstract) in a longitudinal risk of cancer model (Skates S J, et al., Cancer, 1995; 76(10 Suppl):2004-10), and in tandem with ultrasound as a second line test (Jacobs I D A, et al., Br Med J, 1993; 306(6884):1030-34; Menon U T A, et al., British Journal of Obstetrics and Gynecology, 2000; 107(2):165-69) have shown promising results in improving overall test specificity, which is critical for a disease such as ovarian cancer that has a relatively low prevalence.

Problems solved by technology

Despite considerable effort directed at early detection, no cost effective screening tests have been developed (Paley P J., Curr Opin Oncol, 2001; 13(5):399-402) and women generally present with disseminated disease at diagnosis.
Its use as a population-based screening tool for early detection and diagnosis of ovarian cancer is hindered by its low sensitivity and specificity.
Although pelvic and more recently vaginal sonography has been used to screen high-risk patients, neither technique has the sufficient sensitivity and specificity to be applied to the general population.

Method used


Image

  • Use of biomarkers for detecting ovarian cancer
  • Use of biomarkers for detecting ovarian cancer
  • Use of biomarkers for detecting ovarian cancer

Examples


example 1

Protein Expression Profiling

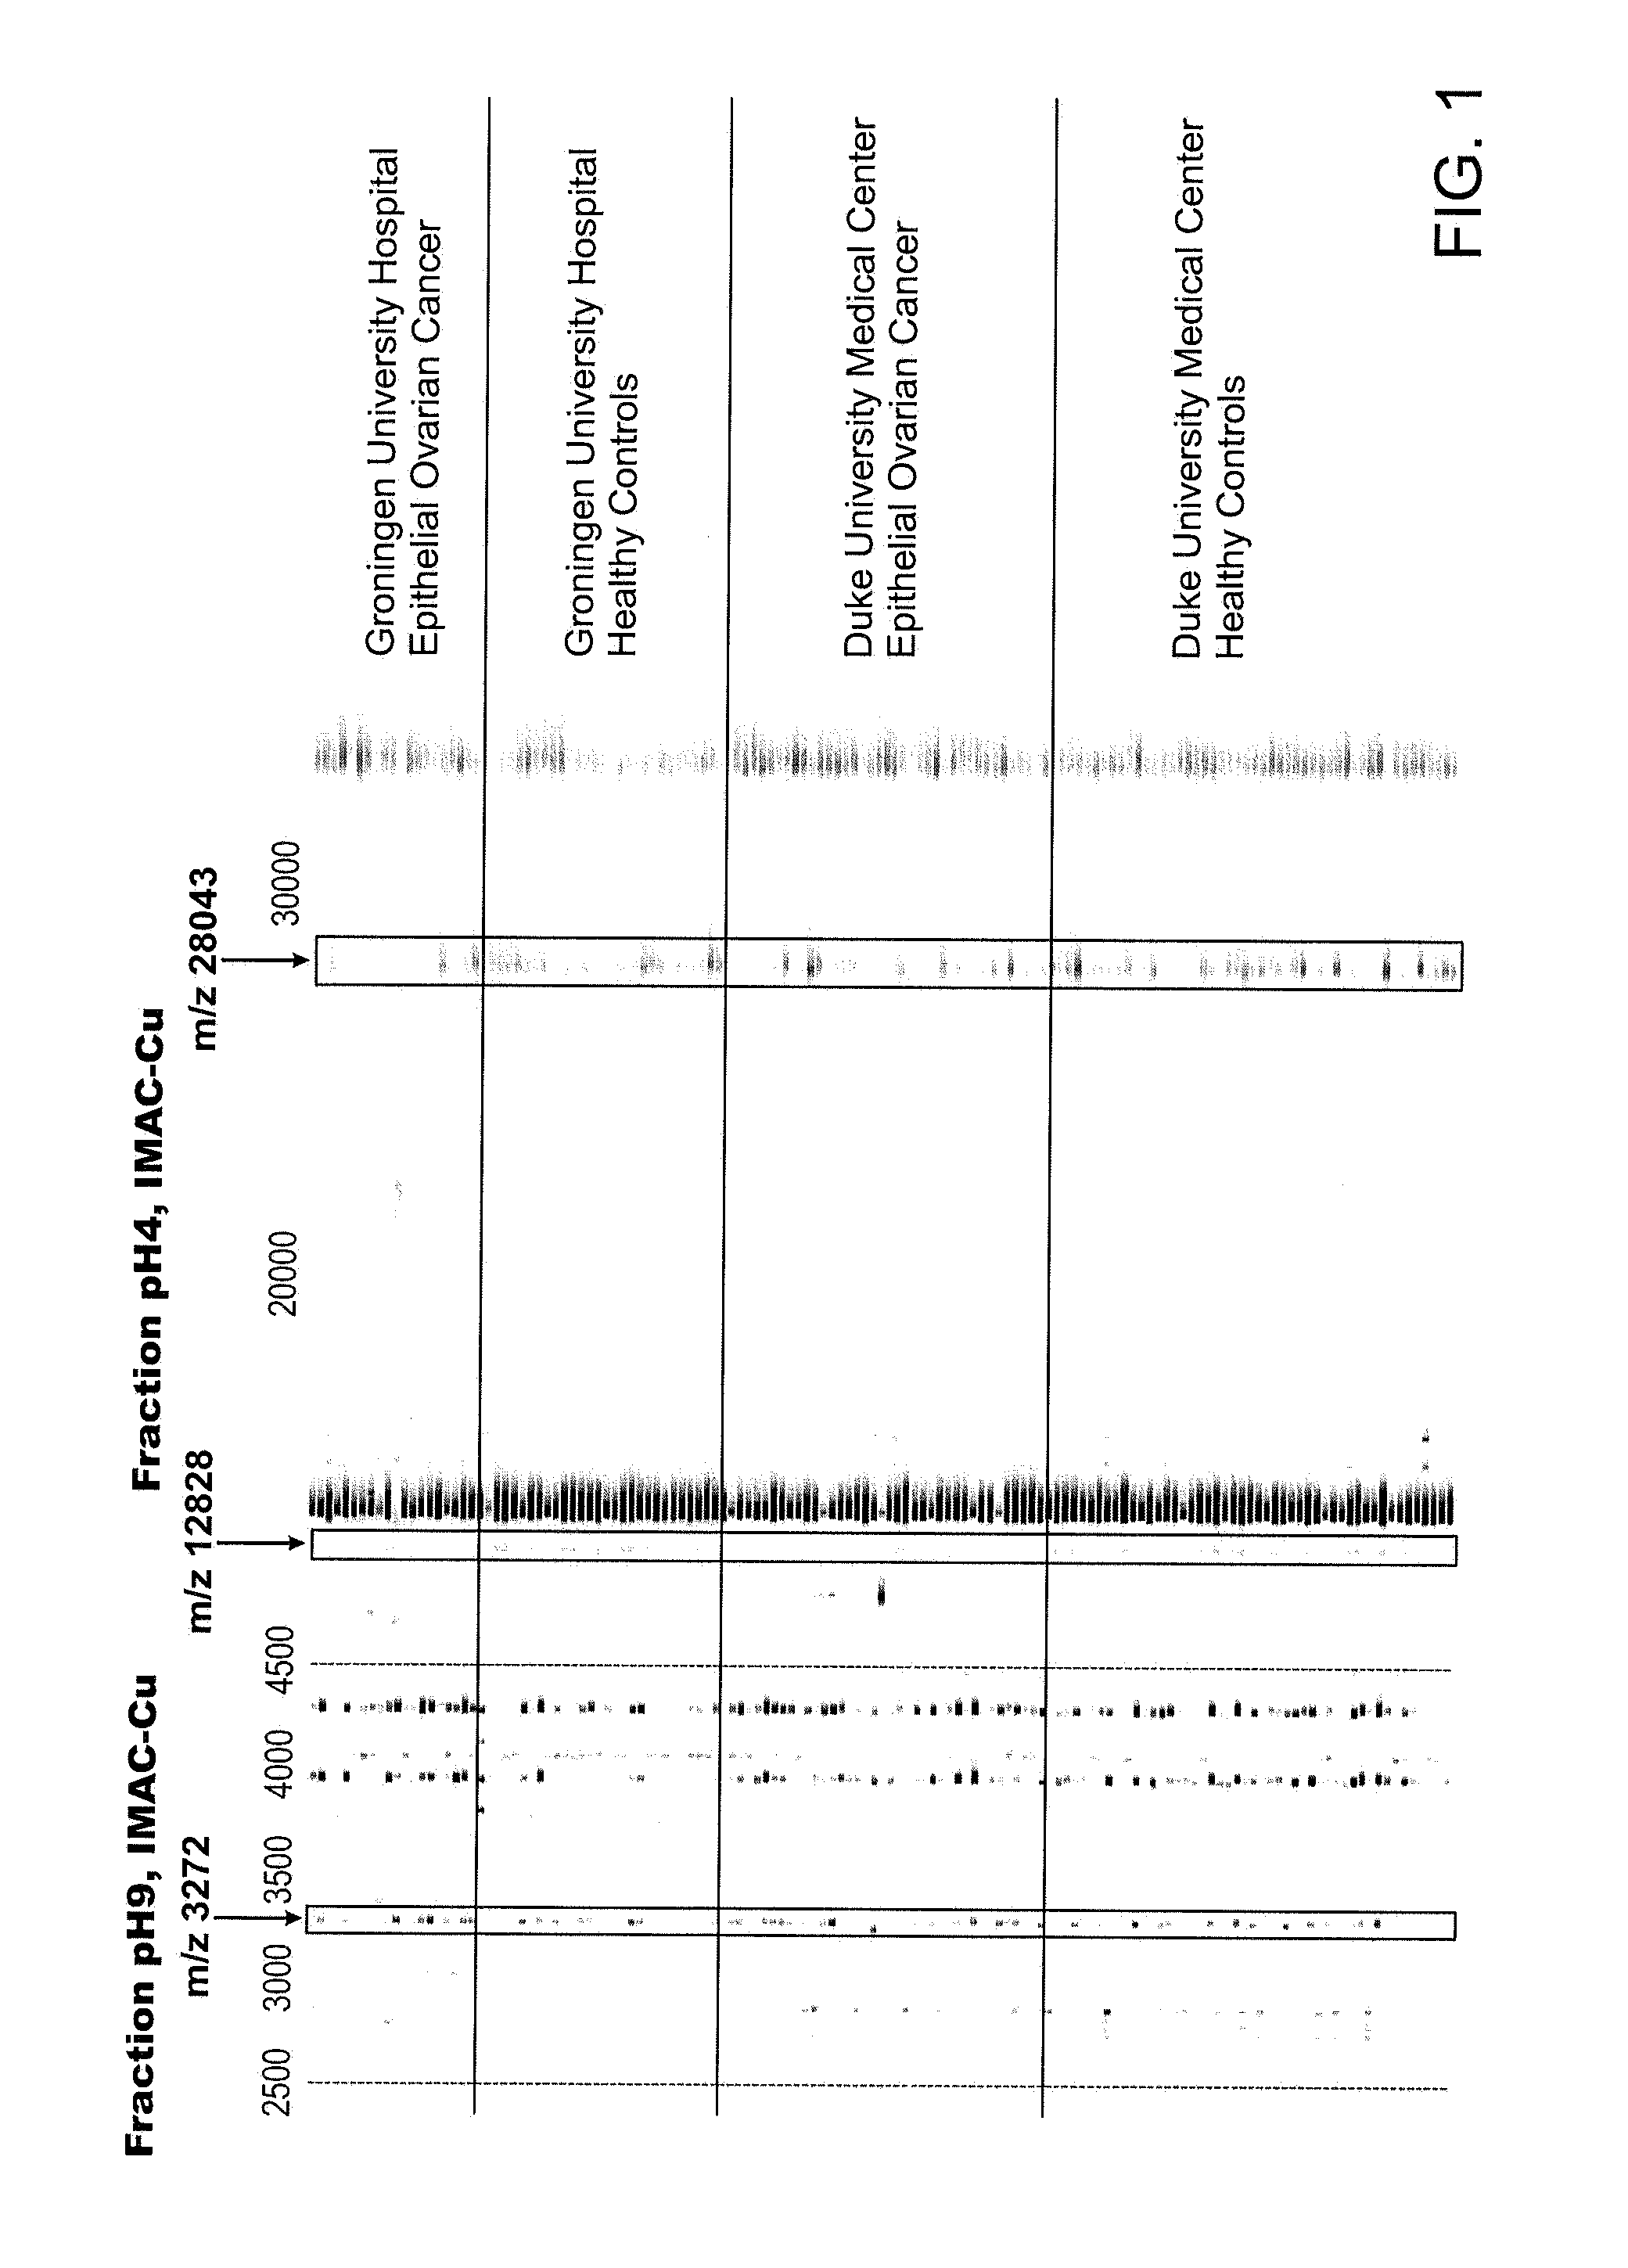
[0192]Serum fractionation: Serum samples were thawed on ice and then centrifuged at 20000 g for 10 minutes to remove precipitate. 20 μl of serum were mixed with 30 μl of a denaturing buffer (U9: 9 M urea, 2% CHAPS, 50 mM Tris pH 9.0) and vortexed for twenty minutes at 4 degrees. For each sample, 180 μl of Hyper Q DF anion exchange resin was equilibrated in 200 μl of U1 buffer (U9 that was diluted 1:9 in 50 mM Tris pH 9.0) three times. The denatured serum was applied to the resin and allowed to bind for thirty minutes. The unbound material was collected and then 100 μl of 50 mM Tris 9.0 containing 0.1% OGP was added to the resin. This wash was collected and combined with the unbound material (flow through; fraction 1). Fractions were then collected in a stepwise pH gradient using two times 100 ul each aliquots of wash buffers at pH 7, 5, 4, 3, and organic solvent). This led to the collection of a total of six fractions. Fractionation was performed on a Bio...

example 2

Statistical Analysis

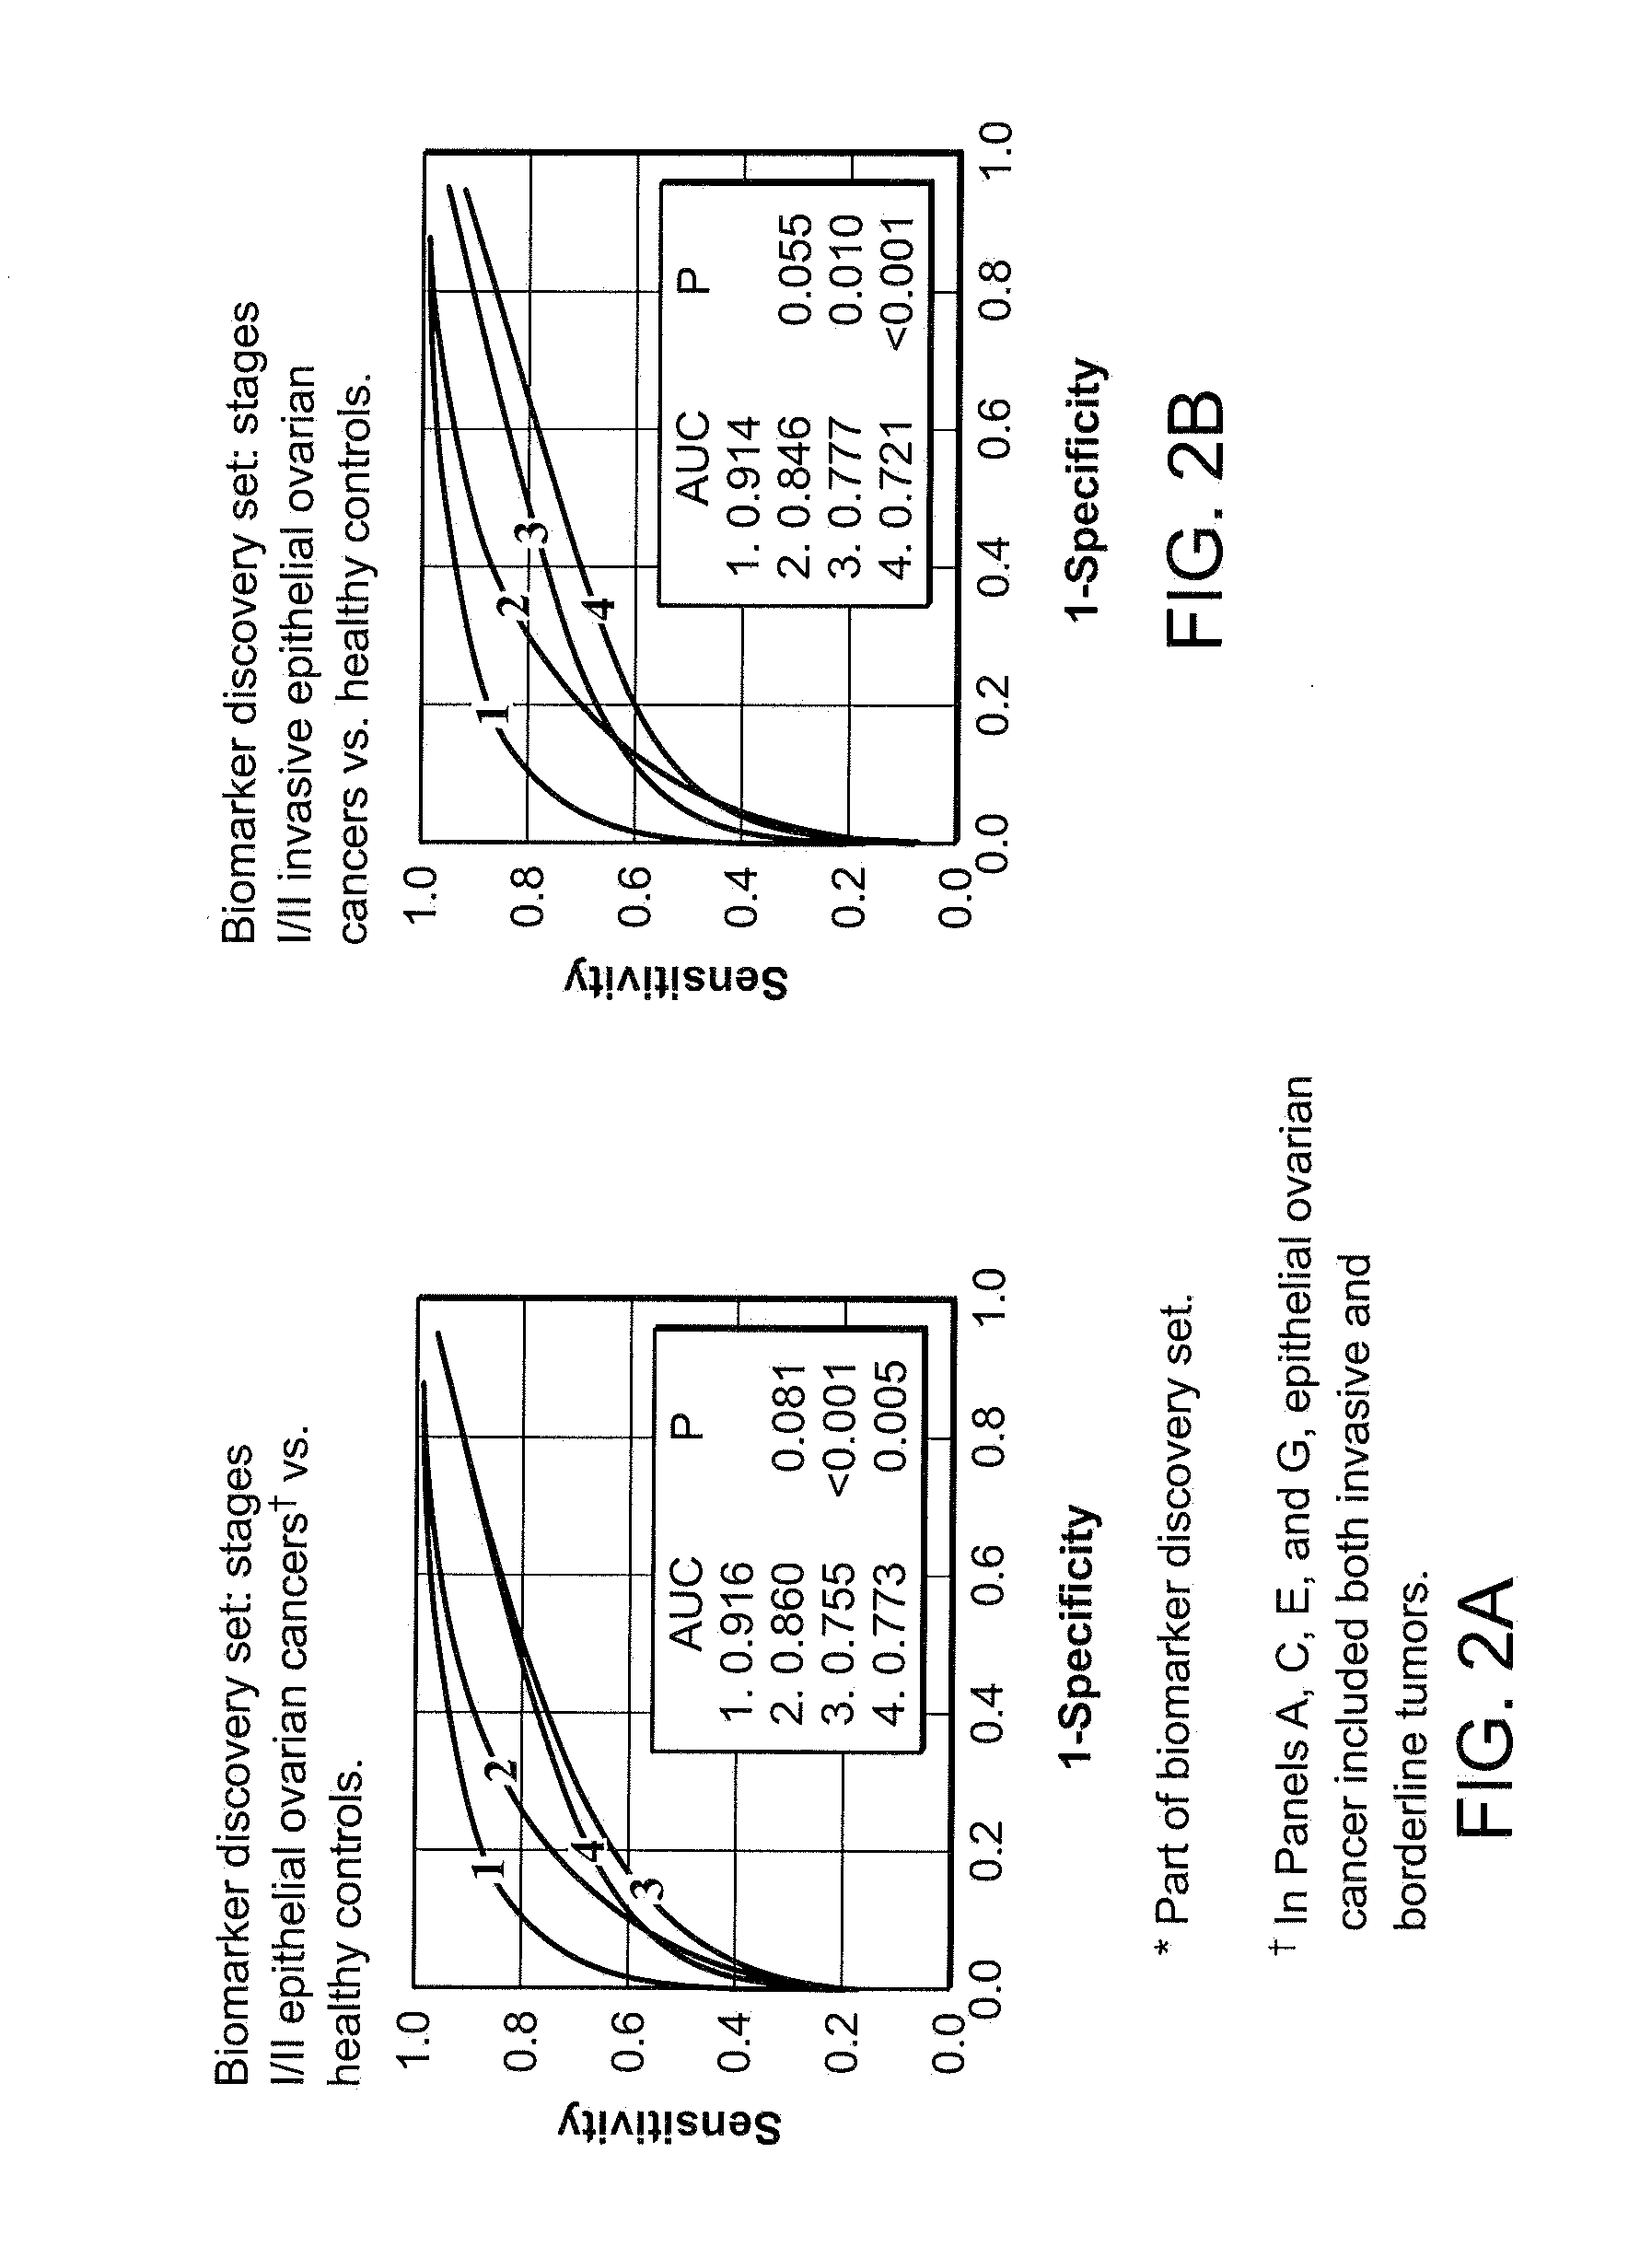
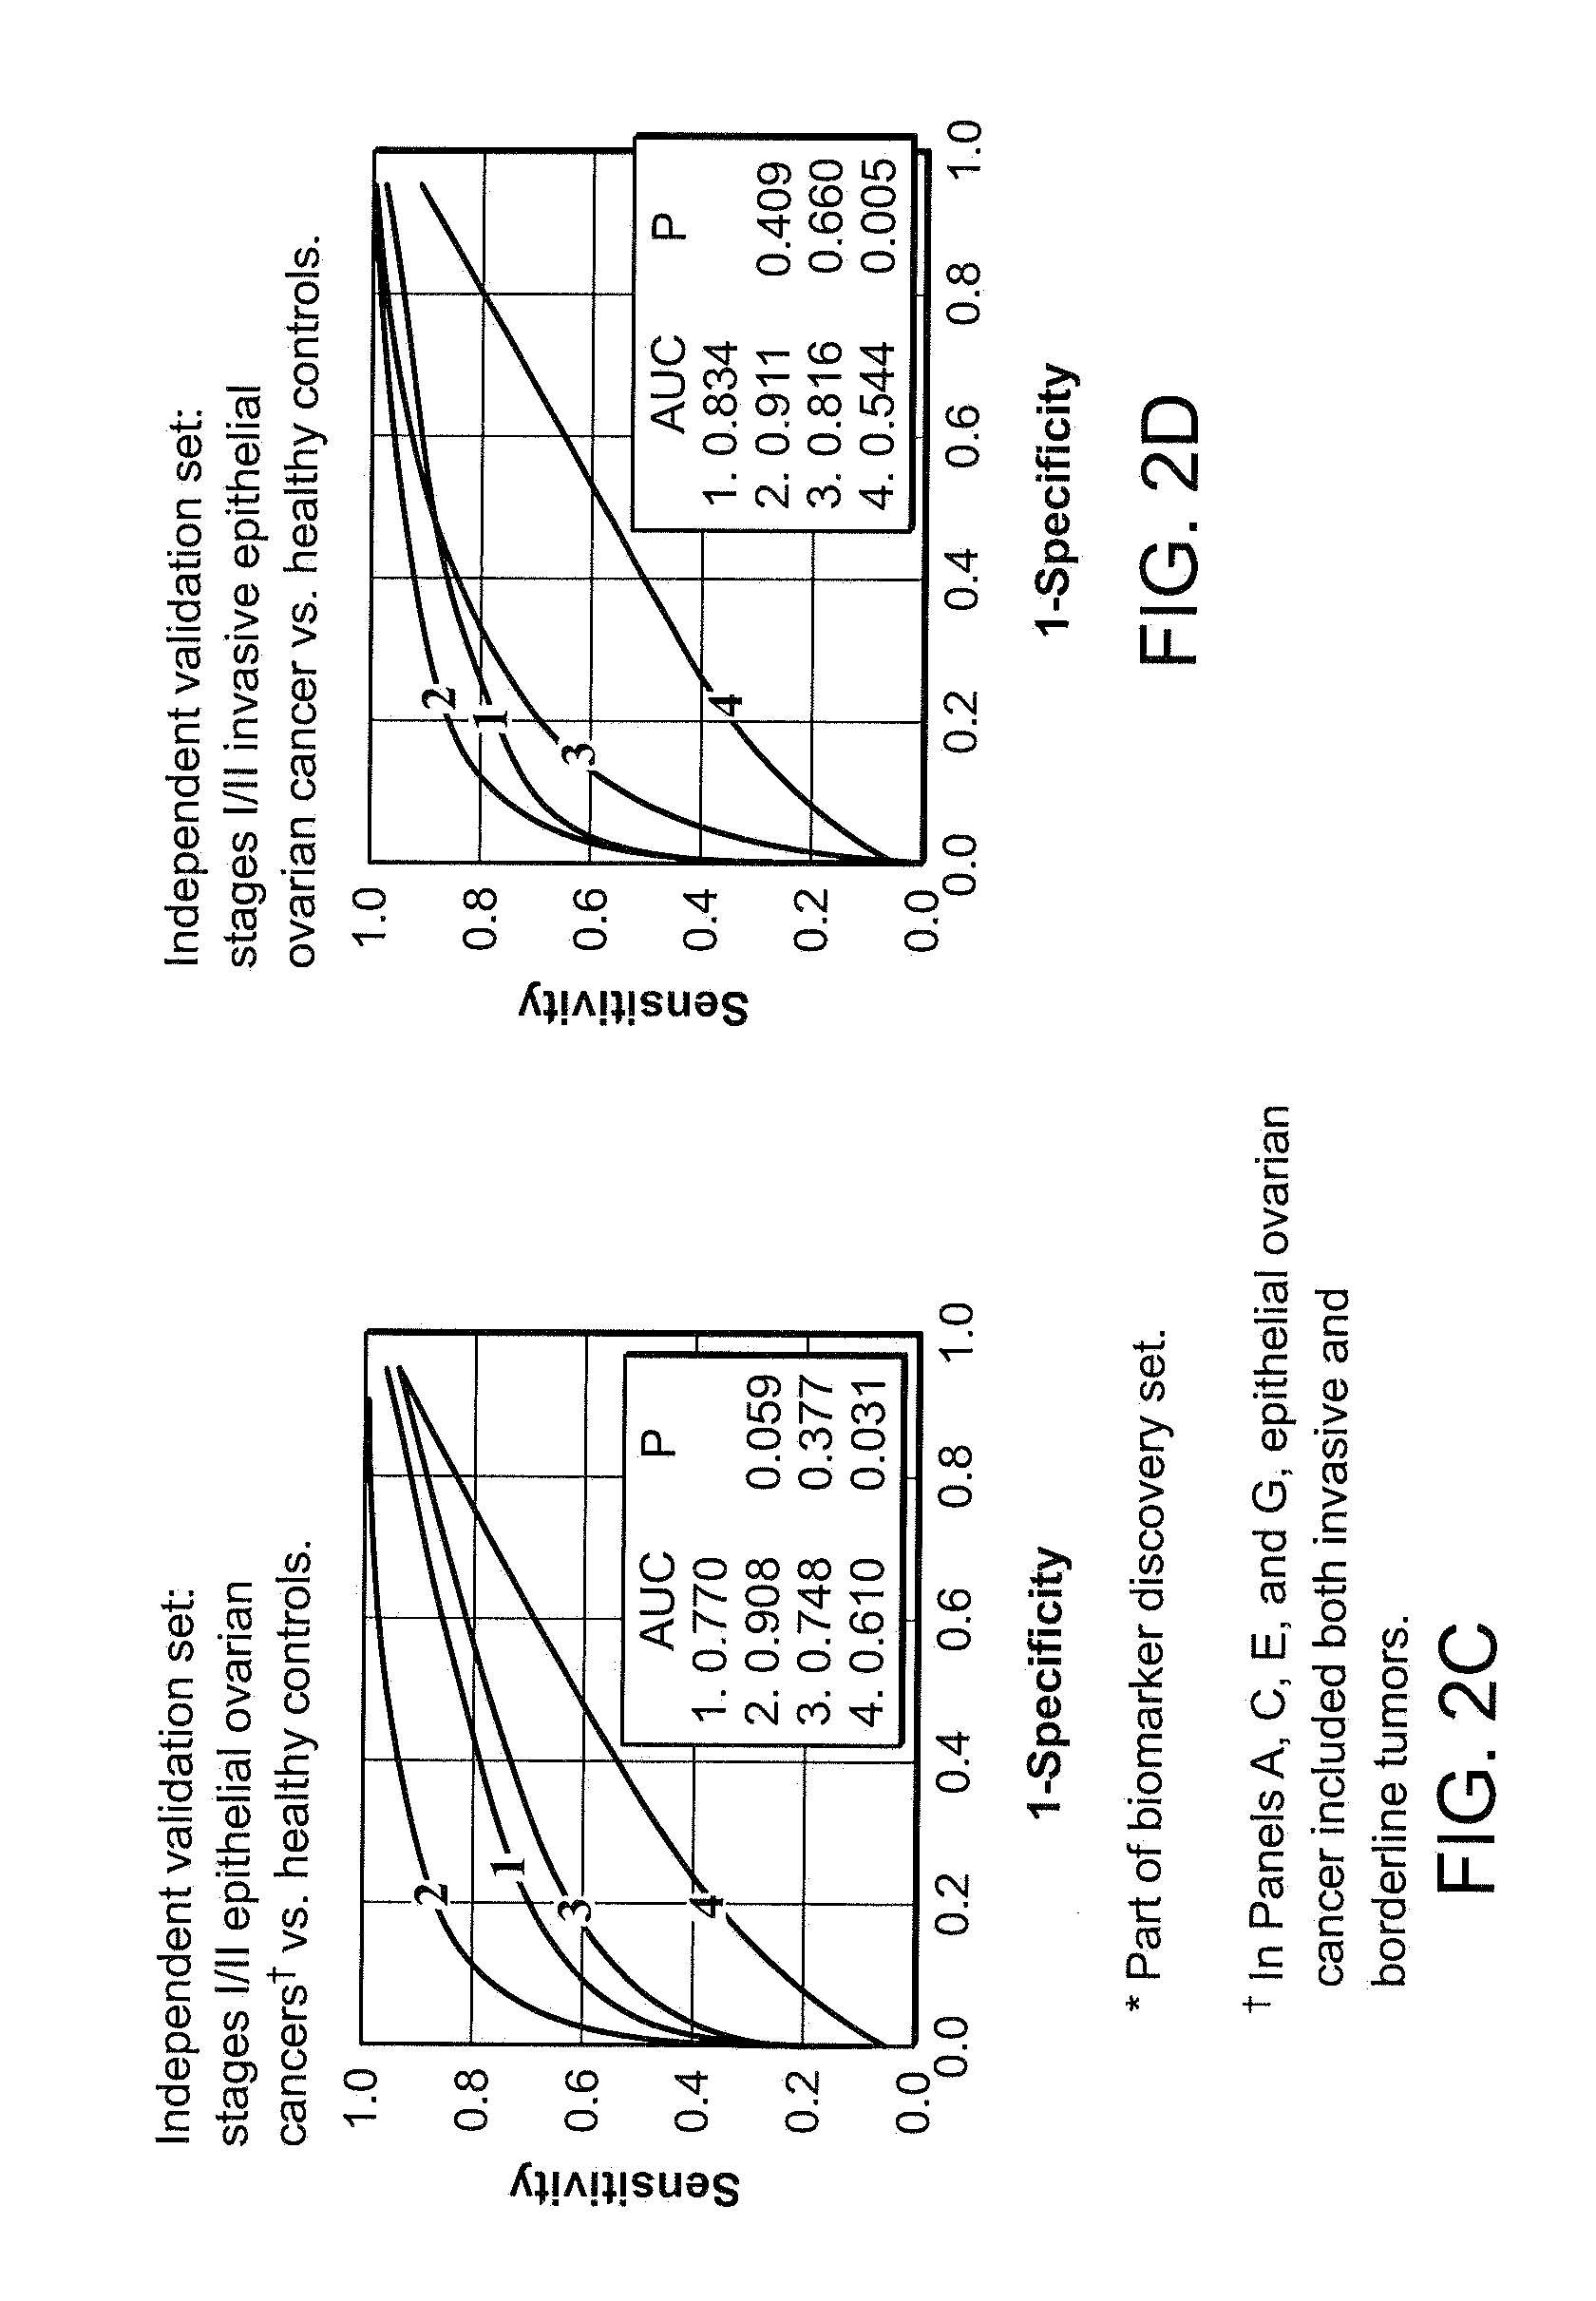
[0203]Biomarker discovery: Qualified mass peaks (S / N>5, cluster mass window at 0.3%) within the mass range of M / Z 2 kD-50 kD were selected from the SELDI spectra. In order to obtain a more consistent level of data variance across the range of spectrum of interest, logarithmic transformation was applied to the peak intensity prior to further analysis. The peak intensity data of early stage epithelial ovarian cancer patients and healthy controls from Duke University Medical Center (Ca n=36, HC n=47) and Groningen University Hospital (Ca n=20, HC n=30) were analyzed using the Unified Maximum Separability Analysis (UMSA) algorithm that was first used for microarray data analysis and subsequently for protein expression data (ProPeak, 3Z Informatics). ((Li J, et al., Clin Chem 2002; 48:1296-304; Rai A J, et al., Zhang Z, et al. Arch Pathol Lab Med 2002; 126:1518-26; Zhang Z, et al., Applying classification separability analysis to microarray data. In: Lin S M, Johnson ...

example 3

Purification of Biomarkers

[0205]For all markers, serum was initially fractionated using the anion exchange protocol used for the protein expression profiling. For each purification step, fractions were monitored either on NP20 or IMAC-copper ProteinChip arrays.

Purification of the 28 kD marker: 1 ml of the pH 4 fraction from the anion exchange separation was added to 500 ul of RPC PolyBio 10-15 (Biosepra) and incubated at 40 C for 1 hour. Fractions containing increasing amounts of acetonitrile with 0.1% trifluoroacetic acid were collected. The 75% acetonitrile / 0.1% trifluoracetic acid fraction was dried down by speed-vac and rehydrated in 100 ul SDS-tricine sample loading buffer without DTT. 40 ul sample was loaded onto 16% tricine gel and run at 100 mV for 4 hrs. The gel was destained with colloid blue kit (Pierce) and the 28 kDa was excised.

Purification of the 12.8 kDa marker: 10 ml of the pH 4 fraction from the anion exchange separation was adjusted to pH 7.5 with 1 M Tris HCl, pH...


PUM

PropertyMeasurementUnit
pHaaaaaaaaaa
pHaaaaaaaaaa
pHaaaaaaaaaa

Abstract

The present invention relates to a method of qualifying ovarian cancer status in a subject comprising: (a) measuring at least one biomarker in a sample from the subject and (b) correlating the measurement with ovarian cancer status. The invention further relates to kits for qualifying ovarian cancer status in a subject.

Description

[0001]The identification of tumor markers suitable for the early detection and diagnosis of cancer holds great promise to improve the clinical outcome of patients. It is especially important for patients presenting with vague or no symptoms or with tumors that are relatively inaccessible to physical examination. Despite considerable effort directed at early detection, no cost effective screening tests have been developed (Paley P J., Curr Opin Oncol, 2001; 13(5):399-402) and women generally present with disseminated disease at diagnosis. (Ozols R F, et al., Epithelial ovarian cancer. In: Hoskins W J, Perez C A, Young R C, editors. Principles and Practice of Gynecologic Oncology. 3rd ed. Philadelphia: Lippincott, Williams and Wilkins; 2000. p. 981-1057).[0002]The best-characterized tumor marker, CA125, is negative in approximately 30-40% of stage I ovarian carcinomas and its levels are elevated in a variety of benign diseases. (Meyer T, et al., Br J Cancer, 2000; 82(9):1535-8; Buamah...

Claims


Application Information

Patent Timeline
Patent Type & Authority Applications(United States)
IPC IPC(8): G01N33/68C12Q1/37G01N33/566C07K14/81A61BC07H21/02C07H21/04C12P19/34C12Q1/25C12Q1/68G01NG01N30/72G01N30/96G01N33/48G01N33/52G01N33/574G06F19/00
CPCG01N33/57449G01N33/543Y10S436/824Y10S436/813Y10S435/967Y10T436/24Y10S436/815Y10S436/825Y10S435/973Y10S435/807Y10T436/255Y10S436/811A61P35/00Y02A90/10G01N33/574C12Q1/25
Inventor CHAN, DANIEL W.ZHANG, ZHENFUNG, ERICMENG, XIAO-YING
Owner THE JOHN HOPKINS UNIV SCHOOL OF MEDICINE
Why Eureka
Eureka Blog
Learn More