System for rapid high-resolution gel electrophoresis
- Summary
- Abstract
- Description
- Claims
- Application Information
AI Technical Summary
Benefits of technology
Problems solved by technology
Method used
Image
Examples
example 1
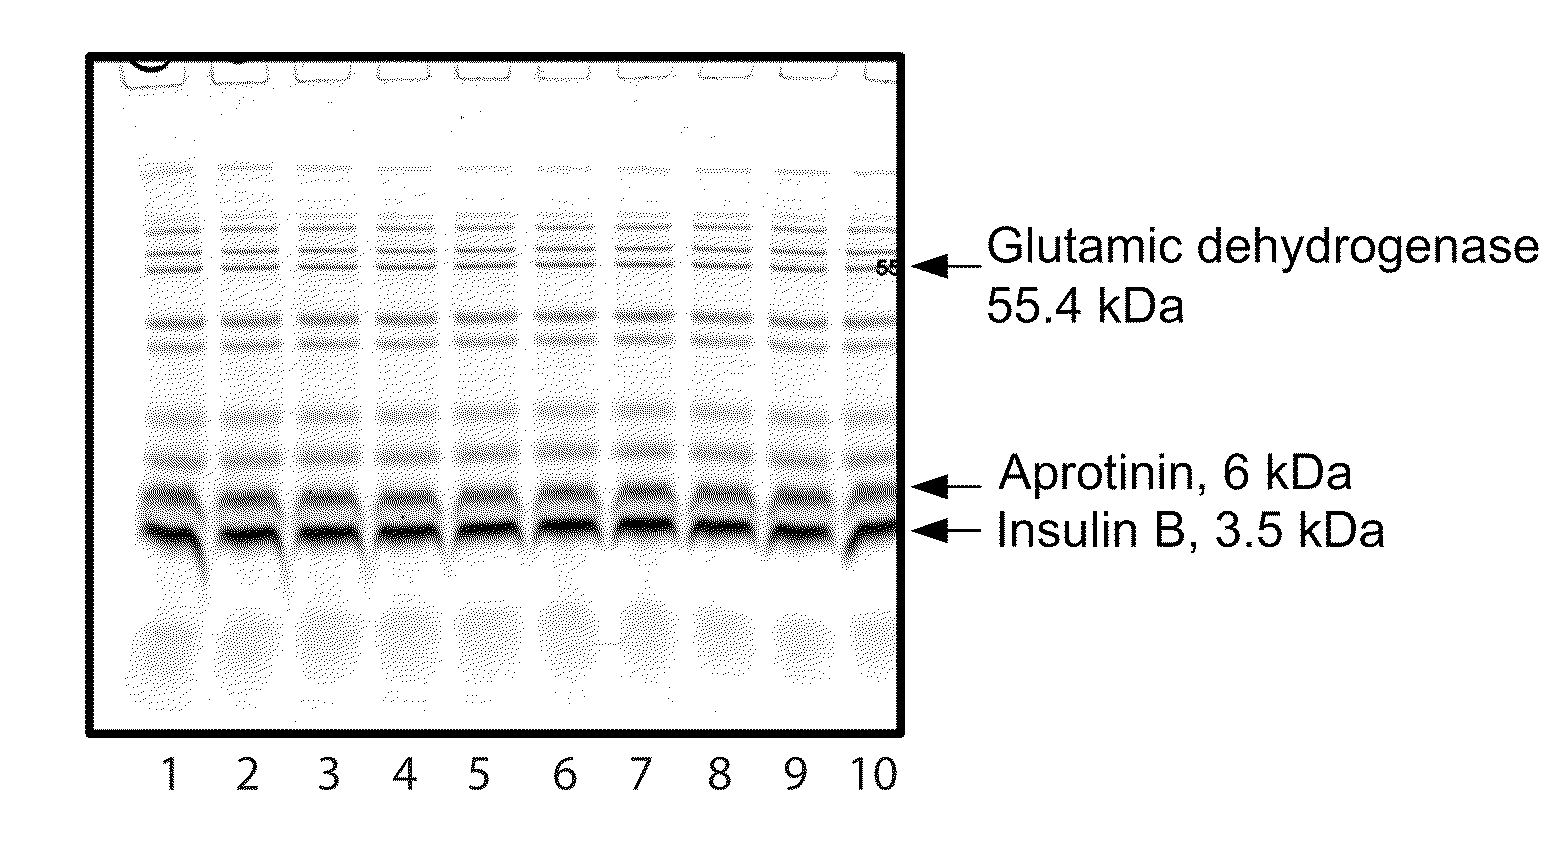
[0098]The first test gel formulation examined was an 8% SDS-PAGE resolving gel having the following composition: 100 mM Bis-Tris, 75 mM Tricine, 4 vol. % sucrose, and 20 mM BES. The stacking gel had the following composition: 357 mM Bis-Tris and 210 mM Chloride, pH 6.5 cast on top of the resolving gel. The S:R ratio of the gel was 1:4.
[0099]Five (5) μL of Mark12™ protein marker with Ponceau S tracking dye was loaded in each lane of the gel and the gel was run at 300 V for 15 minutes in NuPAGE® MES SDS Running Buffer (Invitrogen Corp., Carlsbad, Calif.). Completion of the gel run was determined based on the migration of Ponceau S tracking dye added separately to each sample to the bottom of the gel. At the completion of the run, the gel was stained with Coomassie® G-250 using SimplyBlue™ SafeStain (from Invitrogen Corp, Carlsbad, Calif.).
[0100]FIG. 1 shows the migration pattern of the marker bands resulting from this gel formulation. The 3.5 kDa insulin B band (indicated in FIG. 1) o...
example 2
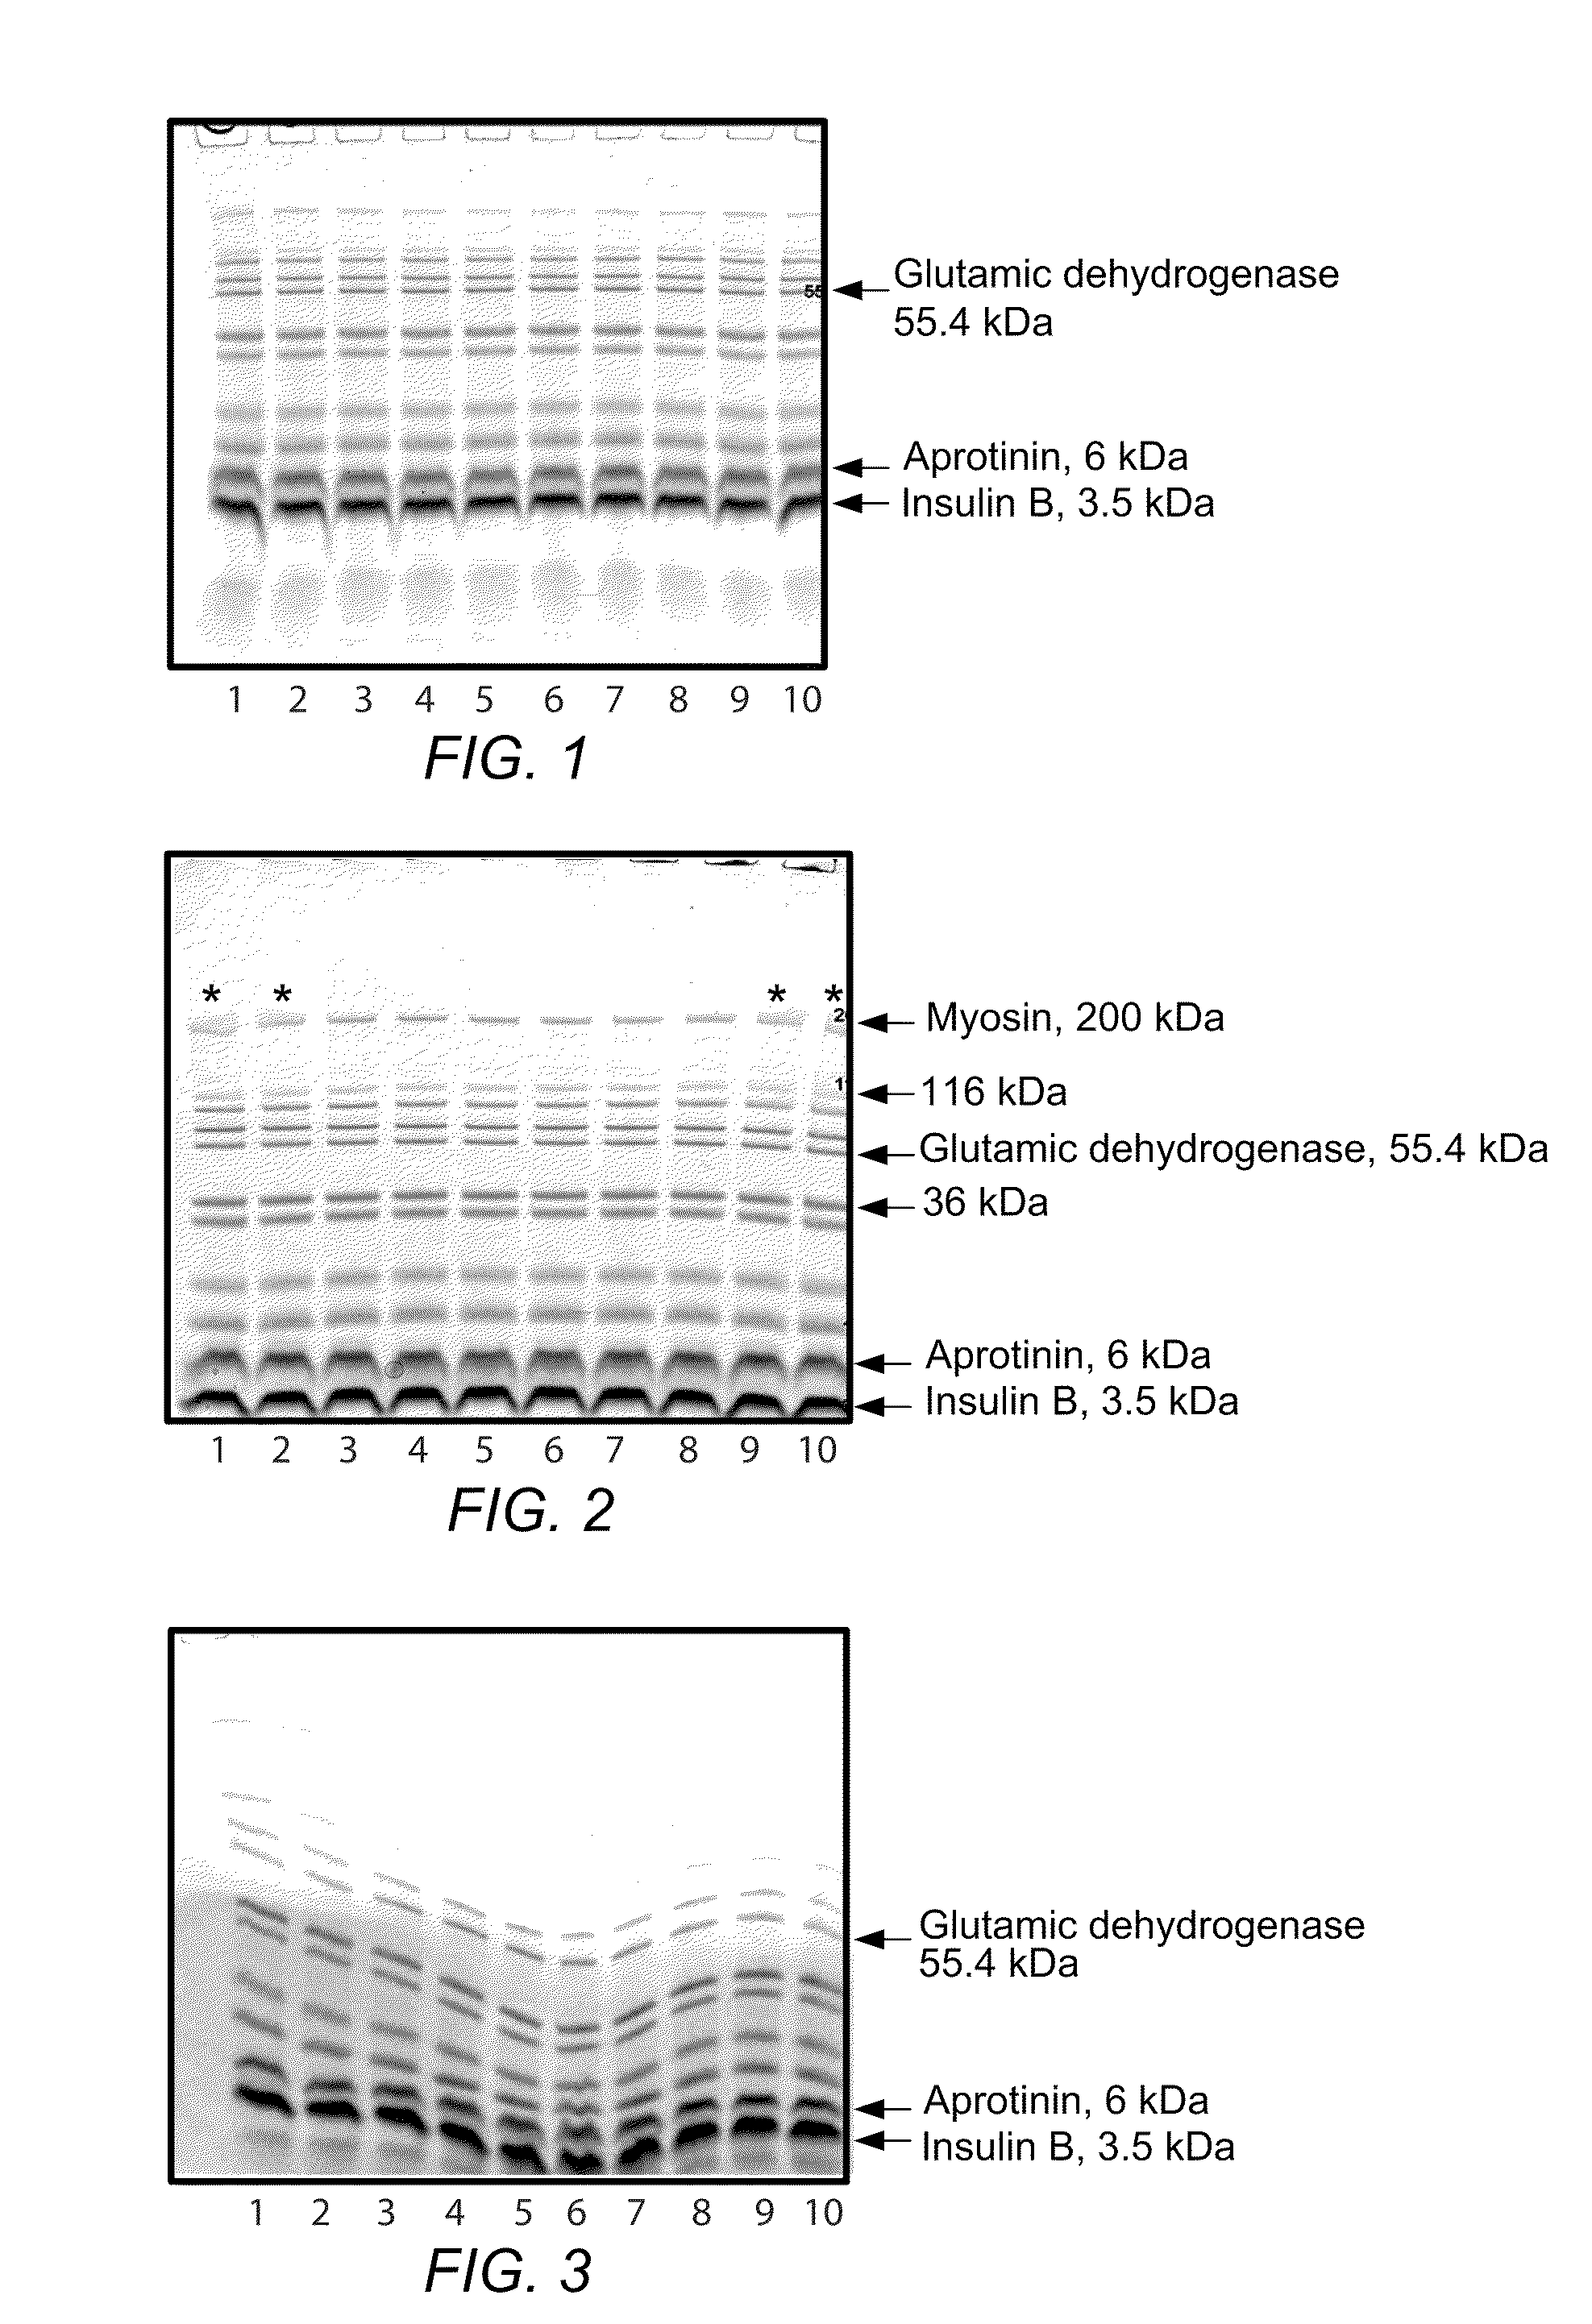
[0101]An SDS-PAGE test gel was cast essentially as described in Example 1, except that the S:R ratio was changed to 41:59 in an attempt to improve the stacking and separation of bands migrating higher than the 55.4 kDa glutamic dehydrogenase band. Five (5) μL of Mark12™ protein marker was loaded in each lane of the gel and the gel was run at 300 V for 16 minutes in MES SDS Running Buffer. Completion of the gel run was determined based on the migration the Ponceau S tracking dye to the bottom of the gel and the gel was stained with SimplyBlue™ SafeStain as above.
[0102]The resulting gel (FIG. 2) shows the migration pattern of the marker bands resulting from this gel formulation. The 3.5 kDa Insulin B band migrated the entire length of the gel, although an additional 1 min of run time was required. The 200 kDa myosin band in the outermost lanes (i.e., lanes 1, 2, 9 and 10; indicated by the asterisk) was more diffuse than the corresponding band seen in lanes 3-8. Additionally, bands mig...
example 3
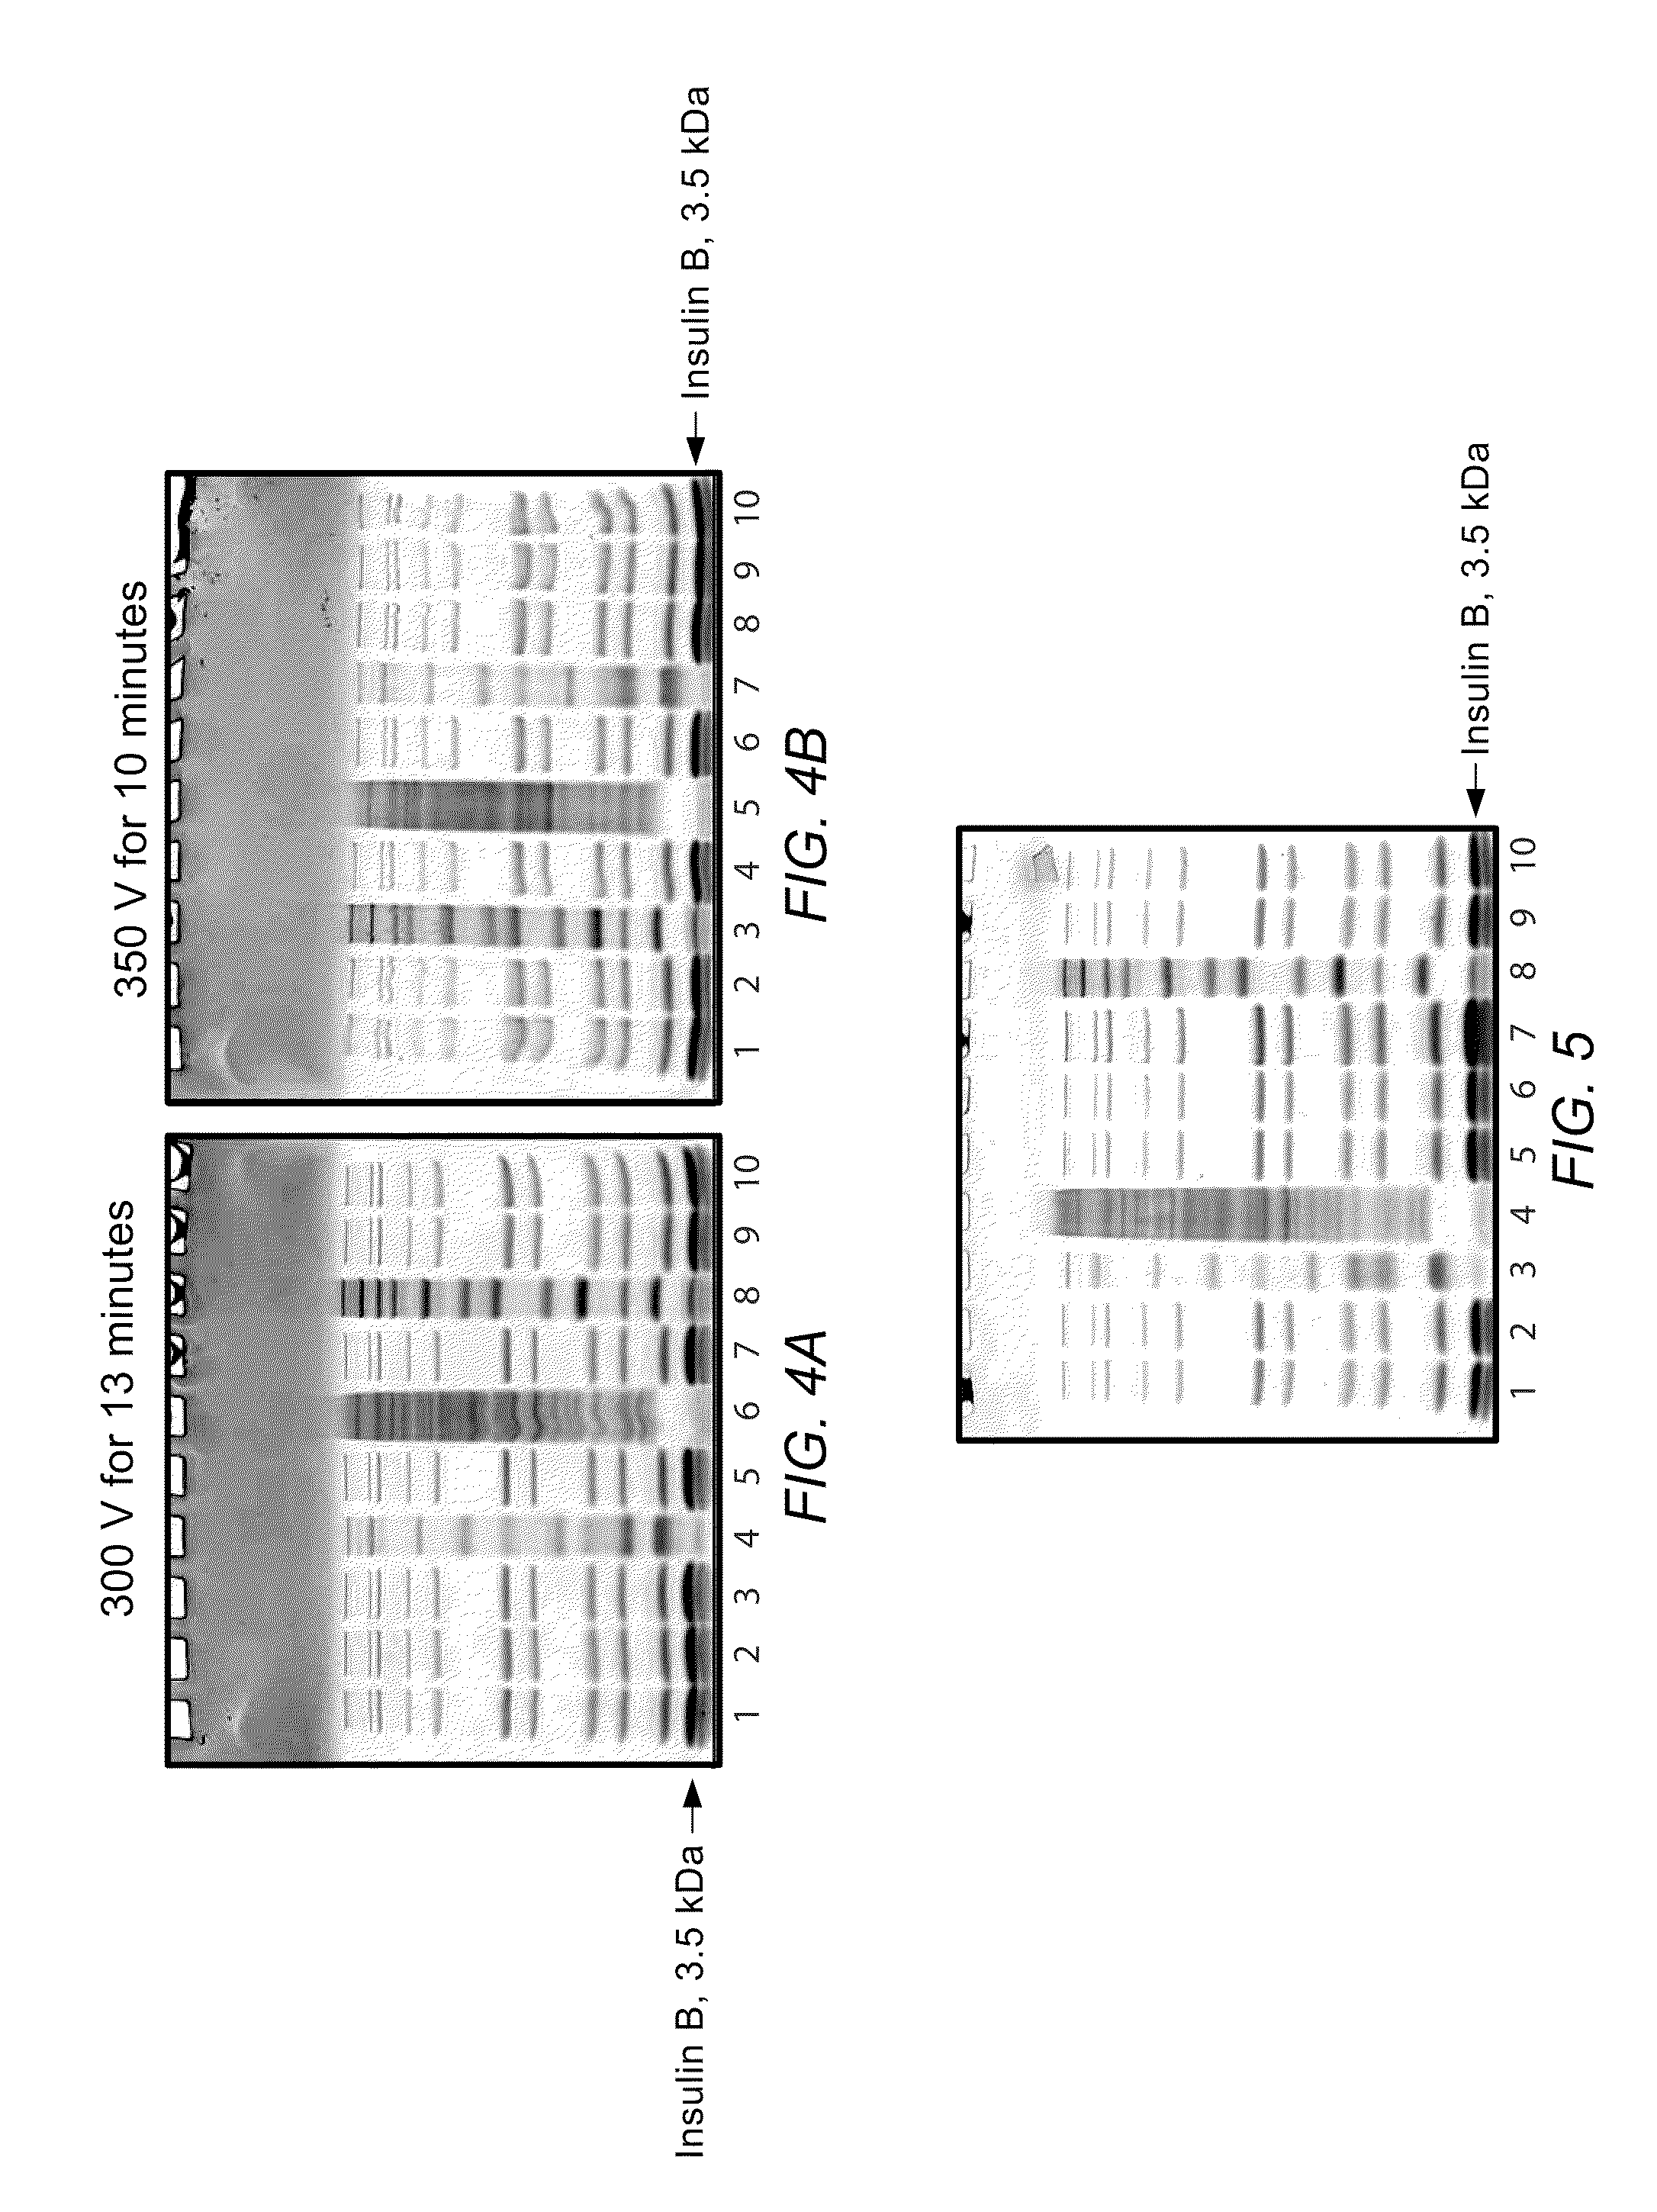
[0103]An SDS-PAGE test gel was cast essentially as described in Example 2, with the following changes: the 8% (8% T / 4.4% C) resolving gel was made using 100 mM Bis-Tris and 100 mM Tricine. The 4% (4% T / 3.8% C) stacking gel cast over the resolving gel had a pH of 6.1 and was made using 357 mM Bis-Tris and 150 mM sulfuric acid. In this example, sulfuric acid was used in order to provide a leading ion (SO4−2) that migrated slower than Cl−. The S:R ratio of the gel was 41:59. Five (5) μL of Mark12™ protein marker was loaded in each lane of the gel and the gel was run at 300 V for 18 minutes in MES SDS Running Buffer. Completion of the gel run was determined based on the migration of the Ponceau S tracking dye to the bottom of the gel after which the gel was stained with SimplyBlue™ SafeStain as above.
[0104]FIG. 3 shows the migration pattern of the marker bands resulting from this gel formulation. As shown, the use of sulfuric acid in the stacking gel yielded unsatisfactory results and a...
PUM
 Abstract
Description
Claims
Application Information
 - R&D
- Intellectual Property
- Life Sciences
- Materials
- Tech Scout
- Unparalleled Data Quality
- Higher Quality Content
- 60% Fewer Hallucinations
Browse by: Latest US Patents, China's latest patents, Technical Efficacy Thesaurus, Application Domain, Technology Topic, Popular Technical Reports.
© 2025 PatSnap. All rights reserved.Legal|Privacy policy|Modern Slavery Act Transparency Statement|Sitemap|About US| Contact US: help@patsnap.com


