

Real-time monitoring of depletion of high-abundance blood proteins or recovery of low-abundance blood proteins by UV spectrometry
a high-abundance protein and real-time monitoring technology, applied in the field of real-time monitoring of high-abundance protein depletion or recovery of low-abundance blood proteins by uv spectrometry, can solve the problems of difficult to qualitatively and quantitatively analyze low to moderate biomarker candidates, difficult to detect biomarker candidates by protein analysis, and inability to guarantee the level of protein recovery of kits depleting albumin and igg, etc., to improve efficiency
- Summary
- Abstract
- Description
- Claims
- Application Information
AI Technical Summary
Benefits of technology
Problems solved by technology
Method used
Image

Examples
example 1
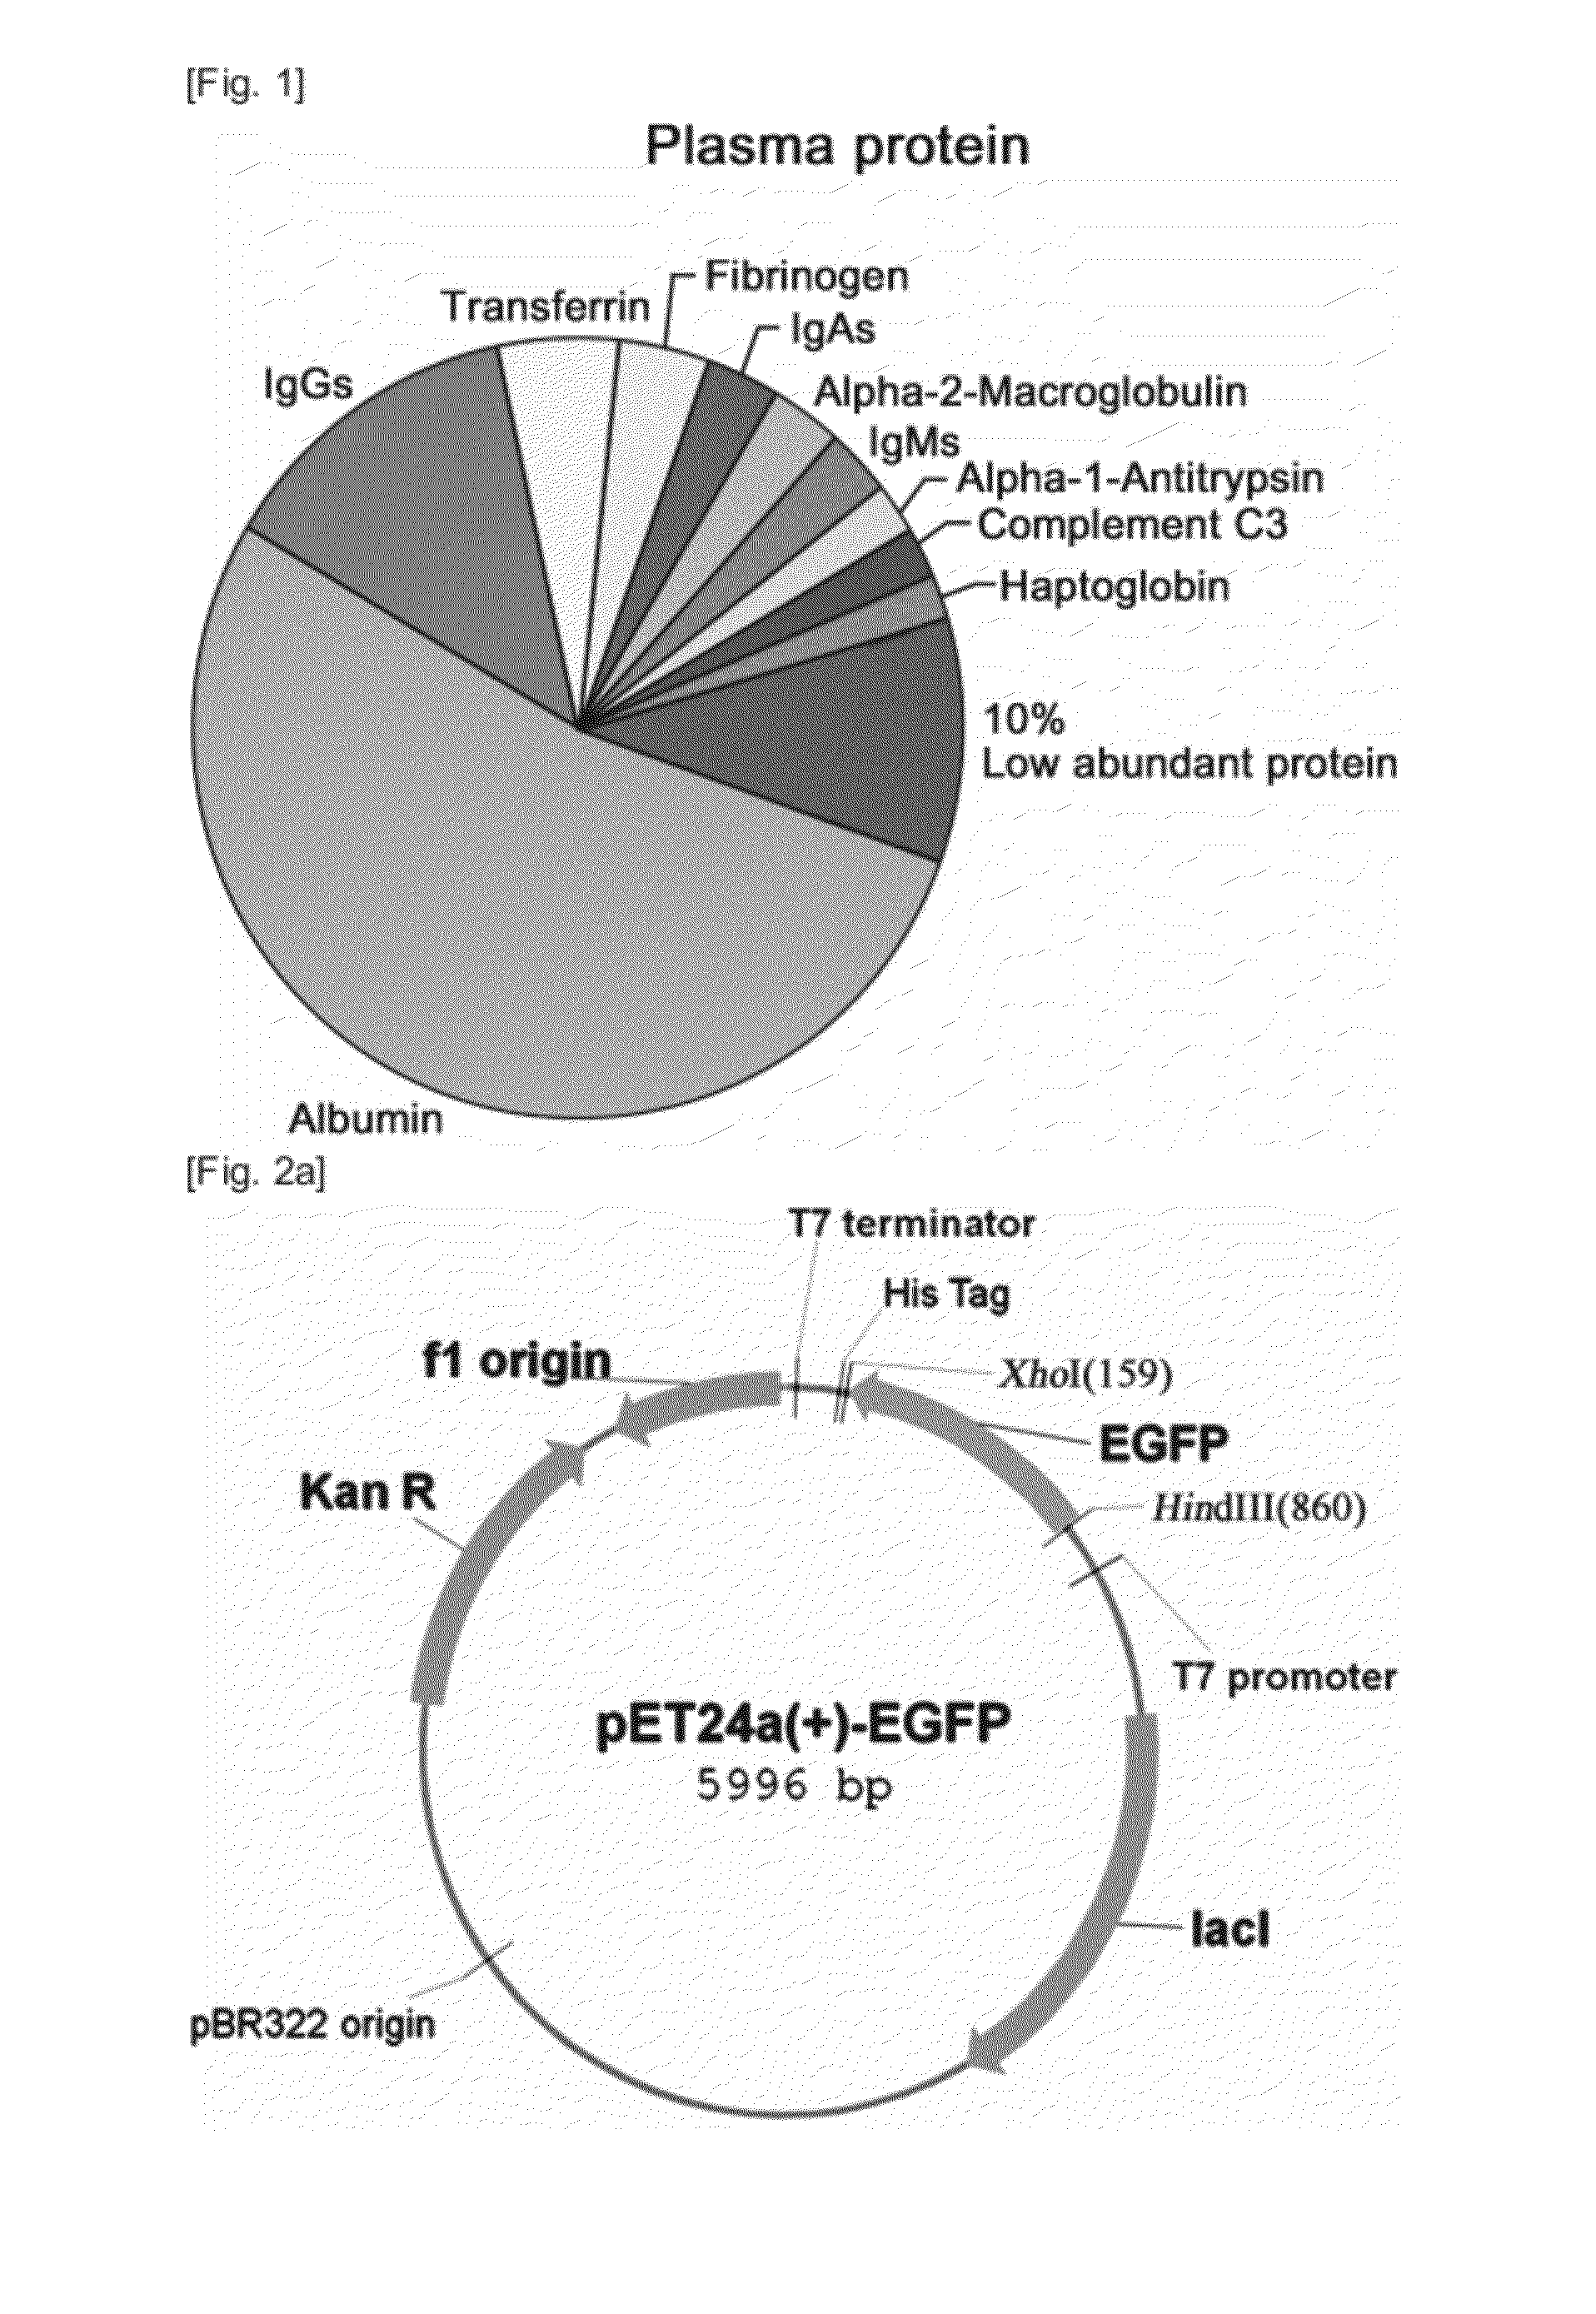
Preparation of Plasma Specimen
[0040]To reduce sampling bias due to the difference among individuals, 100 μl plasma samples were taken from each of ten healthy humans (five men and five women), followed by centrifugation at 15,000 rpm at 4° C. for 10 min to remove debris.
[0041]The centrifuged sample was divided into aliquots of 50 μl and stored at −80° C. until use. The aliquots were thawed at 4° C. for use in depletion experiments. Human plasma samples were provided from the Seoul National University Hospital, Korea. All of the subject individuals consented to participate in this research, and experiments were carried out according to the protocol approved by the Institutional Review Board of the Seoul National University Hospital, Korea.
example 2
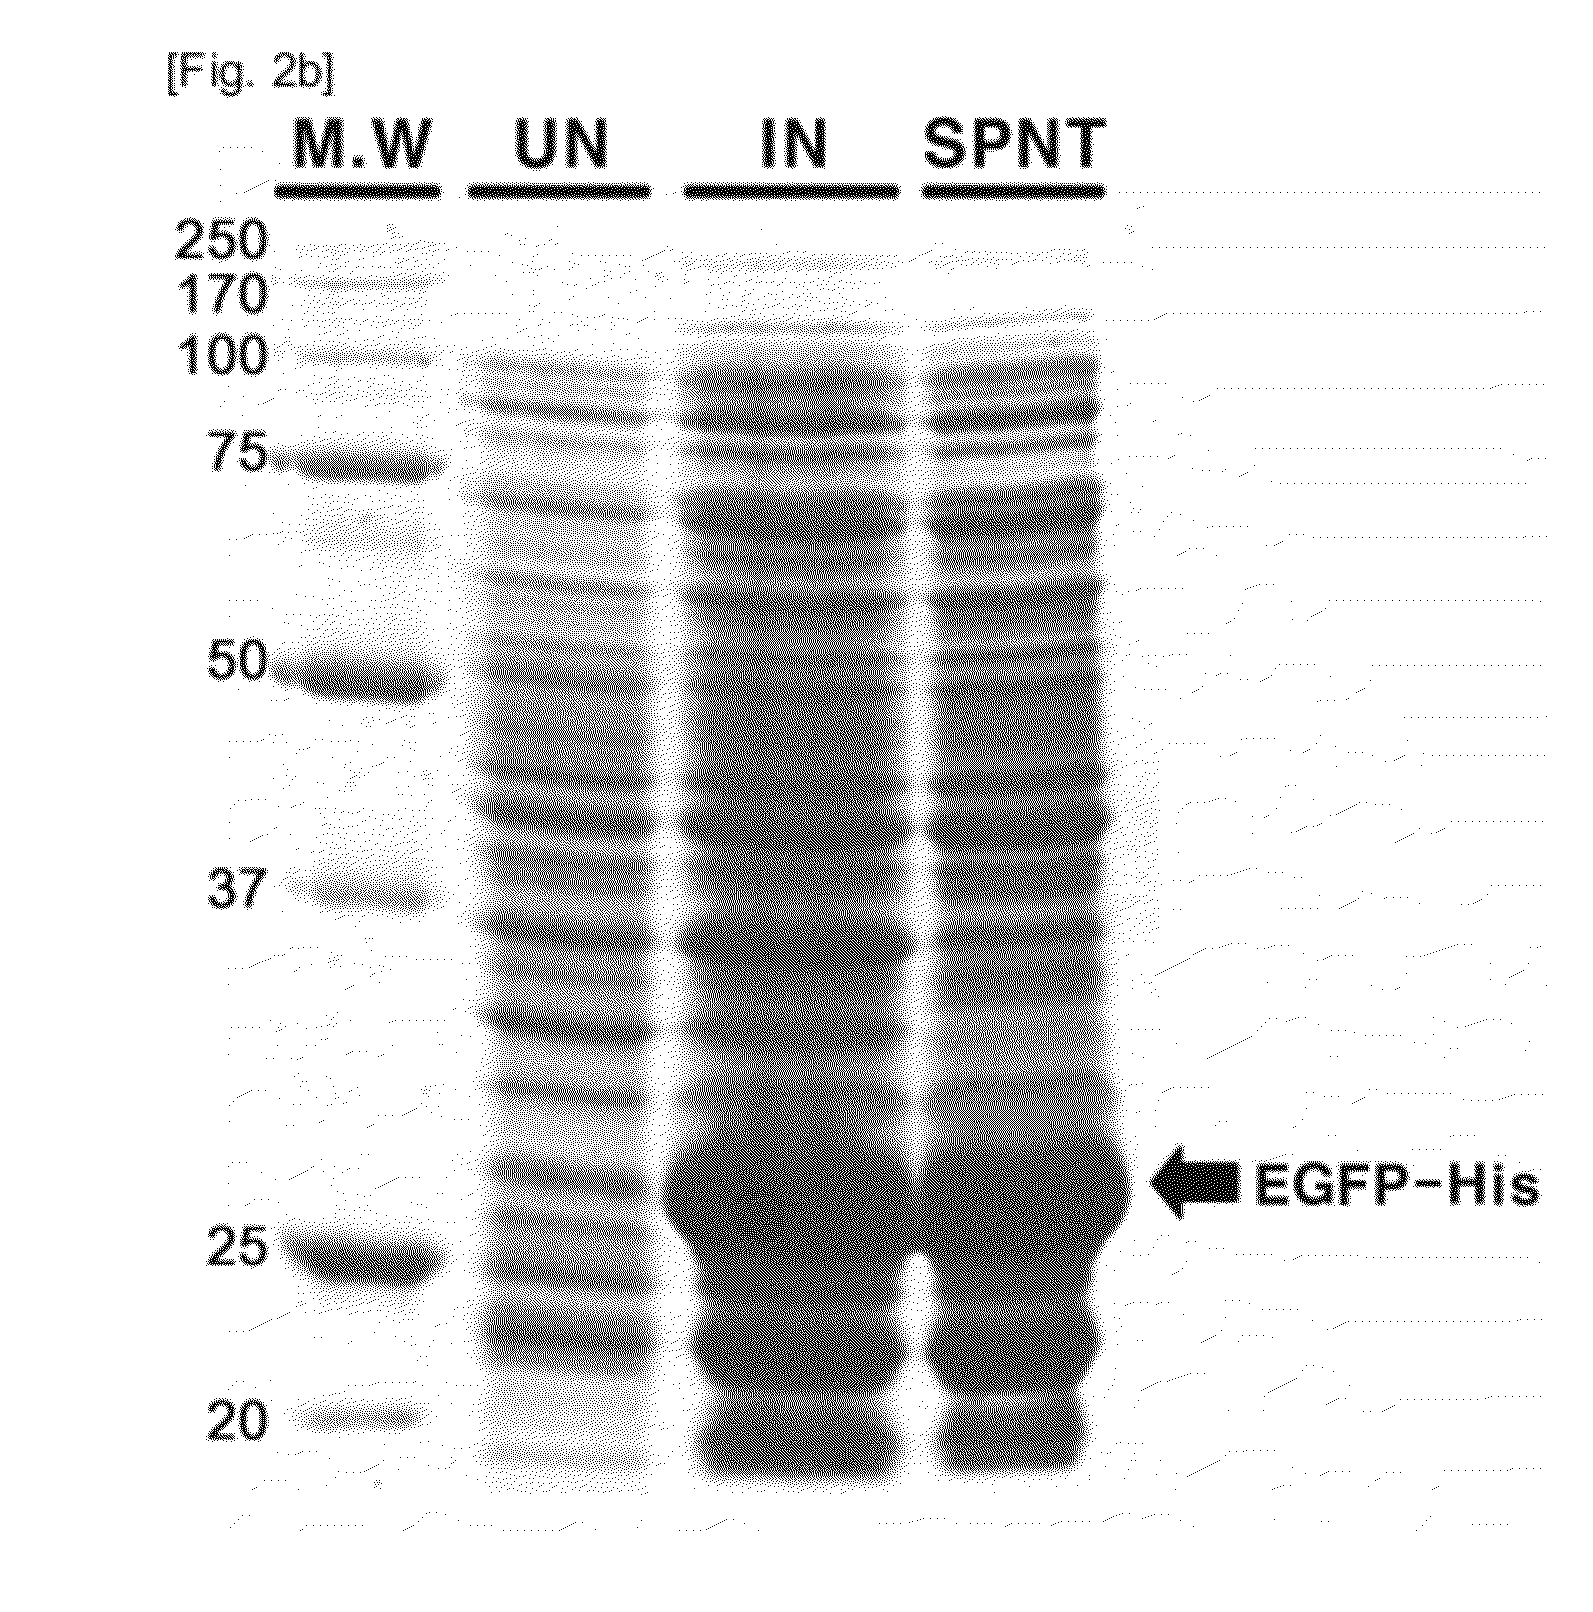
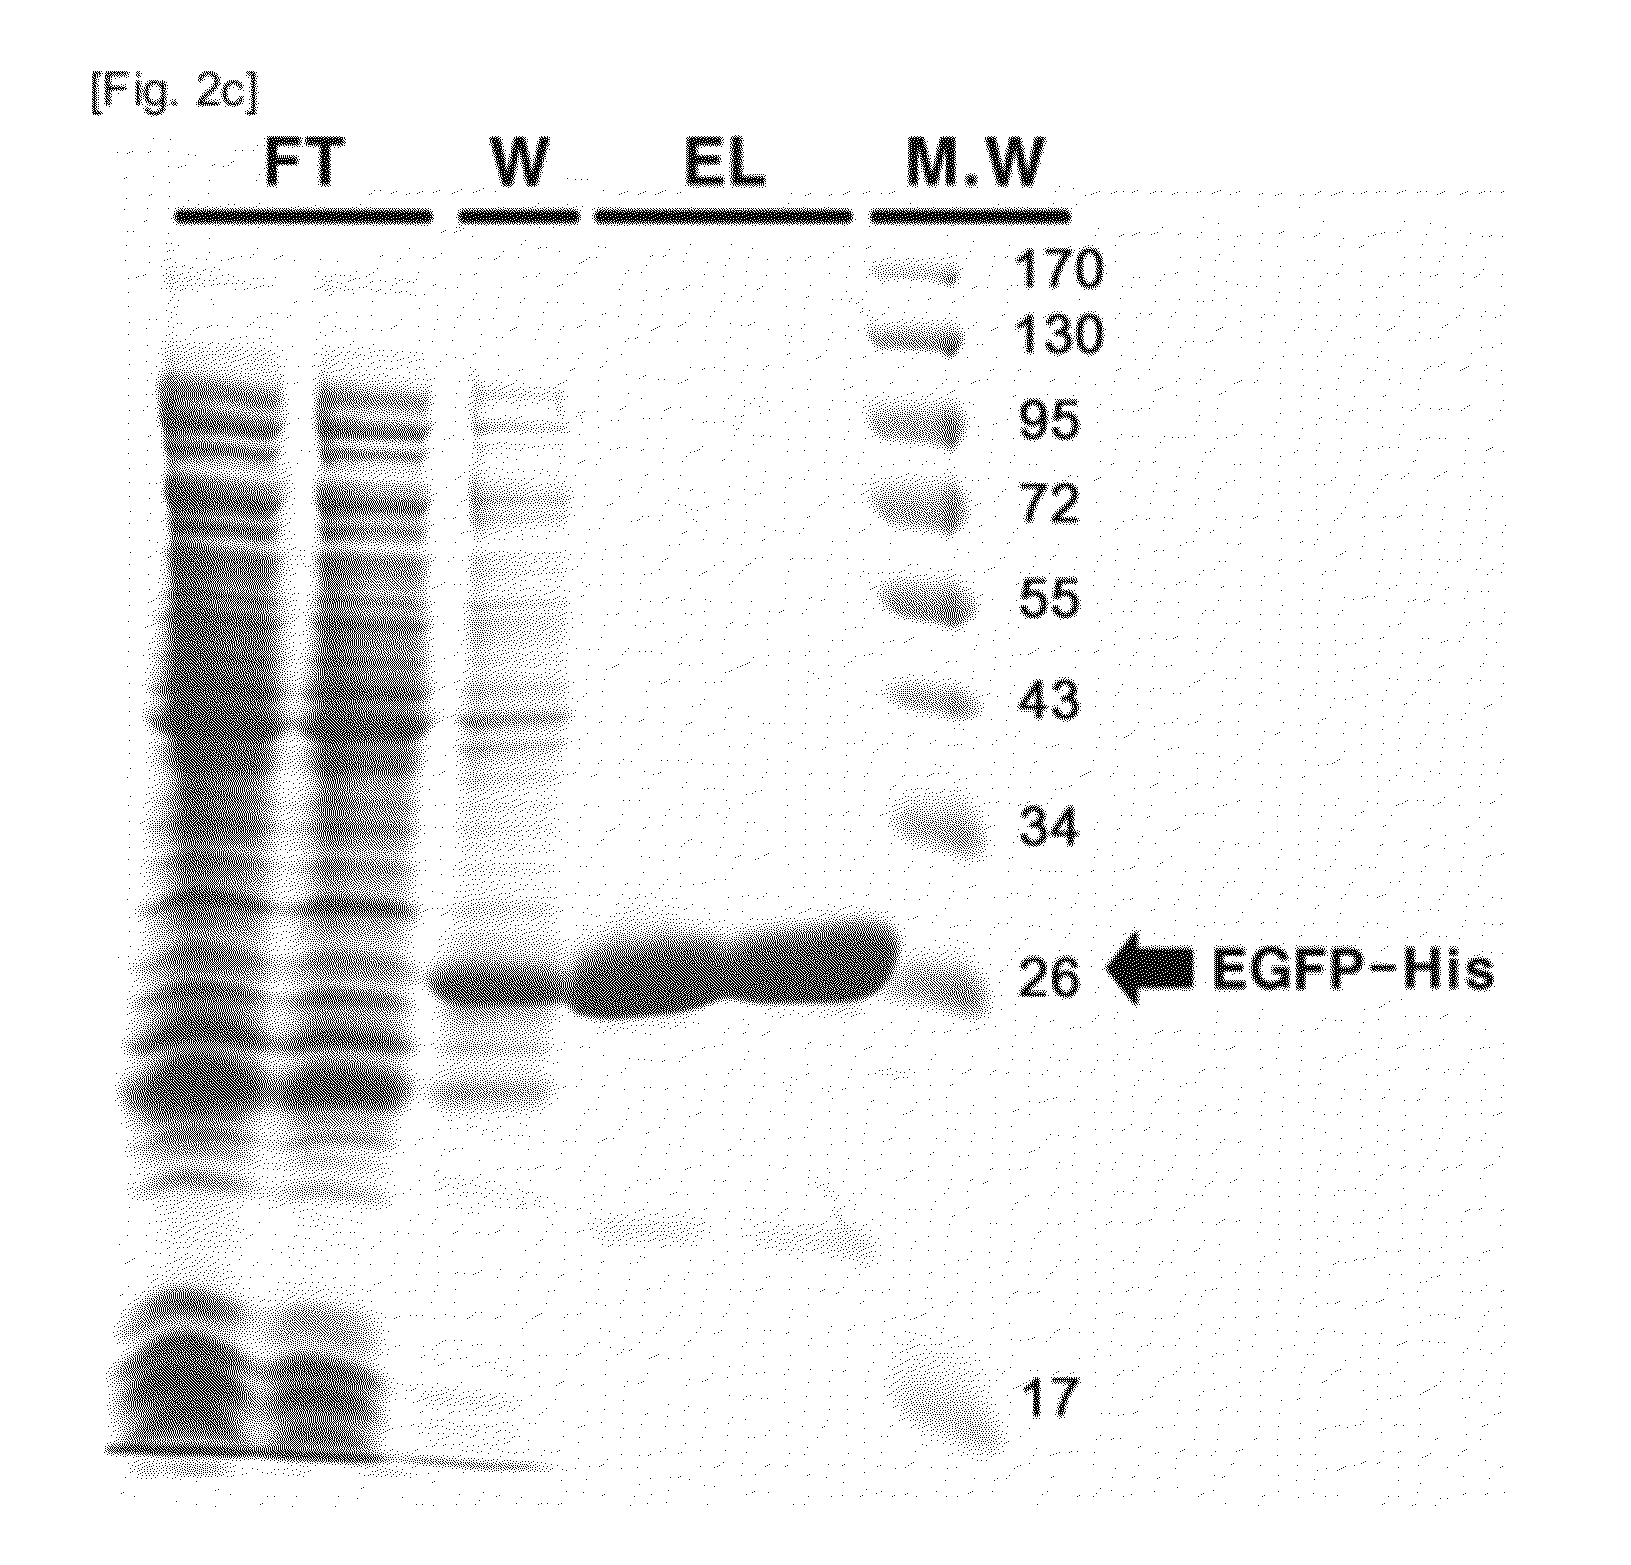
Expression of EGFP (Enhanced Green Fluorescence Protein)
[0042]EGFP was cloned, expressed and purified (FIGS. 2a to 2c). Information on a nucleotide sequence of EGFP was obtained from the internet site of Lab Life (http: / / www.lablife.org). Overall EGFP-encoding sequence was obtained by performing PCR on pEGFP N1 (Clonetech, CA, USA) in the presence of the sense primer 5′-GACAAGCTTATATGGTGAGCA-3′(SEQ ID NO: 1) and the antisense primer 5′-GCCGGGATCACTCTCGAGCAC-3′(SEQ ID NO: 2). In the primers, underlined italic letters denote HindIII and XhoI restriction enzyme sites, respectively, while the bold letters are additional bases accounting for the generation of an open reading frame. After digestion with the restriction enzymes, the PCR products were excised from the electrophoresis gel and ligated to a pET 24a (+) vector (Novagen, WI, USA).
[0043]The resulting recombinant vector pET24a(+)-EGFP-His was transformed into BL21 RIL codon-plus cells ((DE3) (Novagen)). The transformant BL21-Codon...
example 3
Determination of EGFP Standard Curve Using UV488 nm
[0045]To draw out a standard curve for EGFP, EGFP was dissolved and diluted sequentially from 0 to 0.6 mg / mL (by 0.1 mg / mL, 7 points) in MARS buffer A (Agilent, CA, USA). To 96-well plates (SPL, Korea) was added 200 μl of each of the diluted samples, followed by measuring absorbance at a wavelength range of from 400 nm to 600 nm on an ELISA reader (PowerWave XSBio-Tek, VT, USA). A standard curve was drawn from the already known amounts of EGFP and from the observed absorbance values.
PUM
| Property | Measurement | Unit |
|---|---|---|
| Fraction | aaaaa | aaaaa |
| Fraction | aaaaa | aaaaa |
| Fraction | aaaaa | aaaaa |
Abstract
Description
Claims
Application Information