
Multi-wavelength analyses of sol-particle specific binding assays

a sol-particle specific and assay technology, applied in the field of multi-wavelength analysis, can solve the problems of entail time-consuming multiple analysis steps, biocolloids hamper the sensitive determination of analytes, and it is difficult to develop reliable assays and devices for multiple analytes, so as to improve the sensitivity of such methods and achieve accurate measurement of analytes

Active Publication Date: 2012-10-04
ZOETIS SERVICE LLC
View PDF2 Cites 39 Cited by
  • Summary
  • Abstract
  • Description
  • Claims
  • Application Information

AI Technical Summary

Benefits of technology

[0007]Using nanoparticle immunoassays, the inventors of the present invention have surprisingly discovered that measurements of rates of changes at one or more wavelengths, and optionally their further numerical manipulation by an algorithm, allows for the minimization of nonspecific interference, thus substantially improving the sensitivity of such methods.
[0008]The methods of the present invention provide accurate measurement of analytes in complex biological media and can be adapted to analyze multiple analytes simultaneously using multiple measurements from multiple reaction containers each tailored for the detection of distinct analytes. Alternatively, multiple analytes can be measured simultaneously by monitoring absorbance values at several wavelengths and time points.

Problems solved by technology

The innate turbidity of complex biological samples, such as blood, plasma, serum, urine, and bile, has made it difficult to develop reliable assays and devices for multiple analytes.
Matrix-related interference as well as scattering of light by biocolloids hamper sensitive determinations of analytes where measurements are primarily restricted to turbidity.
These assays have one or more of the following disadvantages: (1) entail time consuming multiple analysis steps, (2) require complicated, expensive machinery for readouts, (3) are limited to detection of single analytes, and (4) are limited to qualitative analyses.
The drawback of using LSPR for biological samples has always been interference due to non-specific reaction.

Method used


Image

  • Multi-wavelength analyses of sol-particle specific binding assays
  • Multi-wavelength analyses of sol-particle specific binding assays
  • Multi-wavelength analyses of sol-particle specific binding assays

Examples


example 1

Homogenous Canine Heart Worm Assay

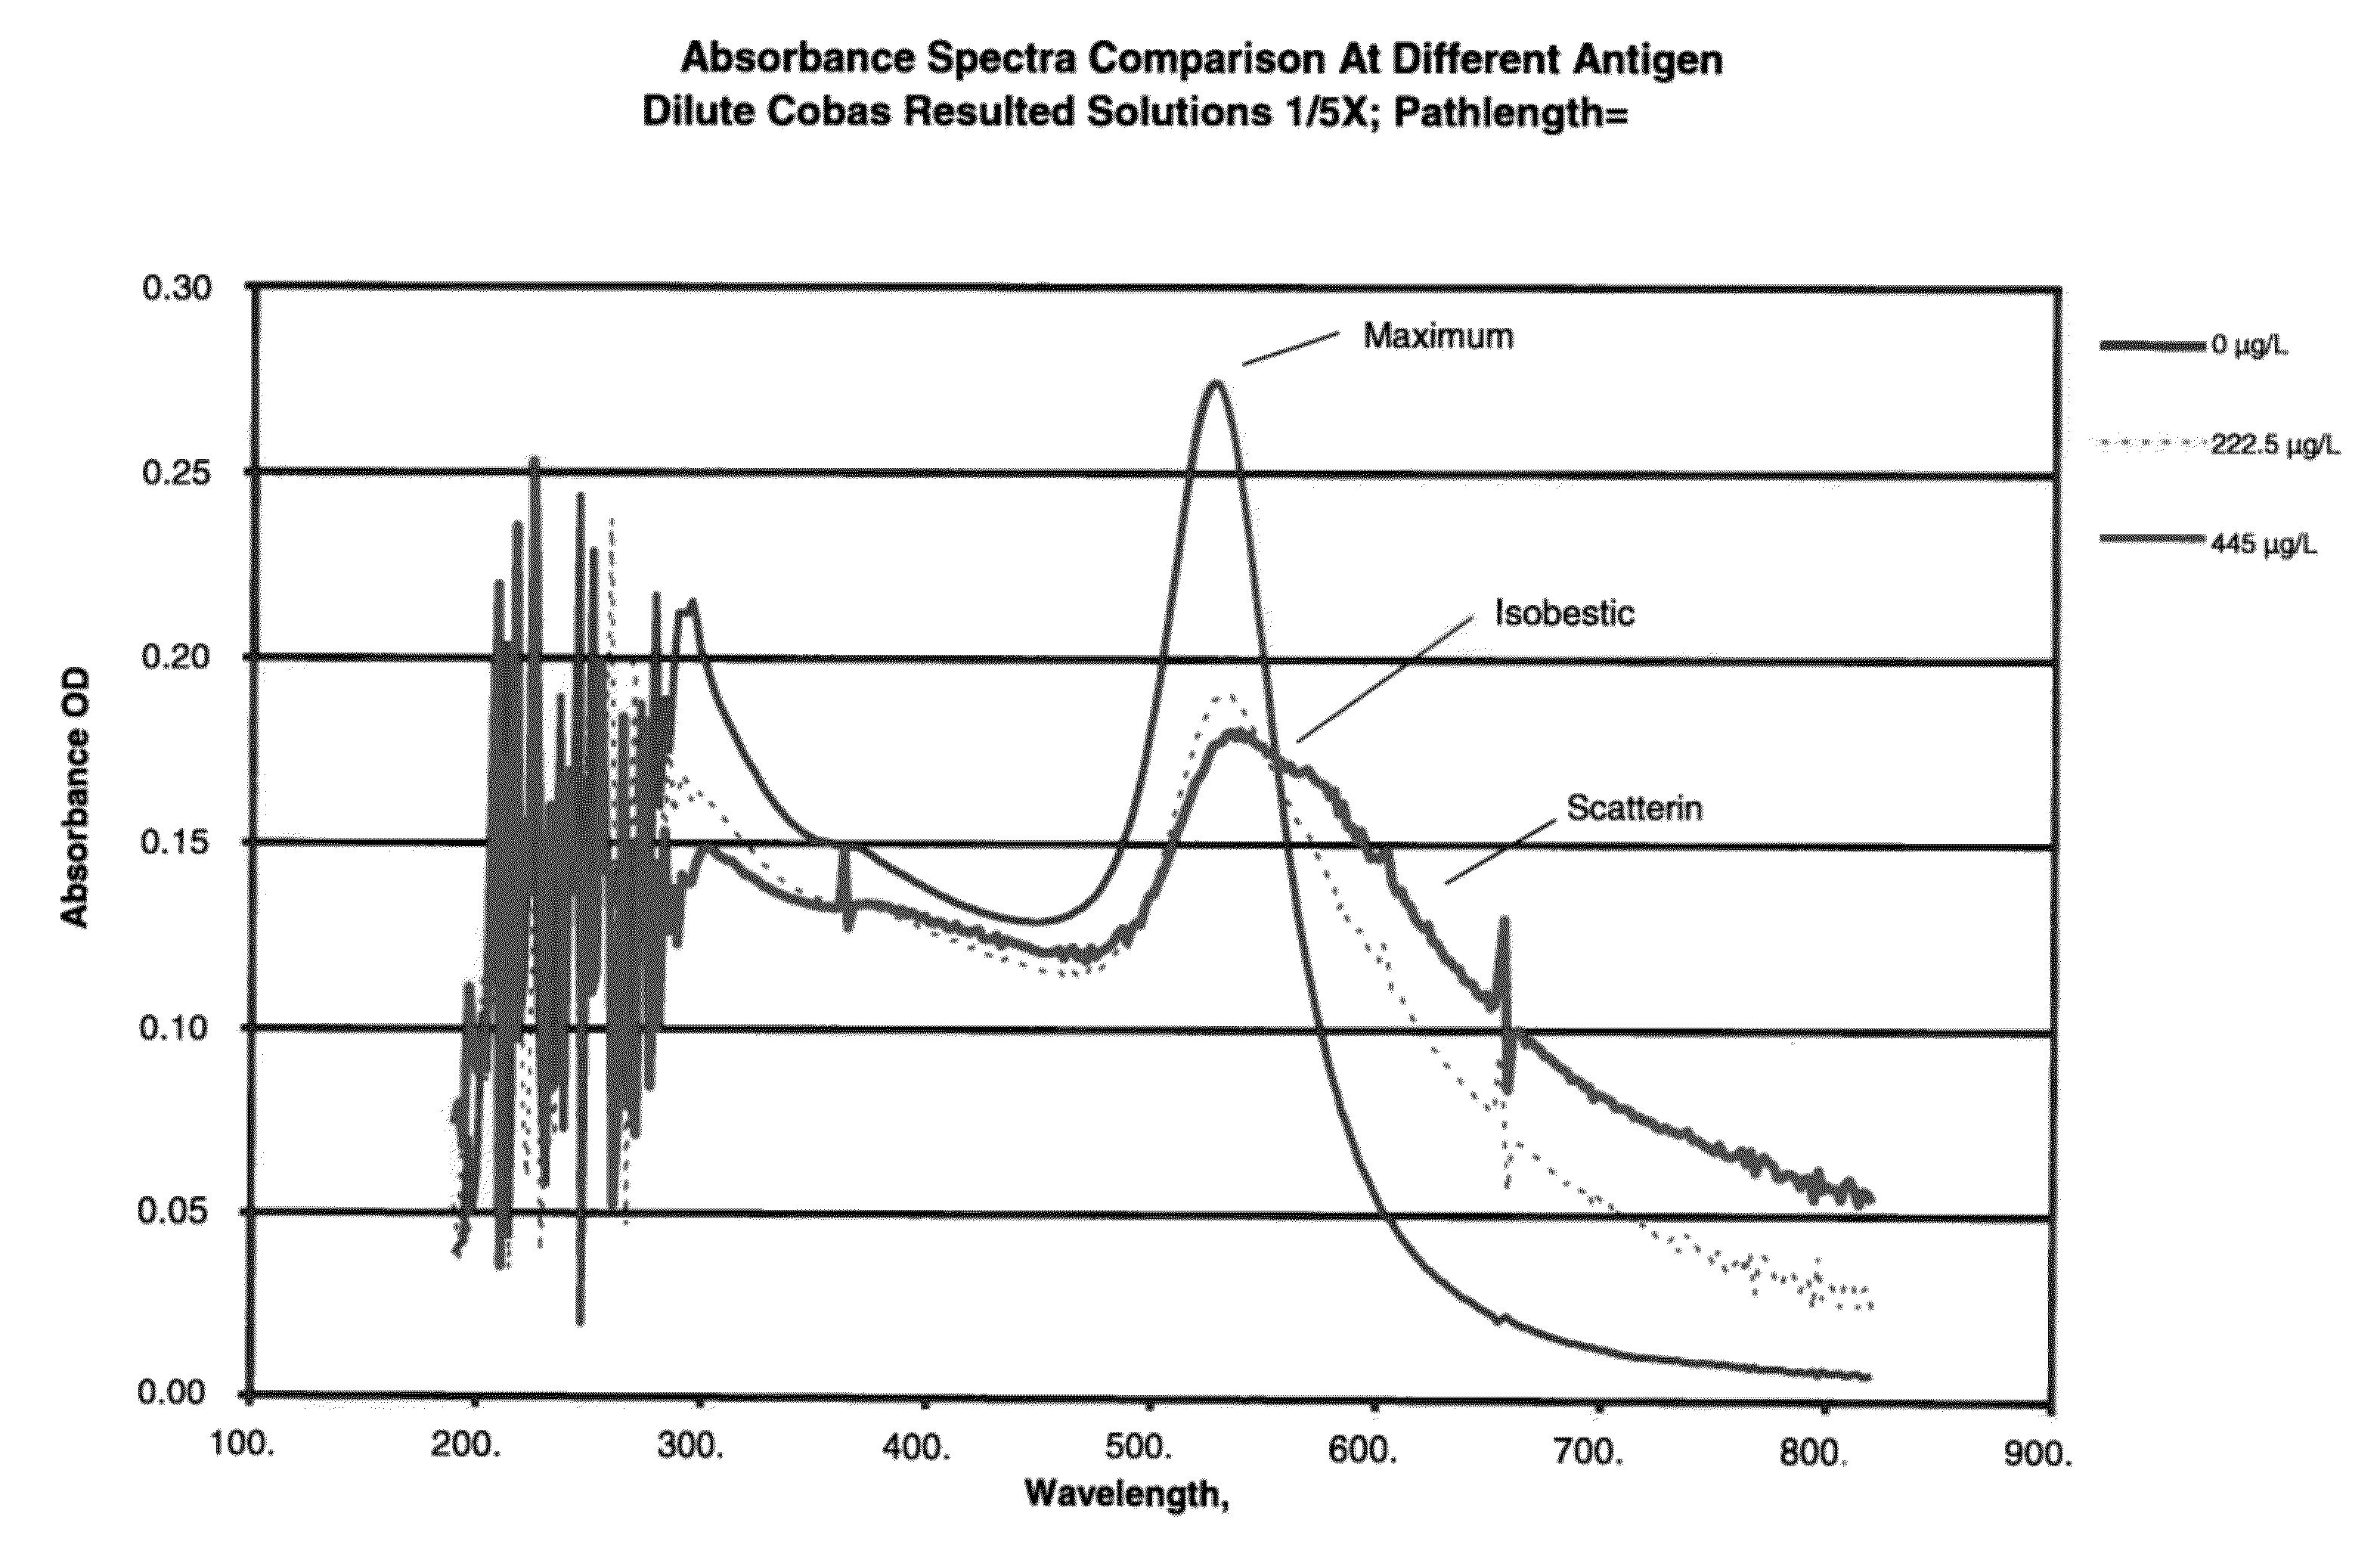
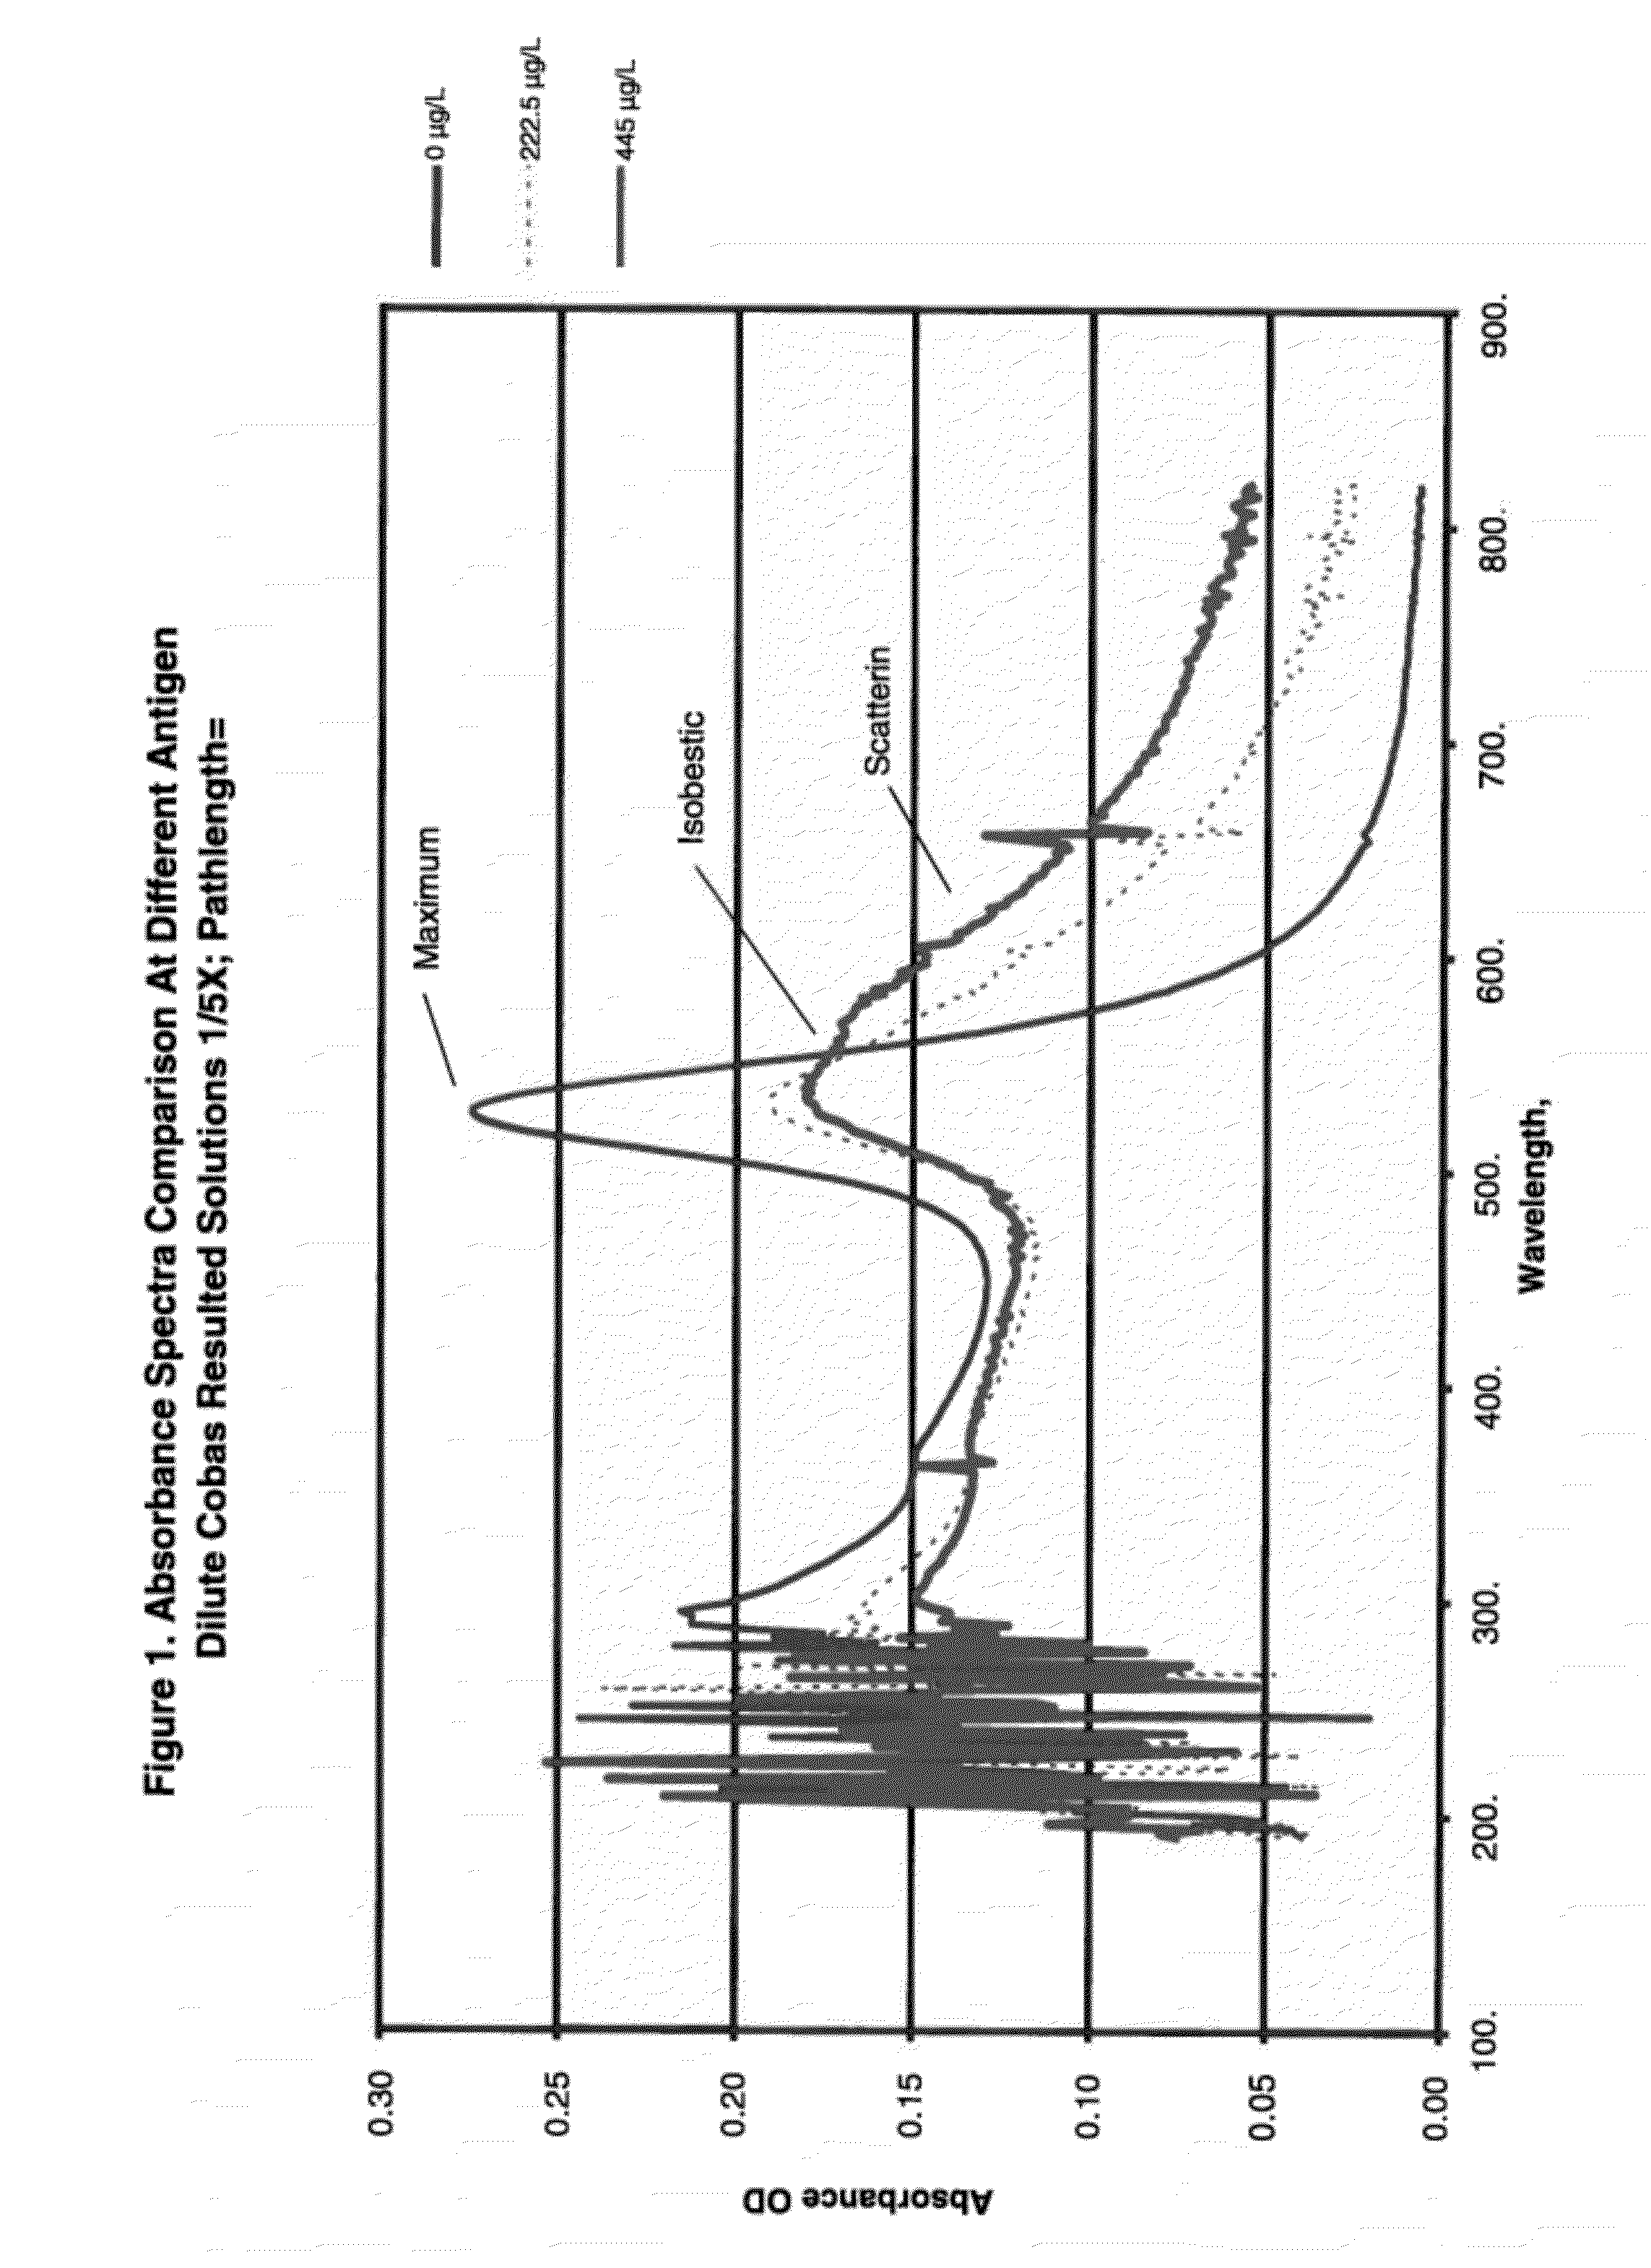
[0091]Anti-heartworm antibodies were procured from several sources such as Capricorn Products, Custom Monoclonals and ICL labs. IgG, IgM IgY antibodies to Dirofilaria immitis, commonly known as heartworm, were used to coat gold nanoparticles. Colloidal gold particles (37 nm in diameter) were coated with anti-heartworm antibodies by passive adsorption using standard techniques. A typical assay in a simple format was setup by mixing gold conjugates, buffer, sodium chloride and high molecular polyethylene glycols. Spectra of gold-conjugates following 10 min incubation with 0.223 or 445 μg / L of a purified heartworm antigen (Capricorn Products) were obtained and are shown in FIG. 1.

[0092]For 0 μg / L, a very sharp and narrow peak at 530 nm suggested the conjugates are nearly mono-dispersed. With increasing antigen concentration, the absorbance peak at 530 nm declined with a concomitant increase in scattering peak (600 nm). An important feature of such spec...

example 2

Algorithm for Identifying Positive Samples when Reactivity Between Analyte and Conjugate is High—Logic #1

[0095]For samples that show significant reactivity to the conjugate, the following logic can be applied. Initial and final rates are calculated in the absorbance (515 and 550 nm) and scattering (600 and 630 nm) regions. Since significant signals are generated from high positive samples, qualitative decisions are easily made by simply adding up all the initial rates. Additionally or alternatively, the rate ratio can be compared to distinguish negative from high positive samples. The threshold can be determined by maximum signals generated from negative samples and then further adjusted by the assay imprecision. The algorithm (Logic #1) is described by the following flowchart:

[0096]FIGS. 5 and 6 illustrate the first rate sum and rate ratio comparison, respectively, between positive and negative canine heartworm (CHW) samples. The threshold for these experiments was established fro...

example 3

Algorithm for Identifying Positive Samples when Reactivity Between Analyte and Conjugate is Low—Logic #2

[0098]When sample and / or conjugate reactivity is very low, positive samples are difficult to identify using Logic #1. For example, FIG. 7 illustrates first-rate-sum results from positive samples that exhibited very low reactivity and rate due to sample aging. As can be seen from the results depicted in FIG. 7, the positive samples are not easily distinguished from negative samples using the first logic.

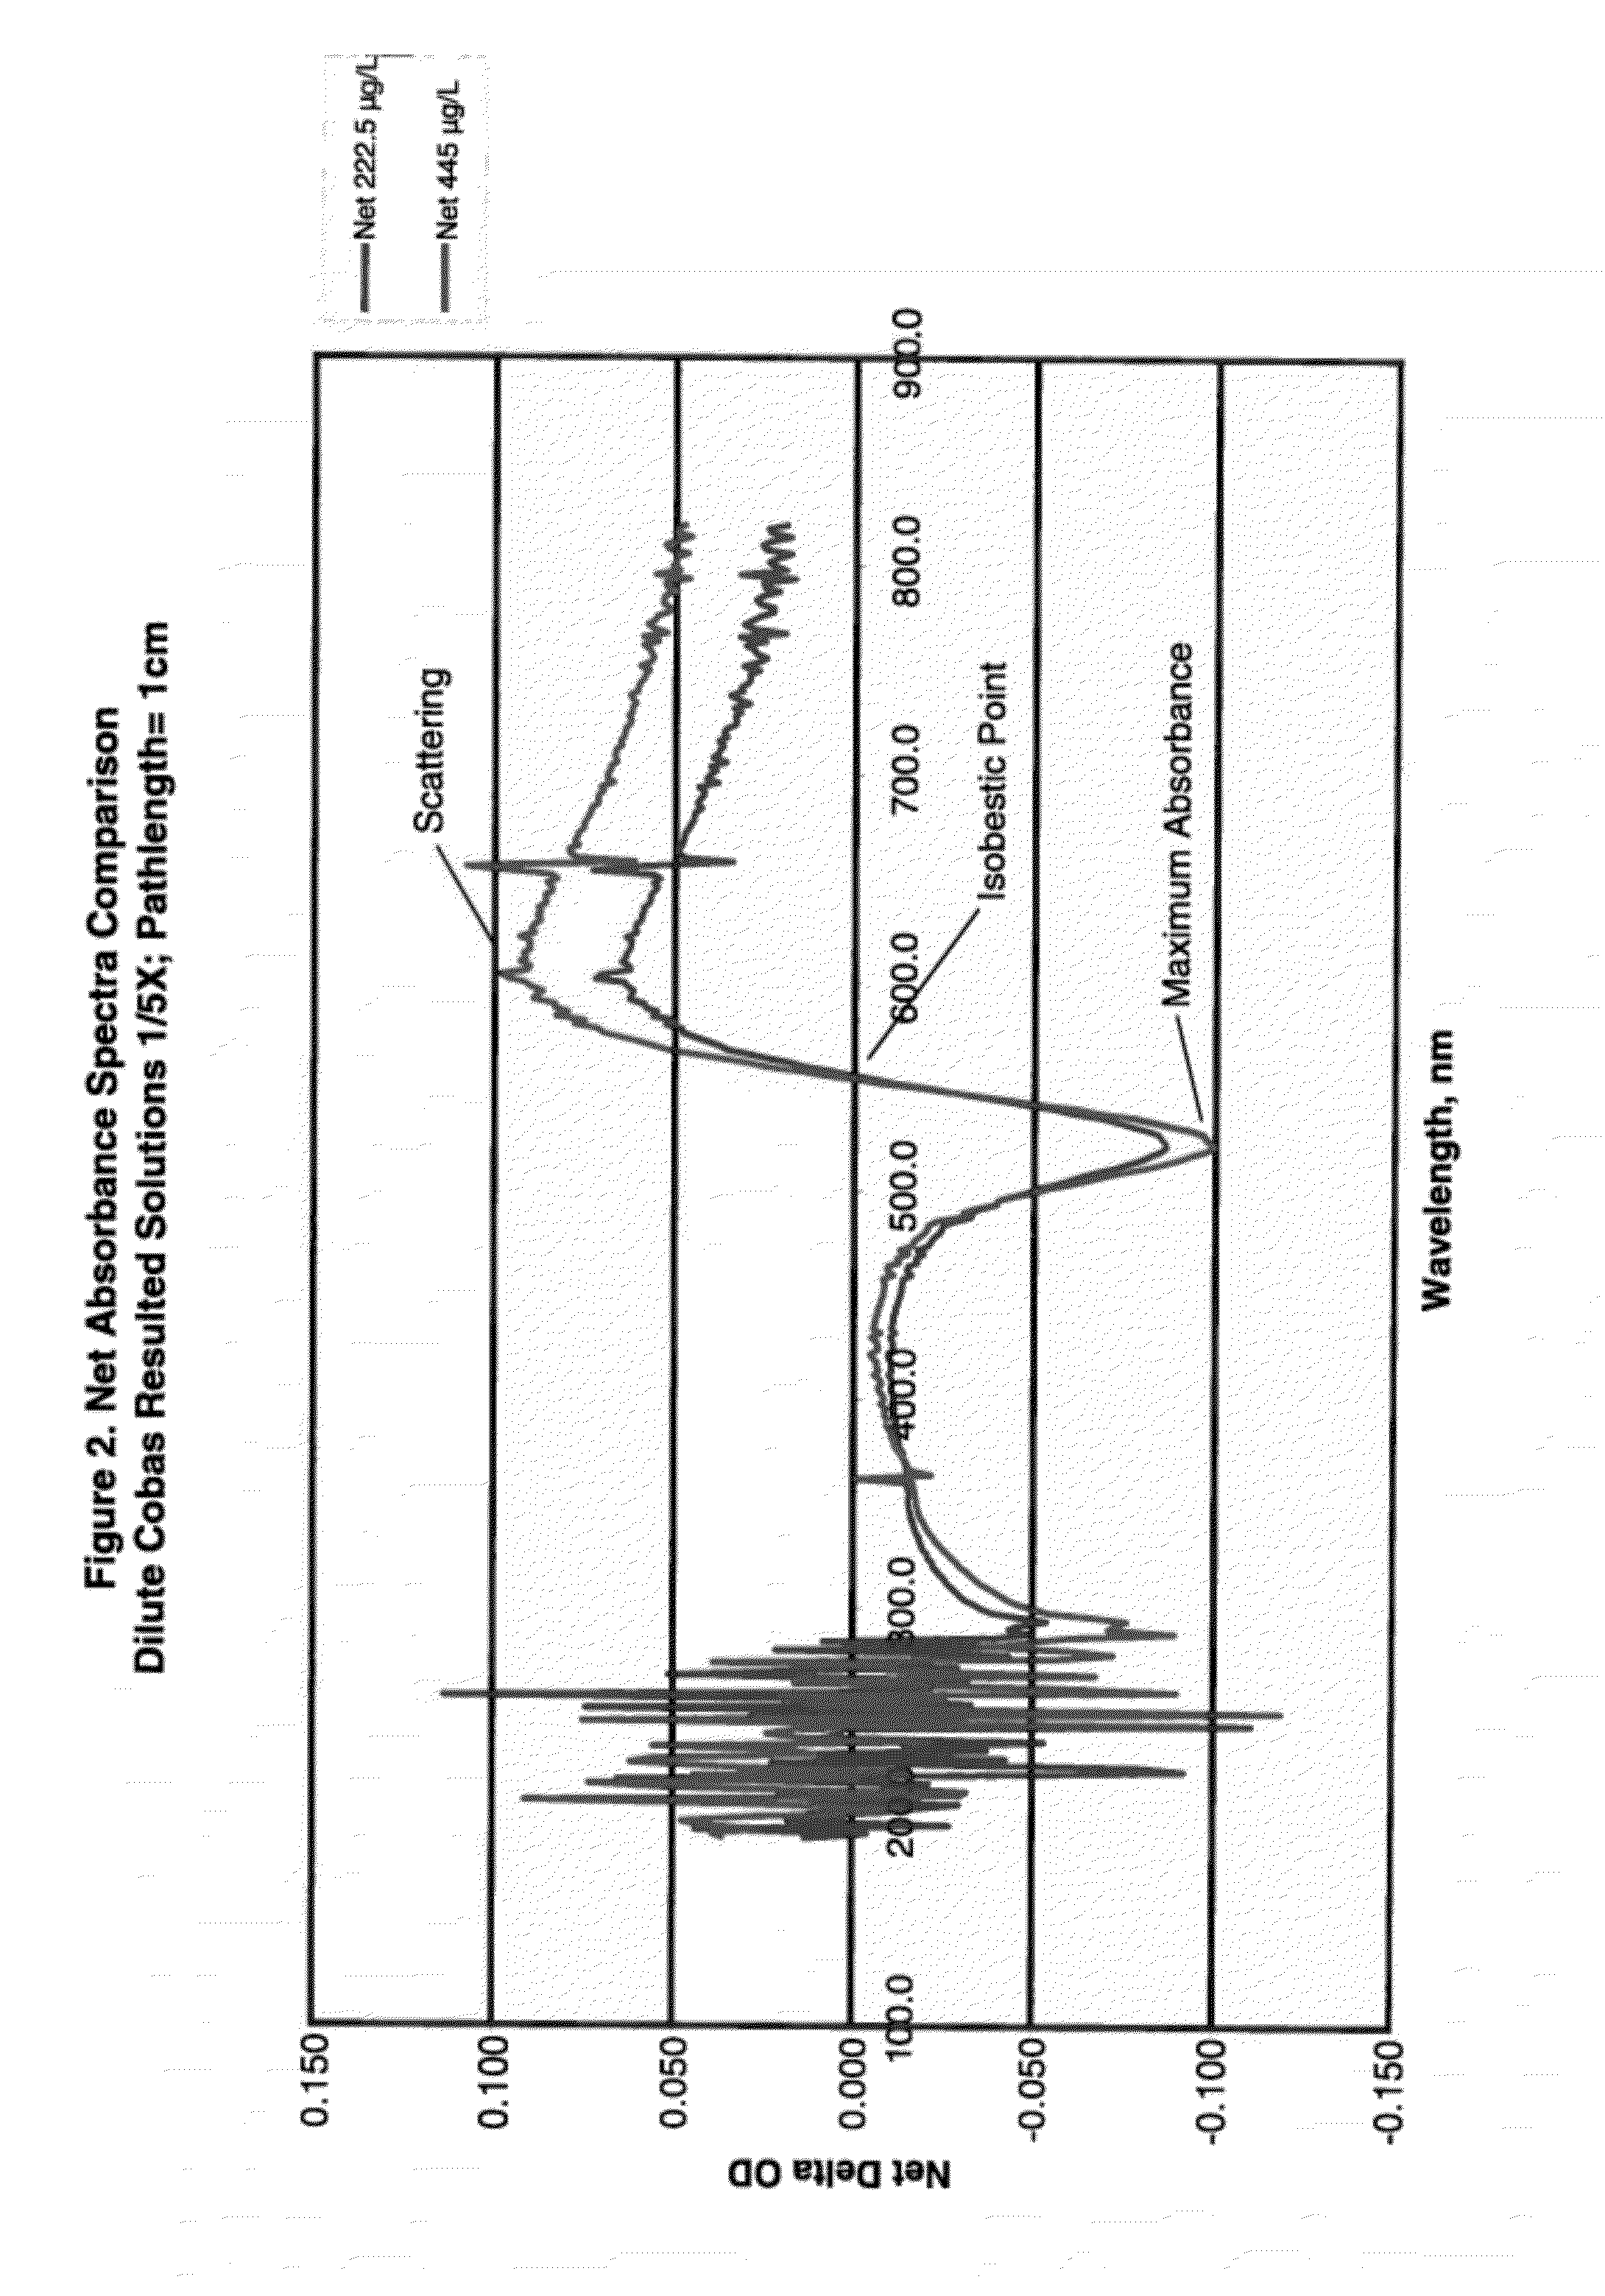
[0099]Therefore, we developed a second logic to be used when there is very low reactivity between the analyte and conjugate. To quantify specific signals generated by agglutination, we used the isosbestic point as the reference wavelength. The rate calculations from the absorbance and scattering regions are shown in FIG. 8.

[0100]This second logic (Logic #2) entails integrating negative and positive signals and is illustrated by the following flow chart:

[0101]In this example, there a...


PUM


Abstract

The present invention discloses methods for detecting the presence of a complex between a first reagent and a second reagent in solution. In particular, the invention provides methods for qualitative or quantitative detection of an analyte or its specific binding partner in complex biological samples. The invention further discloses algorithms using summary rate changes at selected wavelengths in the absorbance spectra of colloidal metal-labeled analytes or specific binding partners to identify intermolecular interactions between the analyte and its binding partner.

Description

CROSS-REFERENCE TO RELATED APPLICATIONS[0001]This application is a divisional of U.S. application Ser. No. 12 / 406,906, filed Mar. 18, 2009, which claims priority to U.S. Patent Application Ser. No. 61 / 038,324, entitled “Multi-Wavelength Analyses Of Sol-Particle Specific Binding Assays”, filed Mar. 20, 2008; and U.S. Patent Application Ser. No. 61 / 098,417, entitled “Multi-Wavelength Analyses Of Sol-Particle Specific Binding Assays”, filed Sep. 19, 2008. The content of these applications are herein incorporated by reference in their entirety for all purposes.BACKGROUND OF THE INVENTION[0002]Accurate detection of analytes in solutions, particularly biological fluids, is critical in several fields, including medical diagnostics, veterinary diagnostics, and food and drug safety. The innate turbidity of complex biological samples, such as blood, plasma, serum, urine, and bile, has made it difficult to develop reliable assays and devices for multiple analytes. Matrix-related interference a...

Claims


Application Information

Patent Timeline
Patent Type & Authority Applications(United States)
IPC IPC(8): G01N21/55B82Y15/00
CPCG01N21/272G01N33/587G01N33/542G01N21/314
Inventor CHIANG, VINCENTMEHRA, RAJESH K.
Owner ZOETIS SERVICE LLC
Learn More