Method and apparatus for reducing noise in mass signal
a mass signal and noise reduction technology, applied in the field of mass spectrometry spectrum data processing, can solve the problem that it is not typically desirable to perform noise reduction, and achieve the effect of reducing noise, noise reduction, and noise reduction
- Summary
- Abstract
- Description
- Claims
- Application Information
AI Technical Summary
Benefits of technology
Problems solved by technology
Method used
Image
Examples
example 1
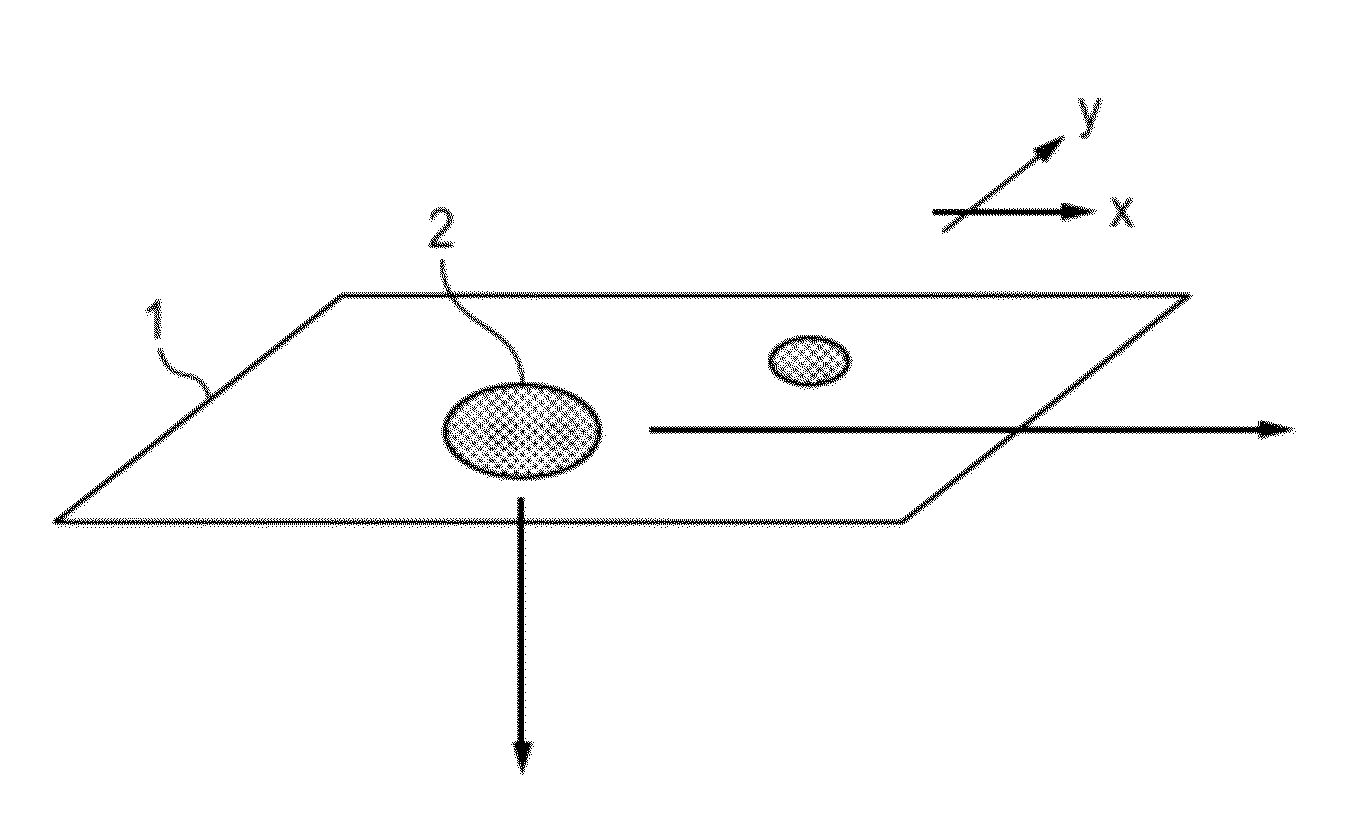
[0093]Example 1 of the present invention will be described below. FIG. 7A illustrates a sample that undergoes mass spectrometry. Insulin 2 is applied onto a substrate 1 in an ink jet process, and the insulin 2 has a distribution having a diameter of approximately 30 μm.
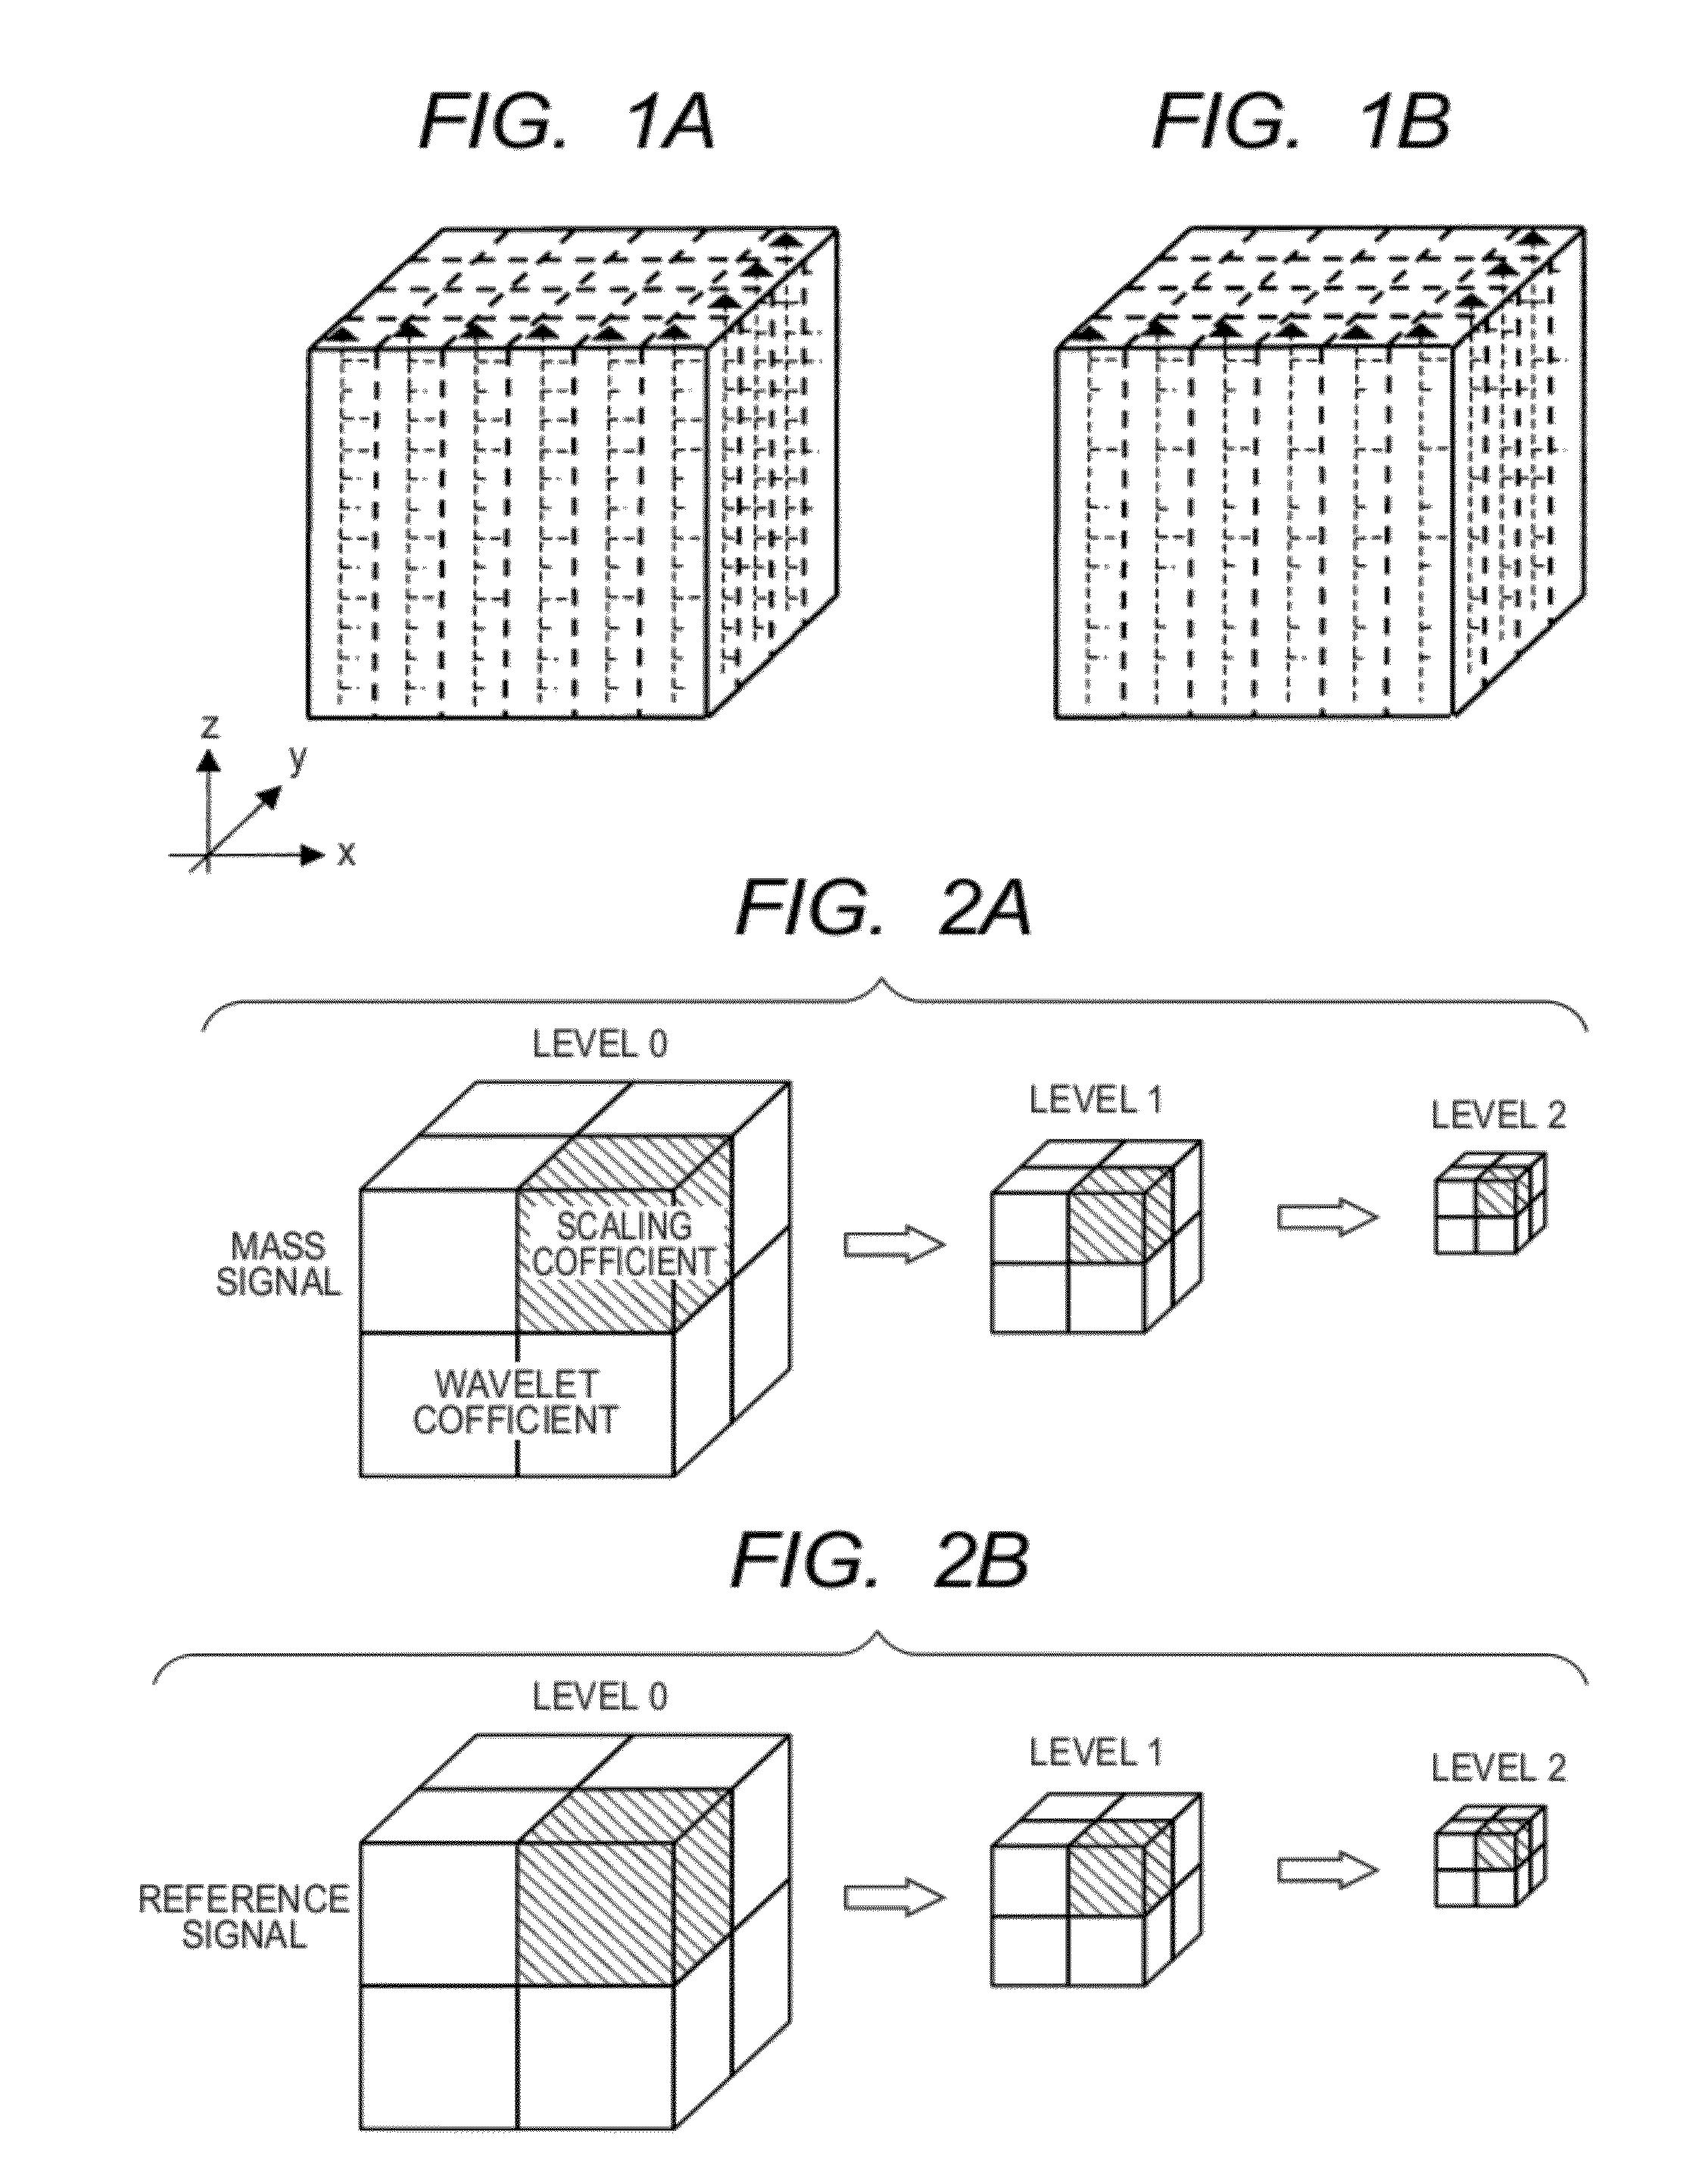
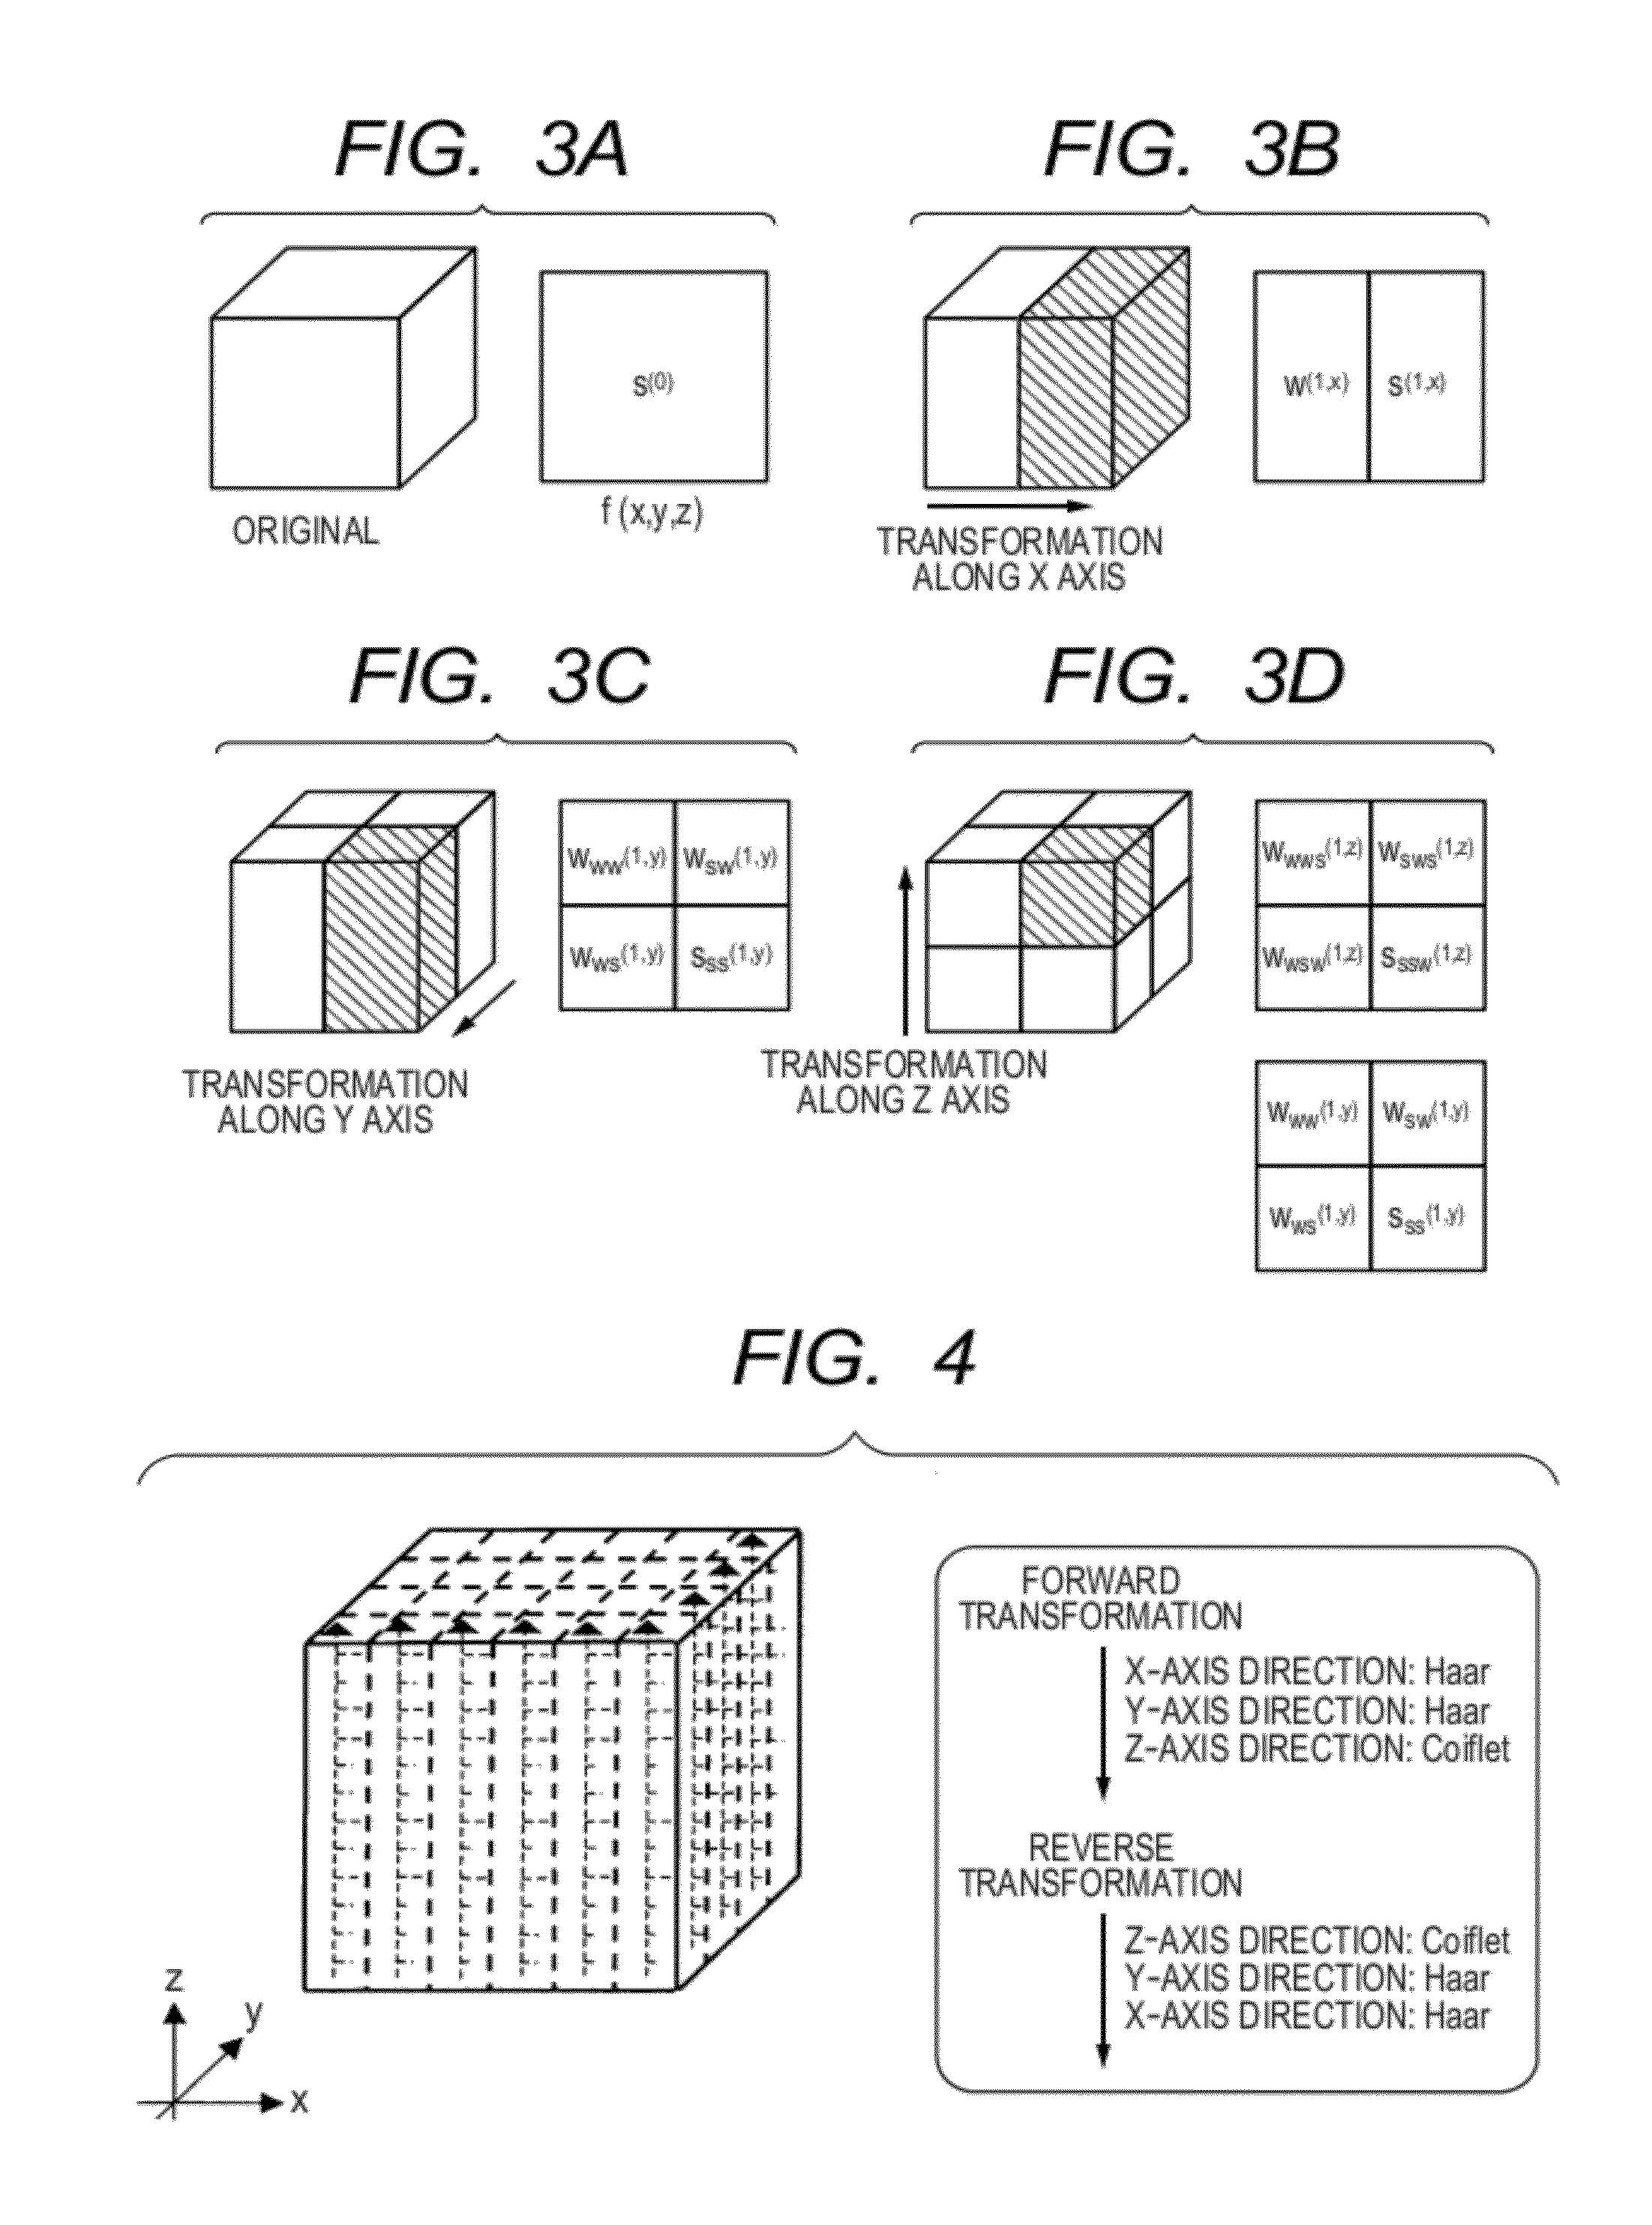
[0094]Since the spatial distribution of a peak of a mass spectrum in the x-axis and y-axis directions is continuous as illustrated in FIG. 7B, the noise reduction is preferably performed by using a Haar basis function. On the other hand, since mass spectrum data in the z-axis direction is discretely distributed as illustrated in FIG. 7C, the noise reduction is preferably performed by using a Coiflet (N=2) basis function. In the present example, the noise reduction was performed as follows: The threshold was determined by substituting the standard deviation associated with each signal component into (Formula 11) and data smaller than or equal to the threshold was replaced with zero. In Formula 11, N represents the tota...
example 2
[0101]Example 2 of the present invention will be described below. In the present example, an apparatus manufactured by ION-TOF GmbH, Model: TOF-SIMS 5 (trade name), was used, and SIMS measurement was performed on a tissue section containing HER2 protein which has an expression level of 2+ and on which trypsin digestion was performed (manufactured by Pantomics, Inc.) under the following conditions:
[0102]Primary ion: 25 kV Bi+, 0.6 pA (magnitude of pulse current), macro-raster scan mode
[0103]Pulse frequency of primary ion: 5 kHz (200 μs / shot)
[0104]Pulse width of primary ion: approximately 0.8 ns
[0105]Diameter of primary ion beam: approximately 0.8 μm
[0106]Range of measurement: 4 mm×4 mm
[0107]Number of pixels used to measure secondary ion: 256×256
[0108]Cumulative time: 512 shots per pixel, single scan (approximately 150 minutes)
[0109]Mode used to detect secondary ion: positive ion
[0110]The resultant SIMS data contains XY coordinate information representing the position and mass spectru...
PUM
 Abstract
Description
Claims
Application Information
 - R&D
- Intellectual Property
- Life Sciences
- Materials
- Tech Scout
- Unparalleled Data Quality
- Higher Quality Content
- 60% Fewer Hallucinations
Browse by: Latest US Patents, China's latest patents, Technical Efficacy Thesaurus, Application Domain, Technology Topic, Popular Technical Reports.
© 2025 PatSnap. All rights reserved.Legal|Privacy policy|Modern Slavery Act Transparency Statement|Sitemap|About US| Contact US: help@patsnap.com


