Variability single nucleotide polymorphisms linking stochastic epigenetic variation and common disease

a single nucleotide polymorphism and stochastic epigenetic variation technology, applied in the field of epigenomic analysis, can solve the problem of relativly small attributable risk, and achieve the effects of small attributable risk, low odds ratio, and increased disease risk

Inactive Publication Date: 2013-11-07
THE JOHN HOPKINS UNIV SCHOOL OF MEDICINE +1
View PDF0 Cites 5 Cited by
  • Summary
  • Abstract
  • Description
  • Claims
  • Application Information

AI Technical Summary

Benefits of technology

[0011]First, the invention relates to variability single nucleotide polymorphisms (vSNPs) linking stochastic epigenetic variation and common disease. A major puzzle in human genetics is the relatively small attributable risk of common disease explained by common sequence variants, with most g...

Problems solved by technology
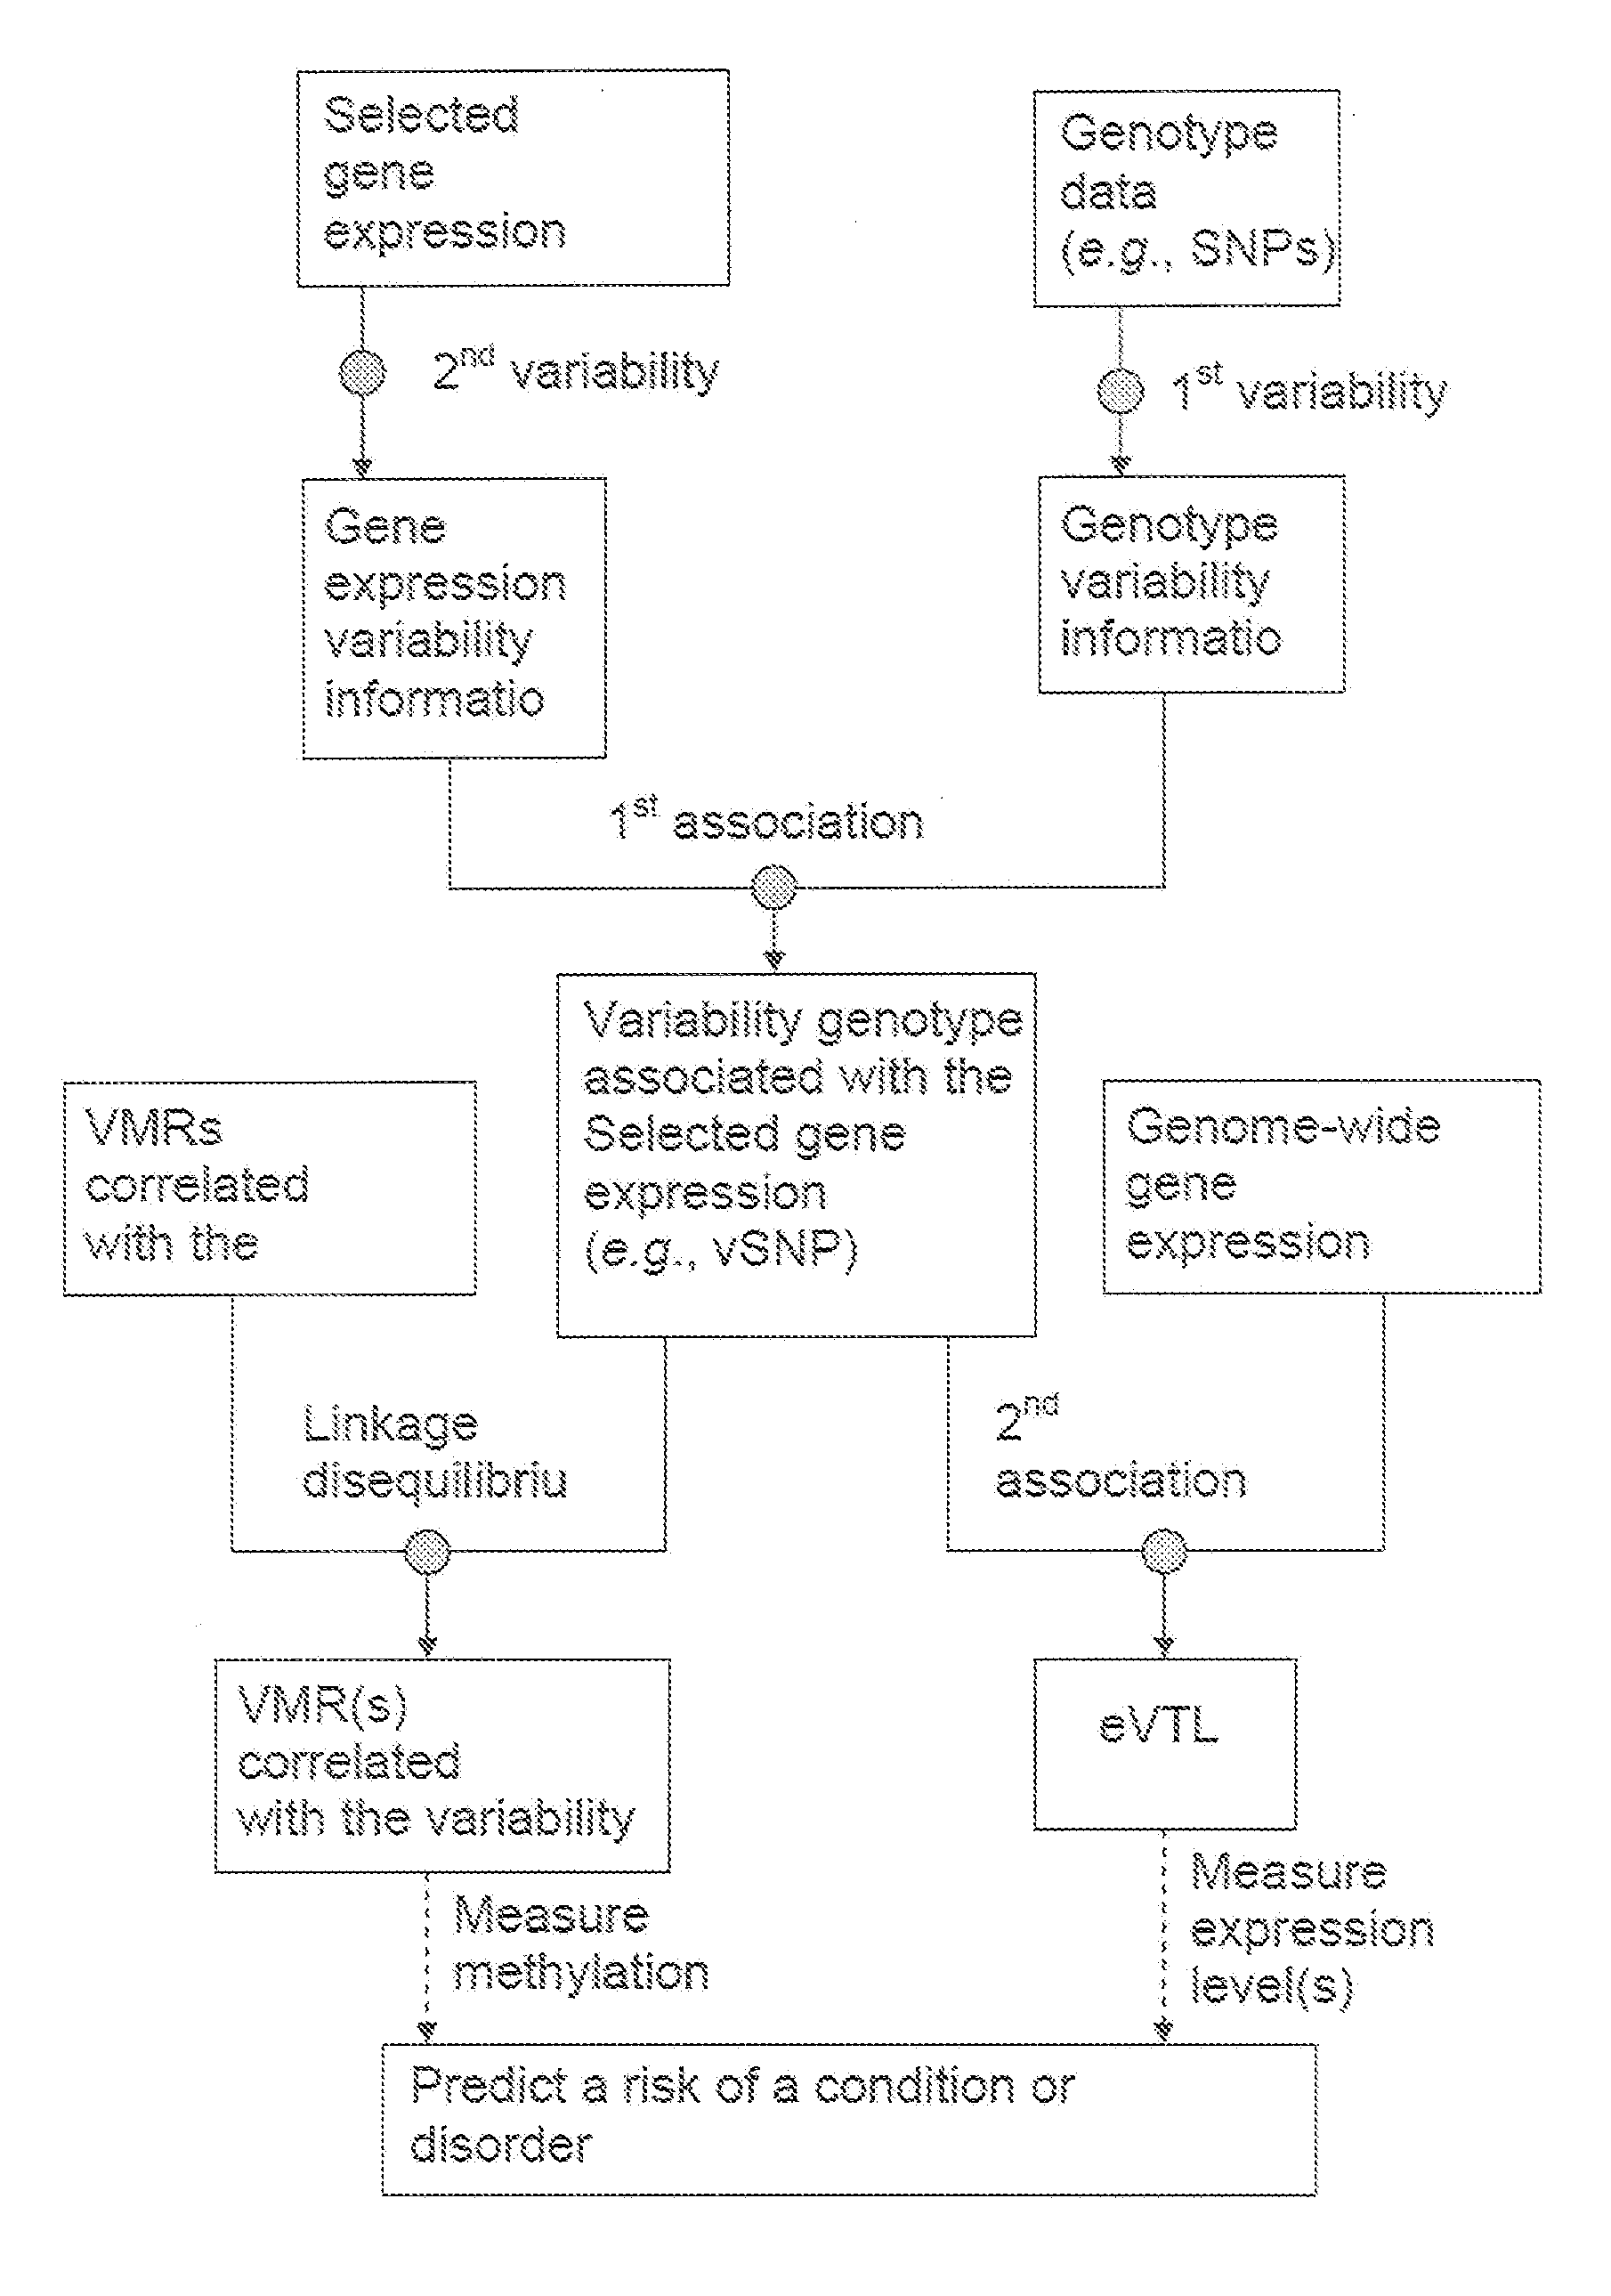
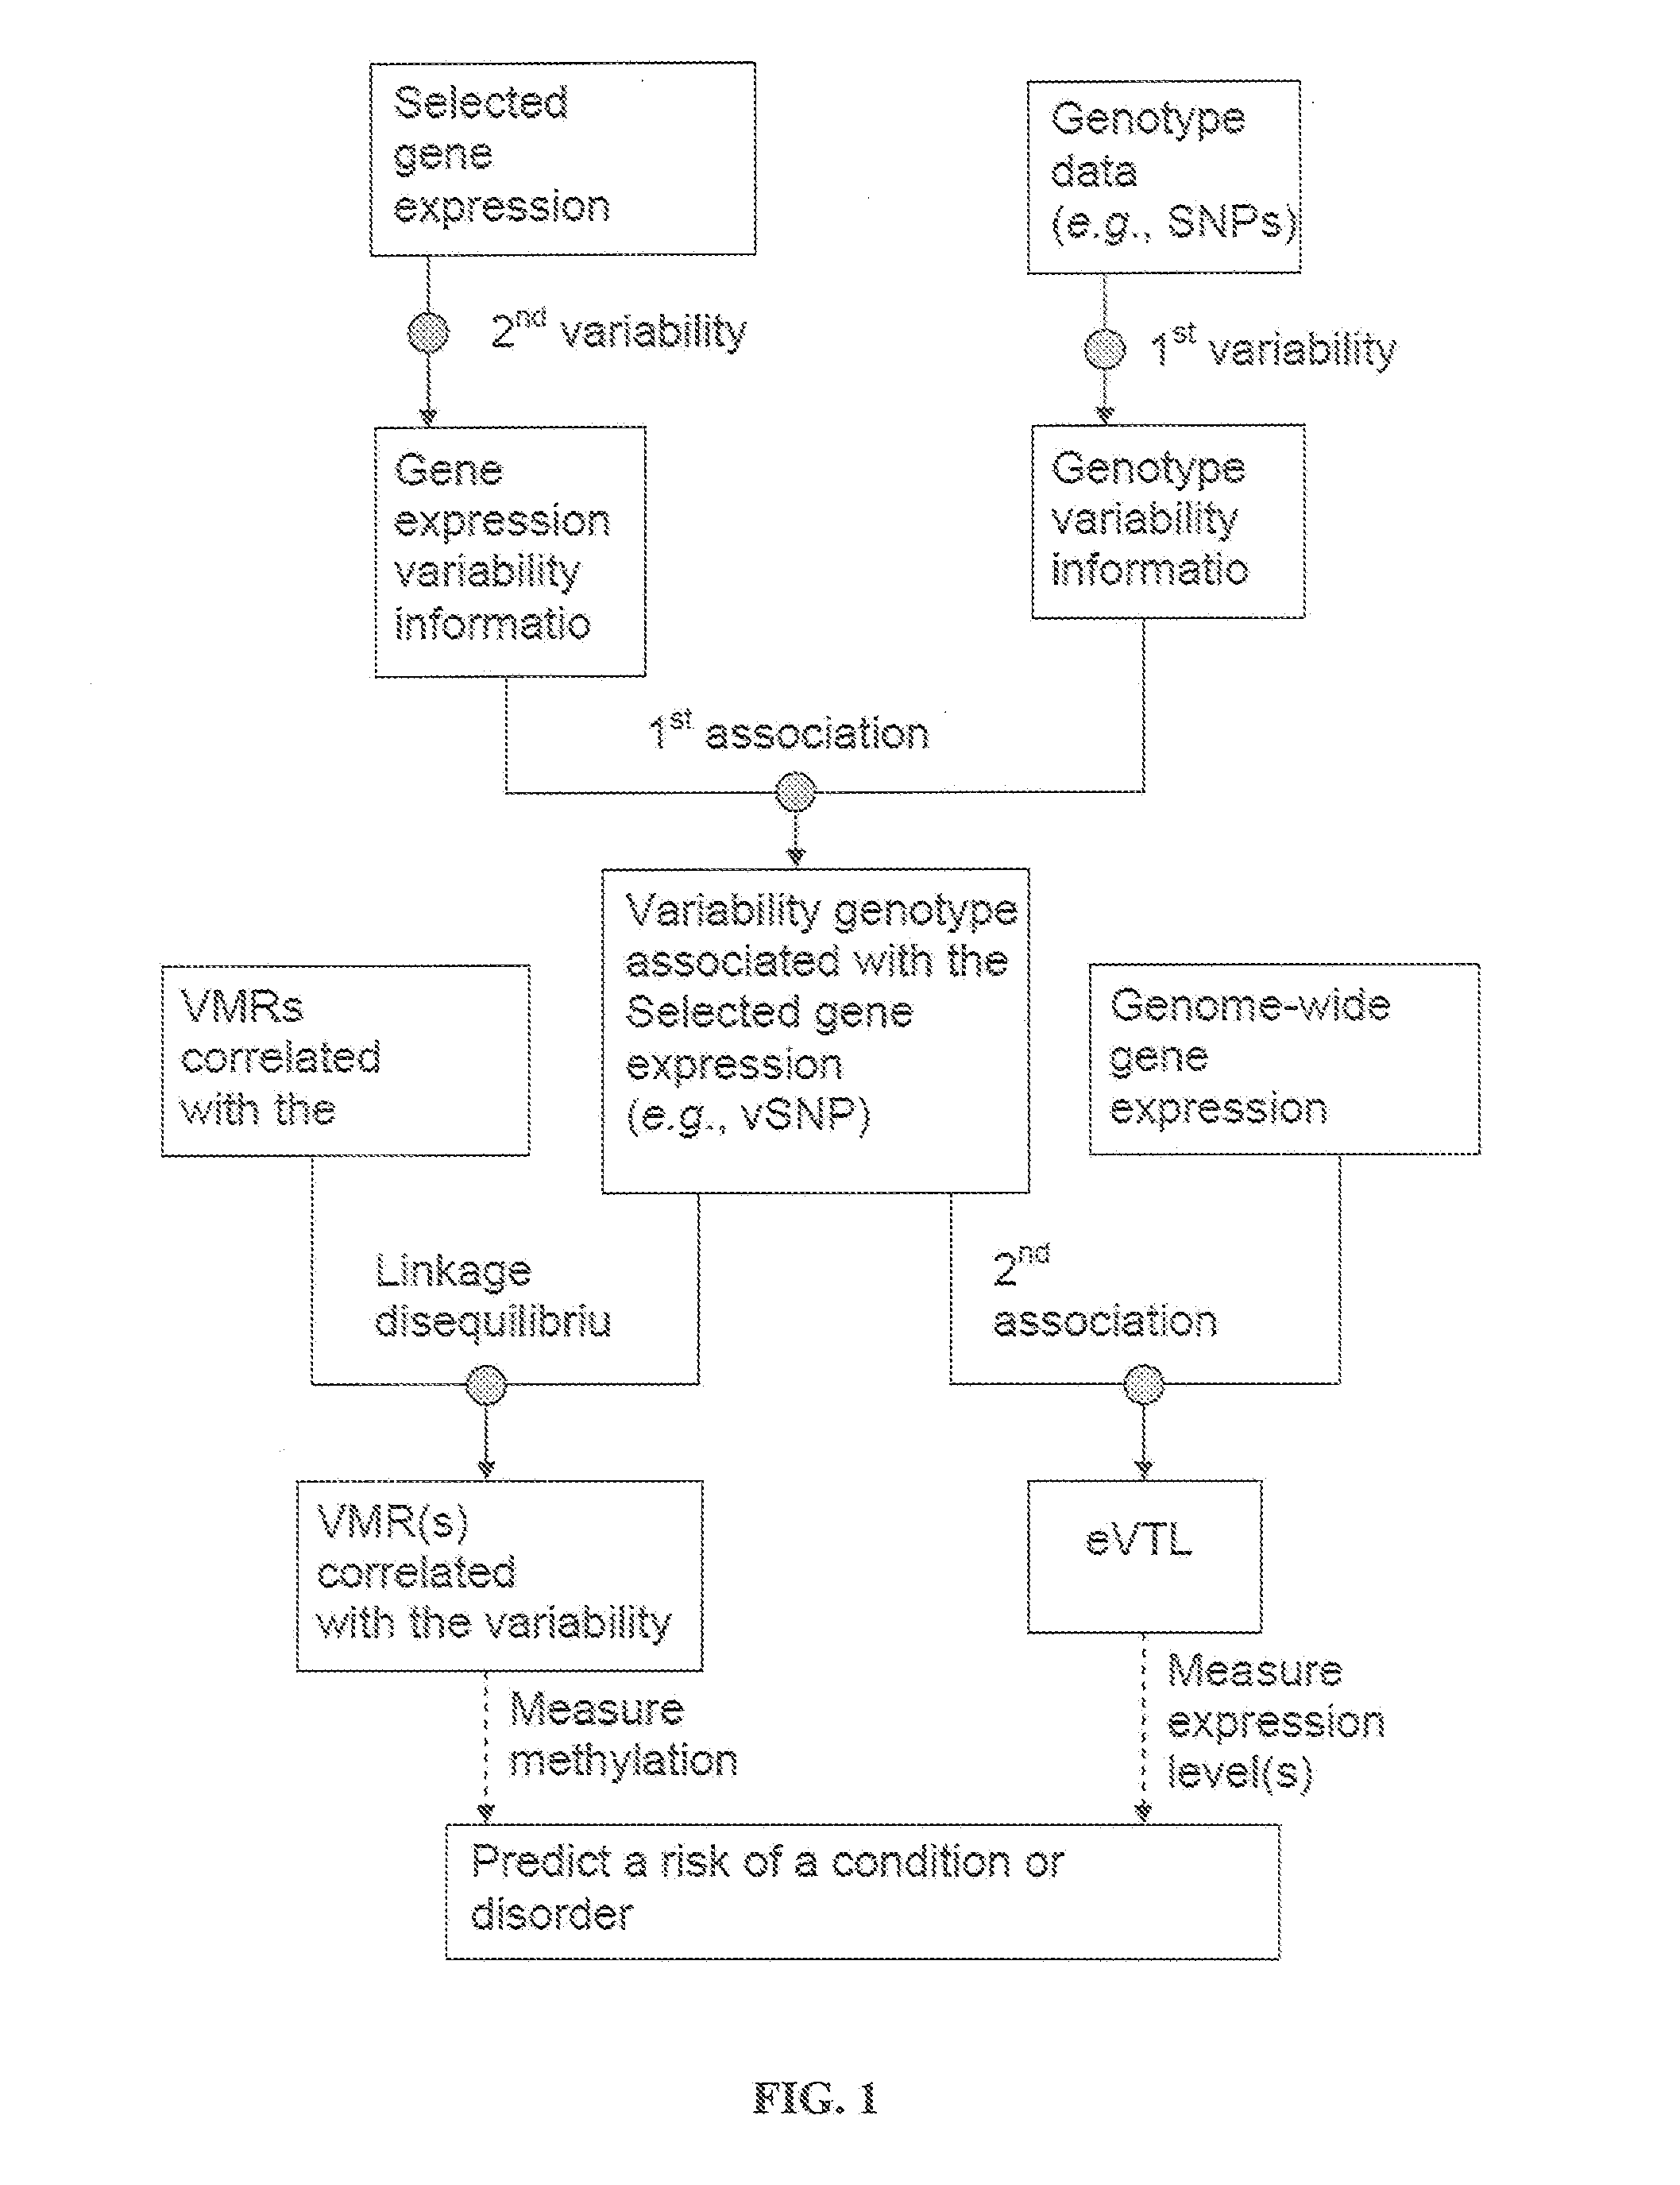
A major puzzle in human genetics is the relatively small attributable risk of common disease explai...

Method used


Image

  • Variability single nucleotide polymorphisms linking stochastic epigenetic variation and common disease
  • Variability single nucleotide polymorphisms linking stochastic epigenetic variation and common disease
  • Variability single nucleotide polymorphisms linking stochastic epigenetic variation and common disease

Examples


example 1

Genetic Models

[0142]The mean model for the relationship between a quantitative phenotype and the genotype for a single locus is

E[pi]=b0+bAA1(gi=AA)+bAa1(gi=AB)+bAa1(gi=BB)+ei

[0143]where pi is the phenotype for individual i, gi is the genotype, b0 is the baseline level of the phenotype, 1(gi=AA) is an indicator that the genotype for individual i is AA, bAA is the phenotypic offset for allele AA and e is the random effect of other genetic, epigenetic, or environmental variables. The model relates the expected value (mean) of the phenotype to the genotype through a regression model (Fisher (1918) Trans R Soc Edinburgh 52:388-433). The model can be modified to specify additive and dominance effects, and to include the effect of multiple loci. This model is the basis for most common tests for association between genotype and phenotype (Walsh (1998) “Genetics and Nanalusis of Quantitative Traits,” Sunderland: Sinauer Associates). A mean SNP (mSNP) is a SNP where any of the b are nonzero....

example 2

Genetic Variability Test

[0146]To identify vSNPs, a studentized general regression based test was adapted for differences in variances using an unrestricted model (Breusch and Pagan (1979) Econometrica 47:1287-94). The first step in the statistical test is to fit the Fisher model by least squares and form the residuals

ri=pi−{circumflex over (b)}0−{circumflex over (b)}11(gi=AA)−{circumflex over (b)}21(gi=AB)−{circumflex over (b)}31(gi=BB)

with estimated residual variance

σ^2=1N∑iri2.

The standardized, squared residuals, ûi=ri2−{circumflex over (σ)}−2 are regressed on the genotypes using the model

ûi=c0+cAA1(gi=AA)+cAa1(gi=AB)+cAa1(gi=BB)   (1)

[0147]The test statistic is equal to nR2 where n is the sample size and R2 is the coefficient of determination for model (Fisher (1918) Trans R Soc Edinburgh 52:388-433). The test statistic is compared to the X2(k) distribution where k is one less than the number of unique genotypes.

example 3

Data Collection, Processing, and Adjustment for Surrogate Variables

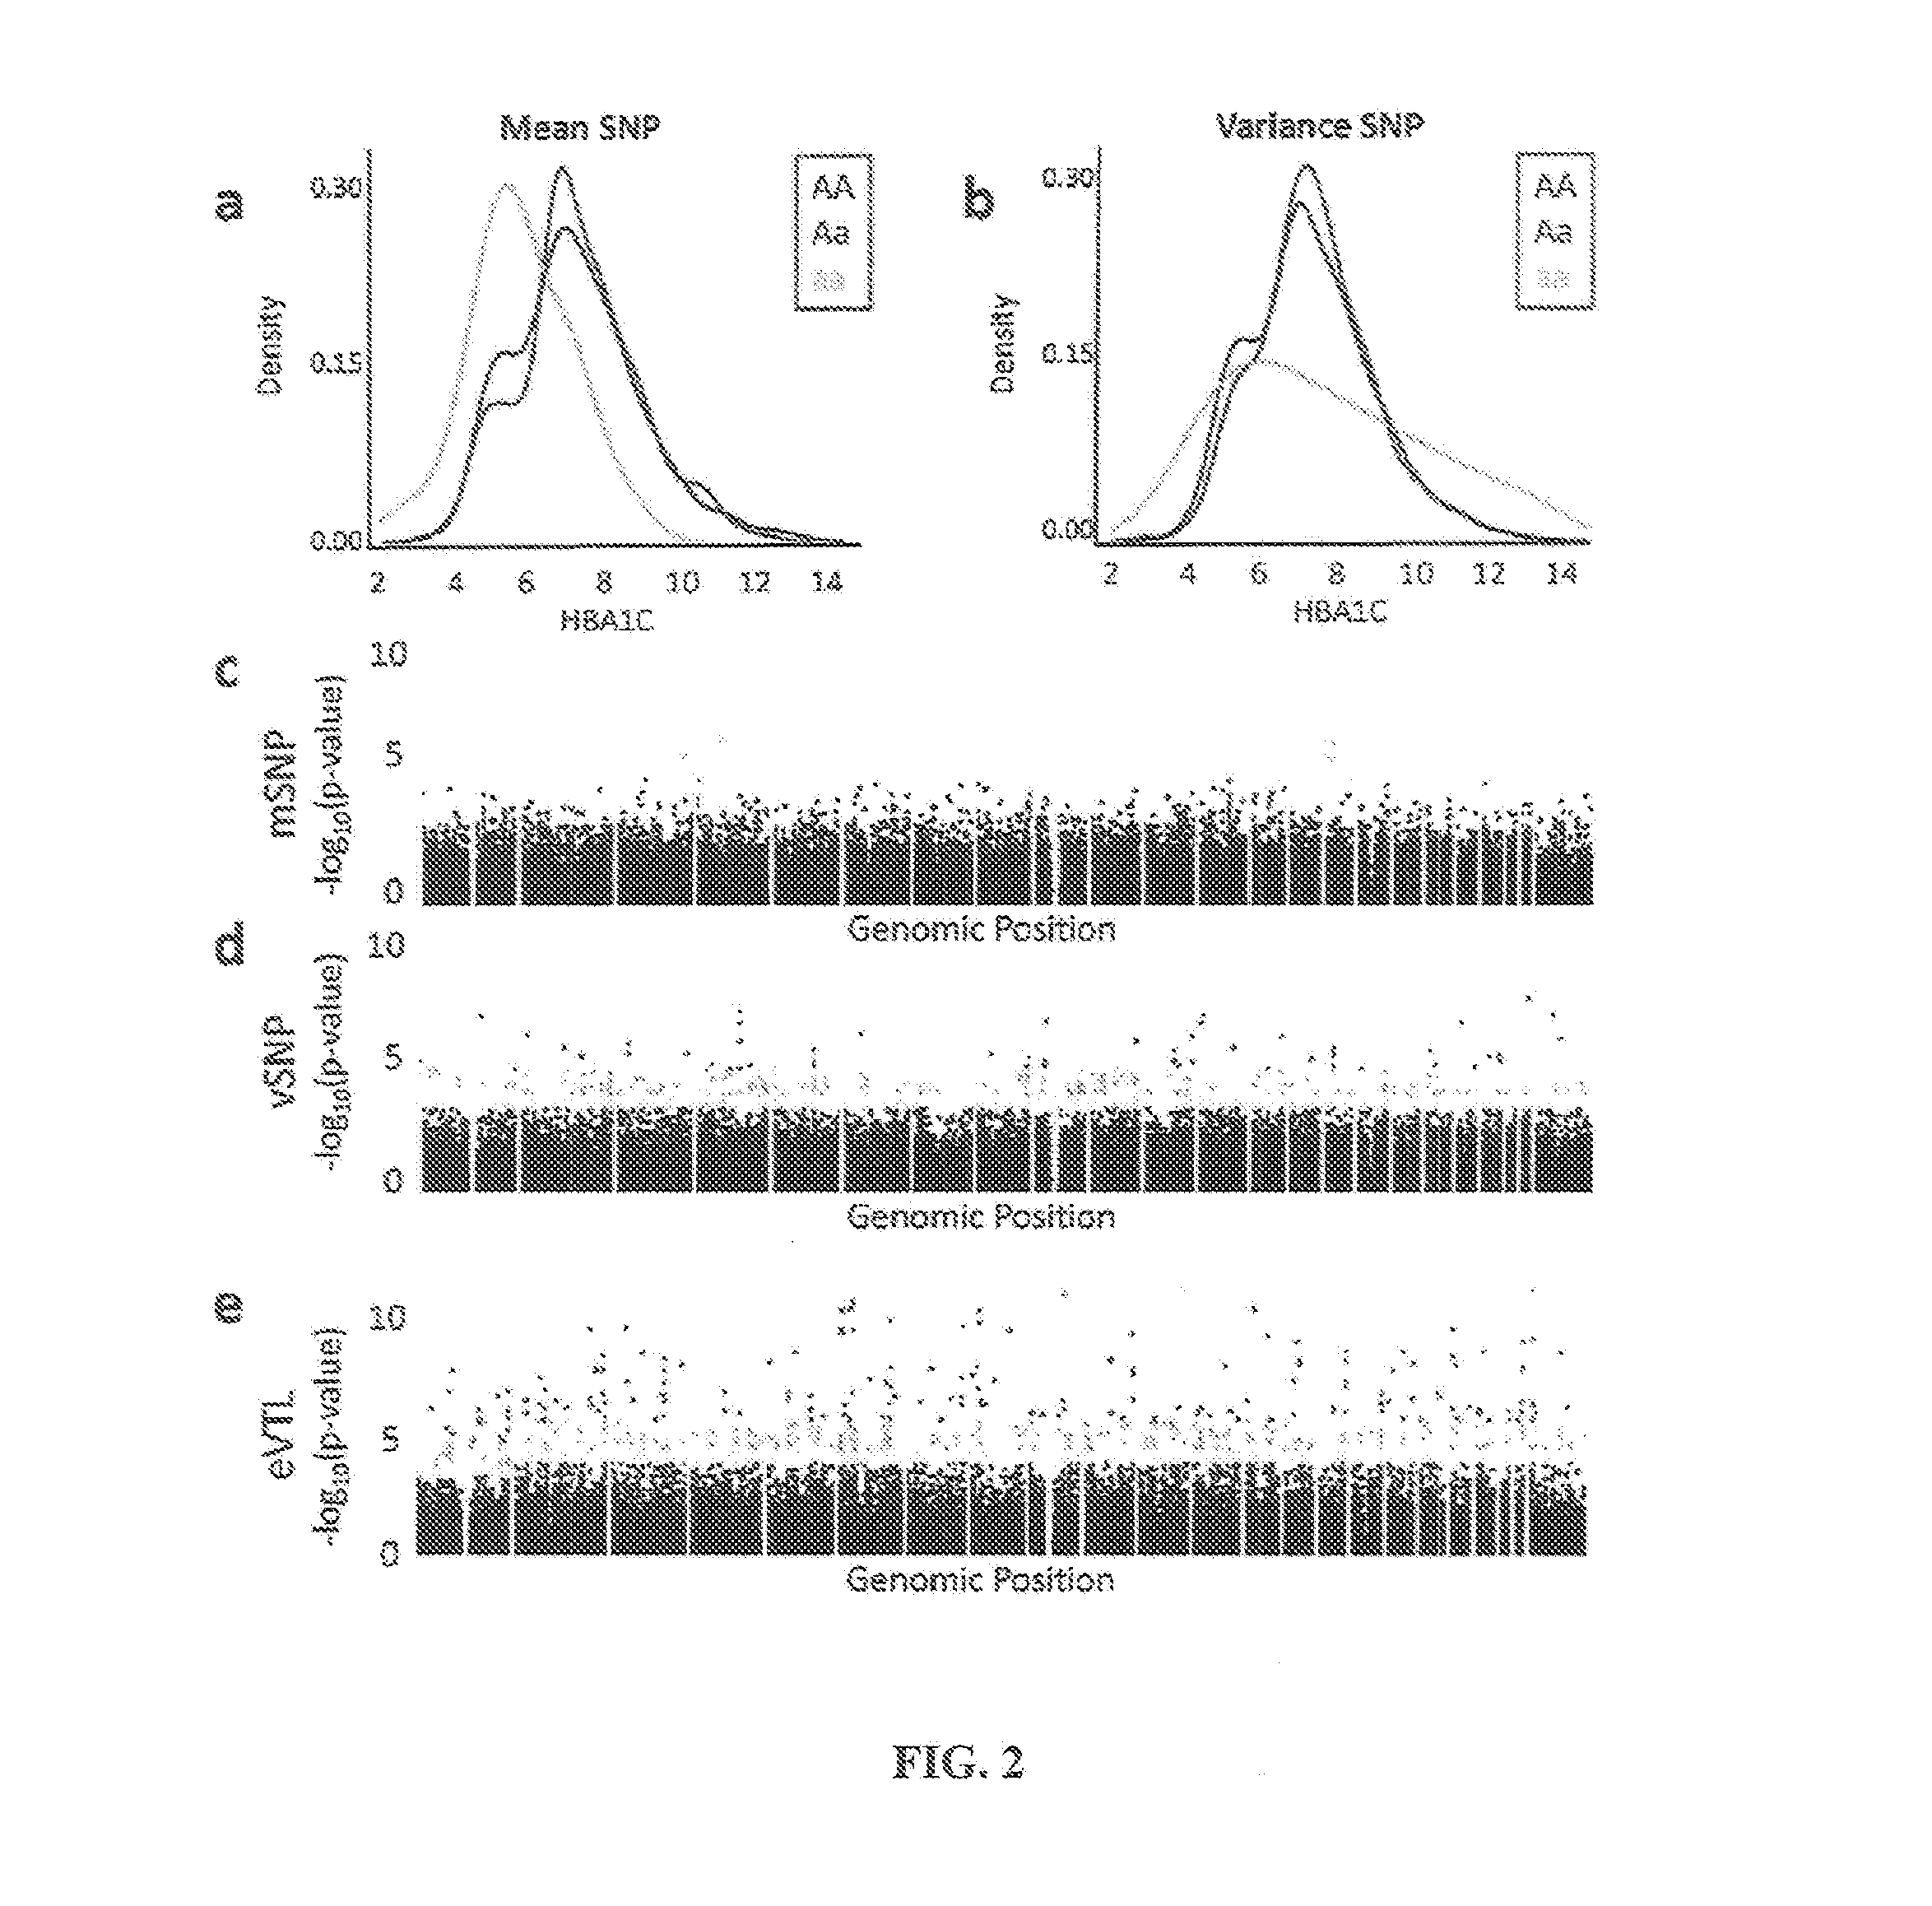
[0148]Data Collection: Genotypes are obtained for 1,225 unrelated individuals with HBA1C measurements from the Genetics of Kidneys in Diabetes study. Patient recruitment and genotyping were performed as previously described (Mueller et al. (2006) J Am Soc Nephrol 17:1782-90). The dataset used for the analyses described in this manuscript are obtained from the database of Genotype and Phenotype (dbGaP) found on the world wide web at ncbi.nlm.nih.gov / gap through dbGaP accession number phs000018.v1.p1. Samples and associated phenotype data for the Search for Susceptibility Genes for Diabetic Nephropathy in Type 1 diabetes are provided by the Genetics of Kidneys in Diabetes Study, J. H. Warram of the Joslin Diabetes Center, Boston, Mass., USA (PI). Genotype data are obtained on the 210 unrelated HapMap individuals (hapmap.ncbi.nlm.nih.gov). Normalized genome-wide gene expression data are obtained on the same individuals ...


PUM

PropertyMeasurementUnit
Timeaaaaaaaaaa
Volumeaaaaaaaaaa
Fractionaaaaaaaaaa

Abstract

Provided are methods and models for an alternative source of disease risk, which identifies not genetic variants for a phenotype per se, but variants for variability itself. Also provided are methods and models for a genome-scale, gene-specific analysis of DNA methylation in the same individuals over time, in order to identify a personalized epigenomic signature that may correlate with common genetic disease. Also provided are methods and models for simulating stochastic epigenetic variation as a driving force of development, evolutionary adaptation, and disease.

Description

GRANT INFORMATION[0001]This invention was made in part with government support under NIH Grant Nos. P50HG003233 and 2P50HG003323. The United States government has certain rights in this invention.BACKGROUND OF THE INVENTION[0002]1. Field of the Invention[0003]The invention relates generally to the field of epigenomics and more specifically to personal epigenomic analysis.[0004]2. Background Information[0005]First, the basis of modern disease association studies can be predicated on the “common disease common variant hypothesis,” which argues that frequent variants in the general population, that arose at a point of historical population restriction, are associated with genetic variants for common disease. The concept is rooted in the neo-Darwinian synthesis of the previous century, and the population genetic analysis of R. A. Fisher, who argued that complex (multigenic) phenotypes arise additively from individual quantitative trait loci (QTLs). A great deal of effort has been expend...

Claims


Application Information

Patent Timeline
IPC IPC(8): G06F19/18C12N15/10C12Q1/68G16B20/20G16B20/40
CPCG06F19/18C12Q1/6883C12N15/1072C12Q2600/154C12Q2600/156C12Q2600/158C12Q2600/172G16B20/00G16B20/20G16B20/40
Inventor FEINBERG, ANDREW P.LEEK, JEFFREY T.ASPELUND, THORGUDNASON, VILMUNDURFALLIN, M. DANIELEIRIZARRY, RAFAEL A.
Owner THE JOHN HOPKINS UNIV SCHOOL OF MEDICINE
Why Eureka
Try Eureka