Methods for dye selection for protein melt temperature determinations
a protein melt and temperature determination technology, applied in the field of dye selection for protein melt temperature determination, can solve the problems of requiring months of screening, affecting the quality of protein melt samples,
- Summary
- Abstract
- Description
- Claims
- Application Information
AI Technical Summary
Benefits of technology
Problems solved by technology
Method used
Image
Examples
example 1
Analysis of Protein Thermal Shift Assays for Protein-Ligand Complexes Using T4 DNA Ligase-ATP
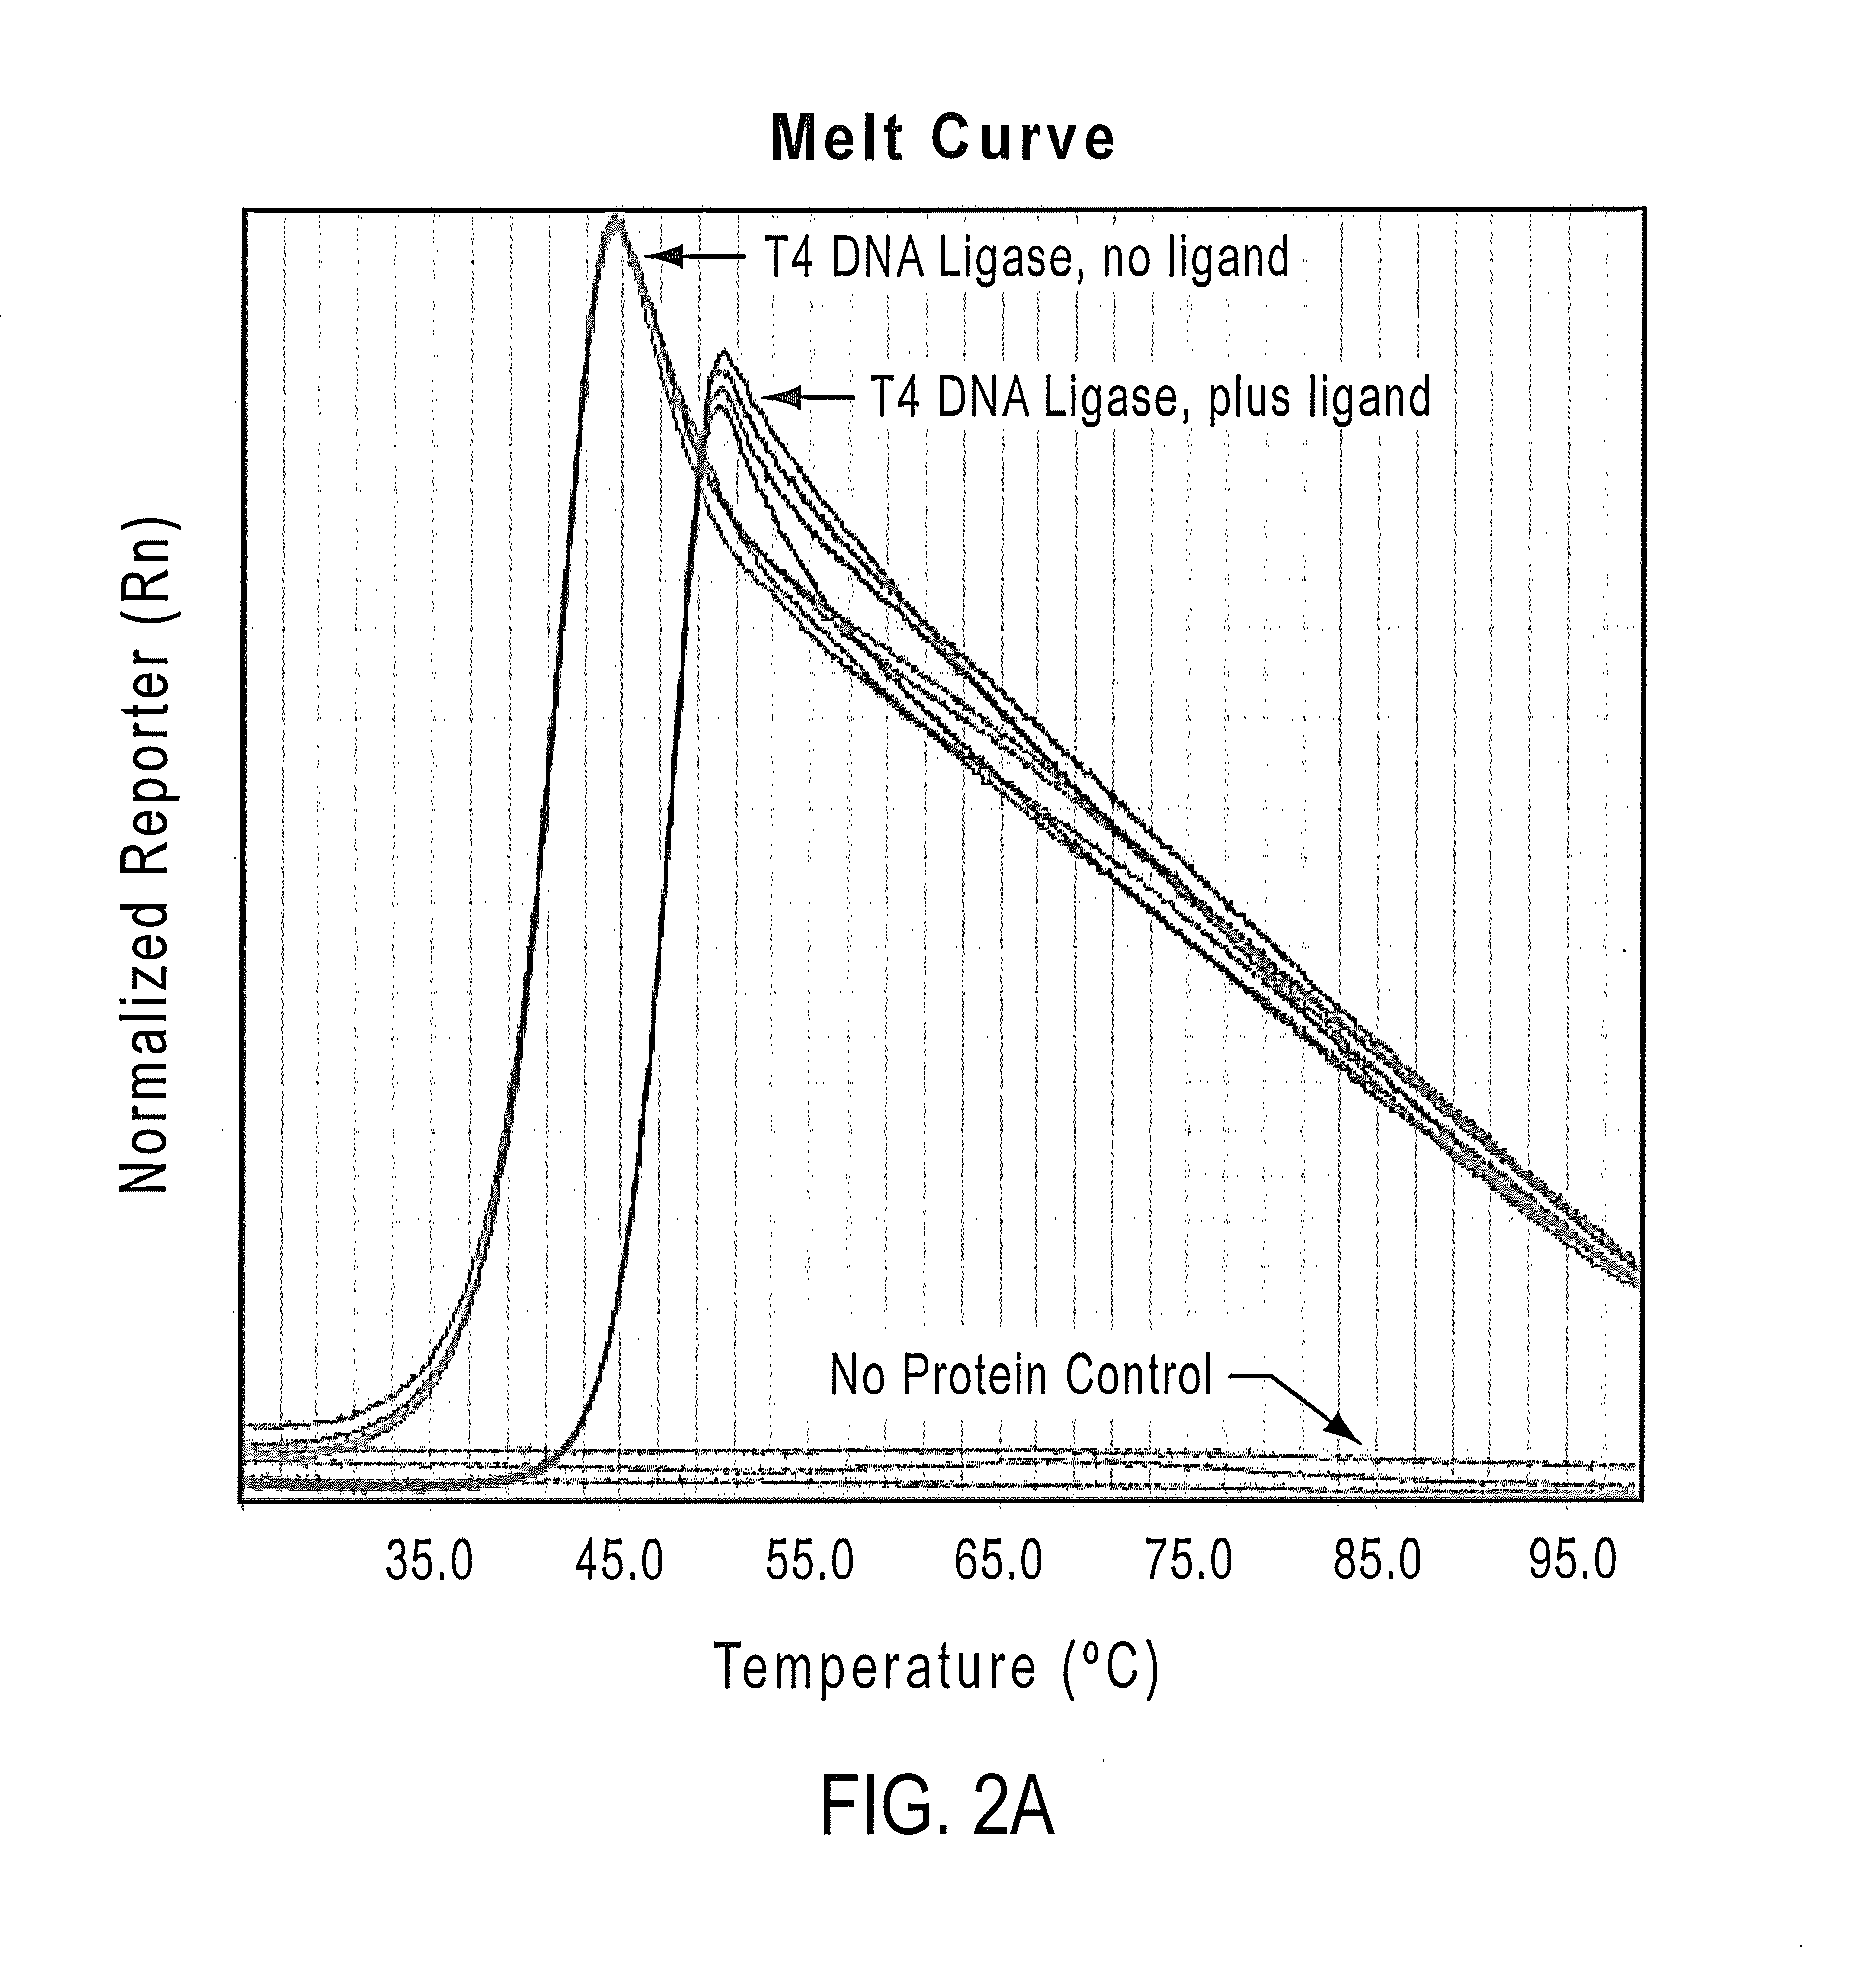
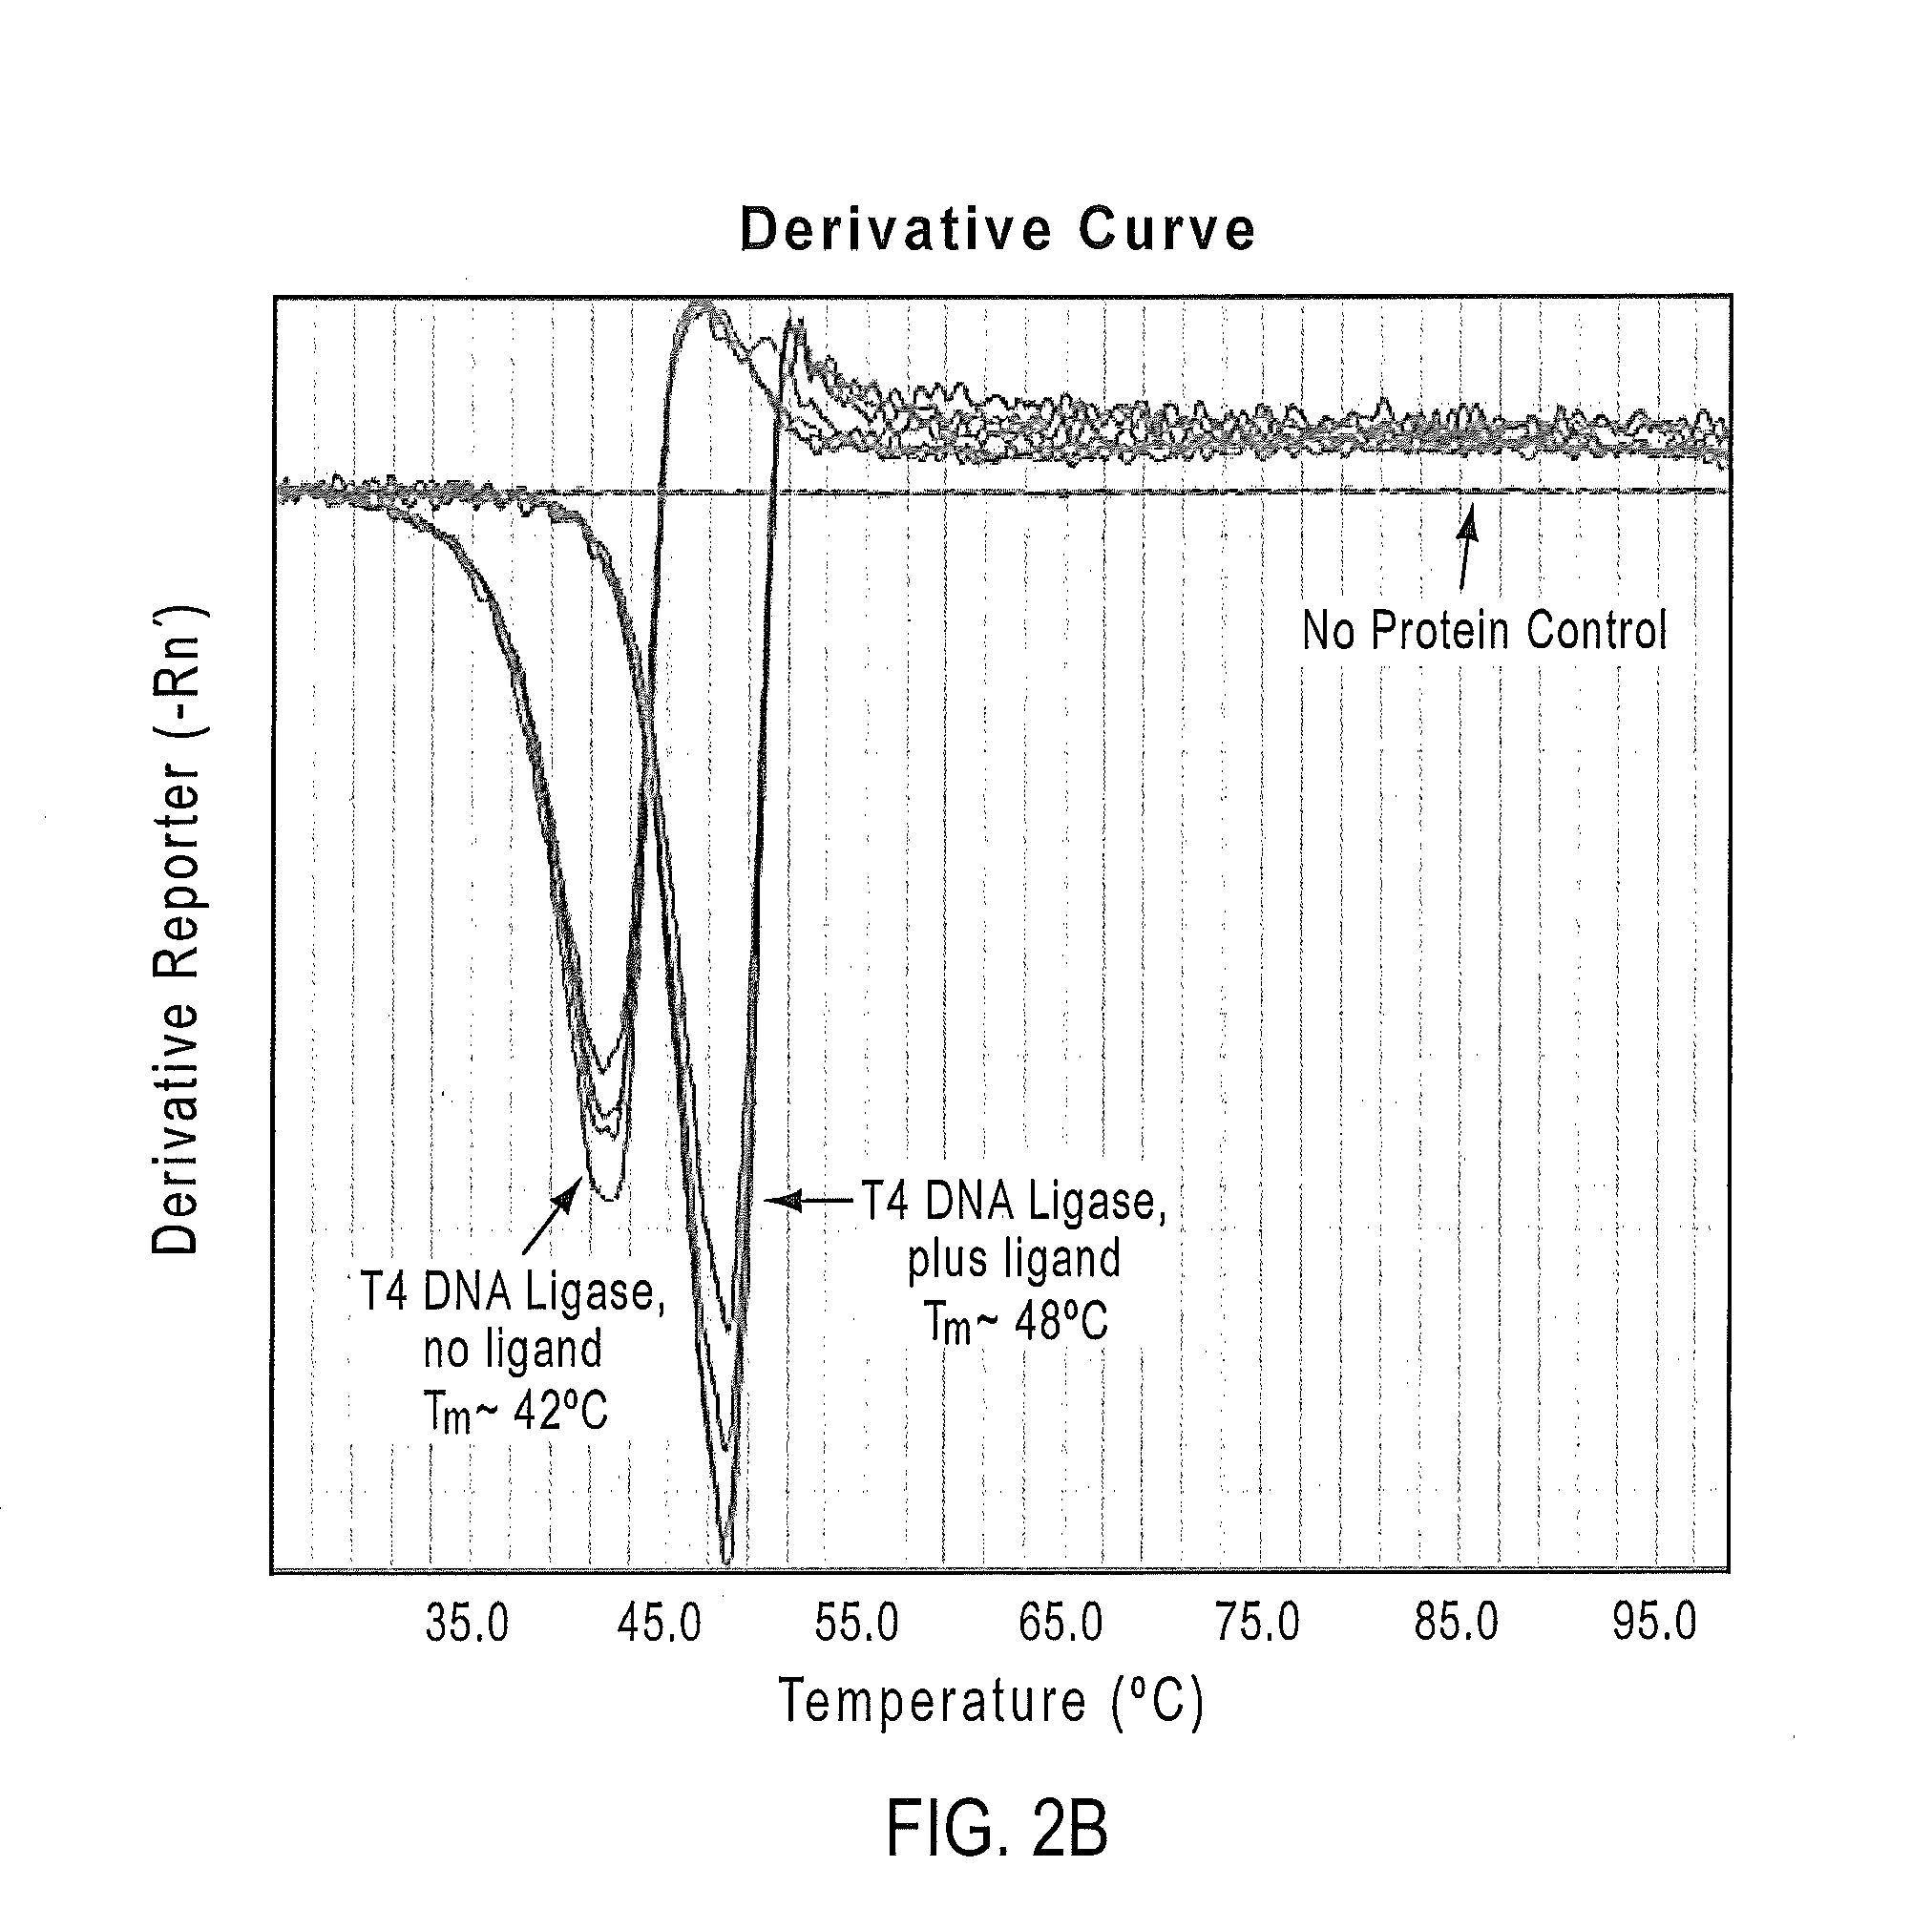
[0205]In Example 1, the utility of the PTS assay in buffer and ligand screening for T4 DNA ligase is demonstrated. It was found that the Tm of T4 DNA ligase shifted in the presence of ATP.
[0206]T4 DNA ligase is prepared in phosphate buffered saline (PBS; 137 mM NaCl, 10 mM Phosphate, 2.7 mM KCl, pH 7.4) and 5% glycerol at a concentration of 3 mg / ml of protein. T4 DNA ligase samples are prepared using SYPRO® Orange with and without ligand (ATP at 10 mM concentration). SYPRO® Orange dye solution is prepared as a 1000× stock from a 5000× stock solution in DMSO, then diluted to a 10× stock solution using 100 mM Potassium phosphate buffer. The SYPRO® Orange-protein reaction mixture is prepared by using 1 μl of the protein solution, 2 μl of the 10× dye solution, and 17 μl of the PTS buffer. Quadruplicate samples for each protein-dye mixture are run on a ViiA™ 7 qPCR instrument (Life Technologies, ...
example 2
Method of Calculating Tm from Protein Thermal Shift Assays
[0208]FIGS. 3A through 3C illustrate the method of calculating Tm from a typical PTS. The MATLAB based TmTool™ calculates the Tm of the protein from the shape of the fluorescence plot in FIG. 3a. The thermo-stability of RecA in different buffer and salt conditions is compared and the region of interest is fitted to the Boltzmann equation. RecA is prepared in phosphate buffered saline (PBS; 137 mM NaCl, 10 mM Phosphate, 2.7 mM KCl, pH 7.4) and 5% glycerol at a concentration of 3 mg / ml of protein. SYPRO® Orange dye solution is prepared as a 1000× stock from a 5000× stock solution in DMSO, then diluted to a 10× stock solution with PTS buffer.
TABLE 4Buffer Compositions.Sodium Chloride concentration in mMBuffer ID #0 mM50 mM100 mM150 mMA. 100 mM SodiumA1A2A3A4Citrate, pH 5.5B. 100 mM PotassiumB1B2B3B4Phosphate, pH 6.0C. 100 mM PotassiumC1C2C3C4Phosphate, pH 7.0D. 100 mM HEPES,D1D2D3D4pH 7.5
[0209]Experimental buffers are made as sh...
example 3
Effect of Point Mutations on PTS. Effect of Complexation with a Ligand
[0211]An assay was set up to determine whether a PTS Assay can differentiate between point mutations in a protein that affect the thermal stability of the protein.
[0212]In FIGS. 3A through 3D, the PTS data (generated on a StepOnePlus™ instrument (Life Technologies, Inc.)) shows the normalized reporter and derivative melt profiles from experimental SuperScript® II (SSII) and SuperScript® III (SSIII) mutants. Data was collected at 1° C. intervals from 25° C. through to 99° C. FIG. 3A shows a melt curve with a normalized reporter for three point mutants of SSII and SSSIII. FIG. 3B shows the first derivative graph of the PTS of FIG. 3A, demonstrating that an averaged Tm of 43.8° C. is found for a first point mutant, a Tm of 49.2° C. for a second point mutant, and 55.5° C. for a third point mutant for SSI or SSIII. FIG. 5C shows a melt curve with a normalized reporter for each of the above point mutants complexed with ...
PUM
| Property | Measurement | Unit |
|---|---|---|
| stability | aaaaa | aaaaa |
| fluorescent | aaaaa | aaaaa |
| covalent | aaaaa | aaaaa |
Abstract
Description
Claims
Application Information
 - R&D
- Intellectual Property
- Life Sciences
- Materials
- Tech Scout
- Unparalleled Data Quality
- Higher Quality Content
- 60% Fewer Hallucinations
Browse by: Latest US Patents, China's latest patents, Technical Efficacy Thesaurus, Application Domain, Technology Topic, Popular Technical Reports.
© 2025 PatSnap. All rights reserved.Legal|Privacy policy|Modern Slavery Act Transparency Statement|Sitemap|About US| Contact US: help@patsnap.com


