Use of divalent metals for enhancement of fluorescent signals
a technology of divalent metals and fluorescent signals, applied in the field of dimeric and polymeric fluorescent or colored dyes, can solve the problems that the brightness of known dimeric and polymeric dyes has not been increased the desired degree of
- Summary
- Abstract
- Description
- Claims
- Application Information
AI Technical Summary
Benefits of technology
Problems solved by technology
Method used
Image
Examples
example 1
Synthesis of Dyes with Ethylene Glycol Spacer
[0411]Compounds with ethylene oxide linkers were prepared as followed:
[0412]The oligofluoroside constructs (i.e., compounds of structure (I)) were synthesized on an Applied Biosystems 394 DNA / RNA synthesizer on 1 μmol scale and possessed a 3′-phosphate group or 3′-S2—(CH2)6—OH group or any of the other groups described herein. Synthesis was performed directly on CPG beads or on Polystyrene solid support using standard phopshoporamadite chemistry. The oligofluorosides were synthesized in the 3′ to 5′ direction using standard solid phase DNA methods, and coupling employed standard β-cyanoethyl phosphoramidite chemistry. Fluoroside phosphoramidite and spacers (e.g., hexaethyloxy-glycol phosphoramidite, triethyloxy-glycol phosphoramidite, polyethylene glycol phosphoramidite) and linker (e.g., 5′-amino-Modifier Phosphoramidite and thiol -Modifiers S2 Phosphoramidite) were dissolved in acetonitrile to make 0.1 M solutions, and were added in suc...
example 2
Spectral Testing of Compounds
[0415]Dried compounds were reconstituted in 150 μL of 0.1M Na2CO3 buffer to make a ˜1 mM stock. The concentrated stock was diluted 50× in 0.1×PBS and analyzed on a NanoDrop UV spectrometer to get an absorbance reading. Absorbance readings were used along with the extinction coefficient (75,000 M−1 cm−1 for each FAM unit) and Beer's Law to determine an actual concentration of the stock.
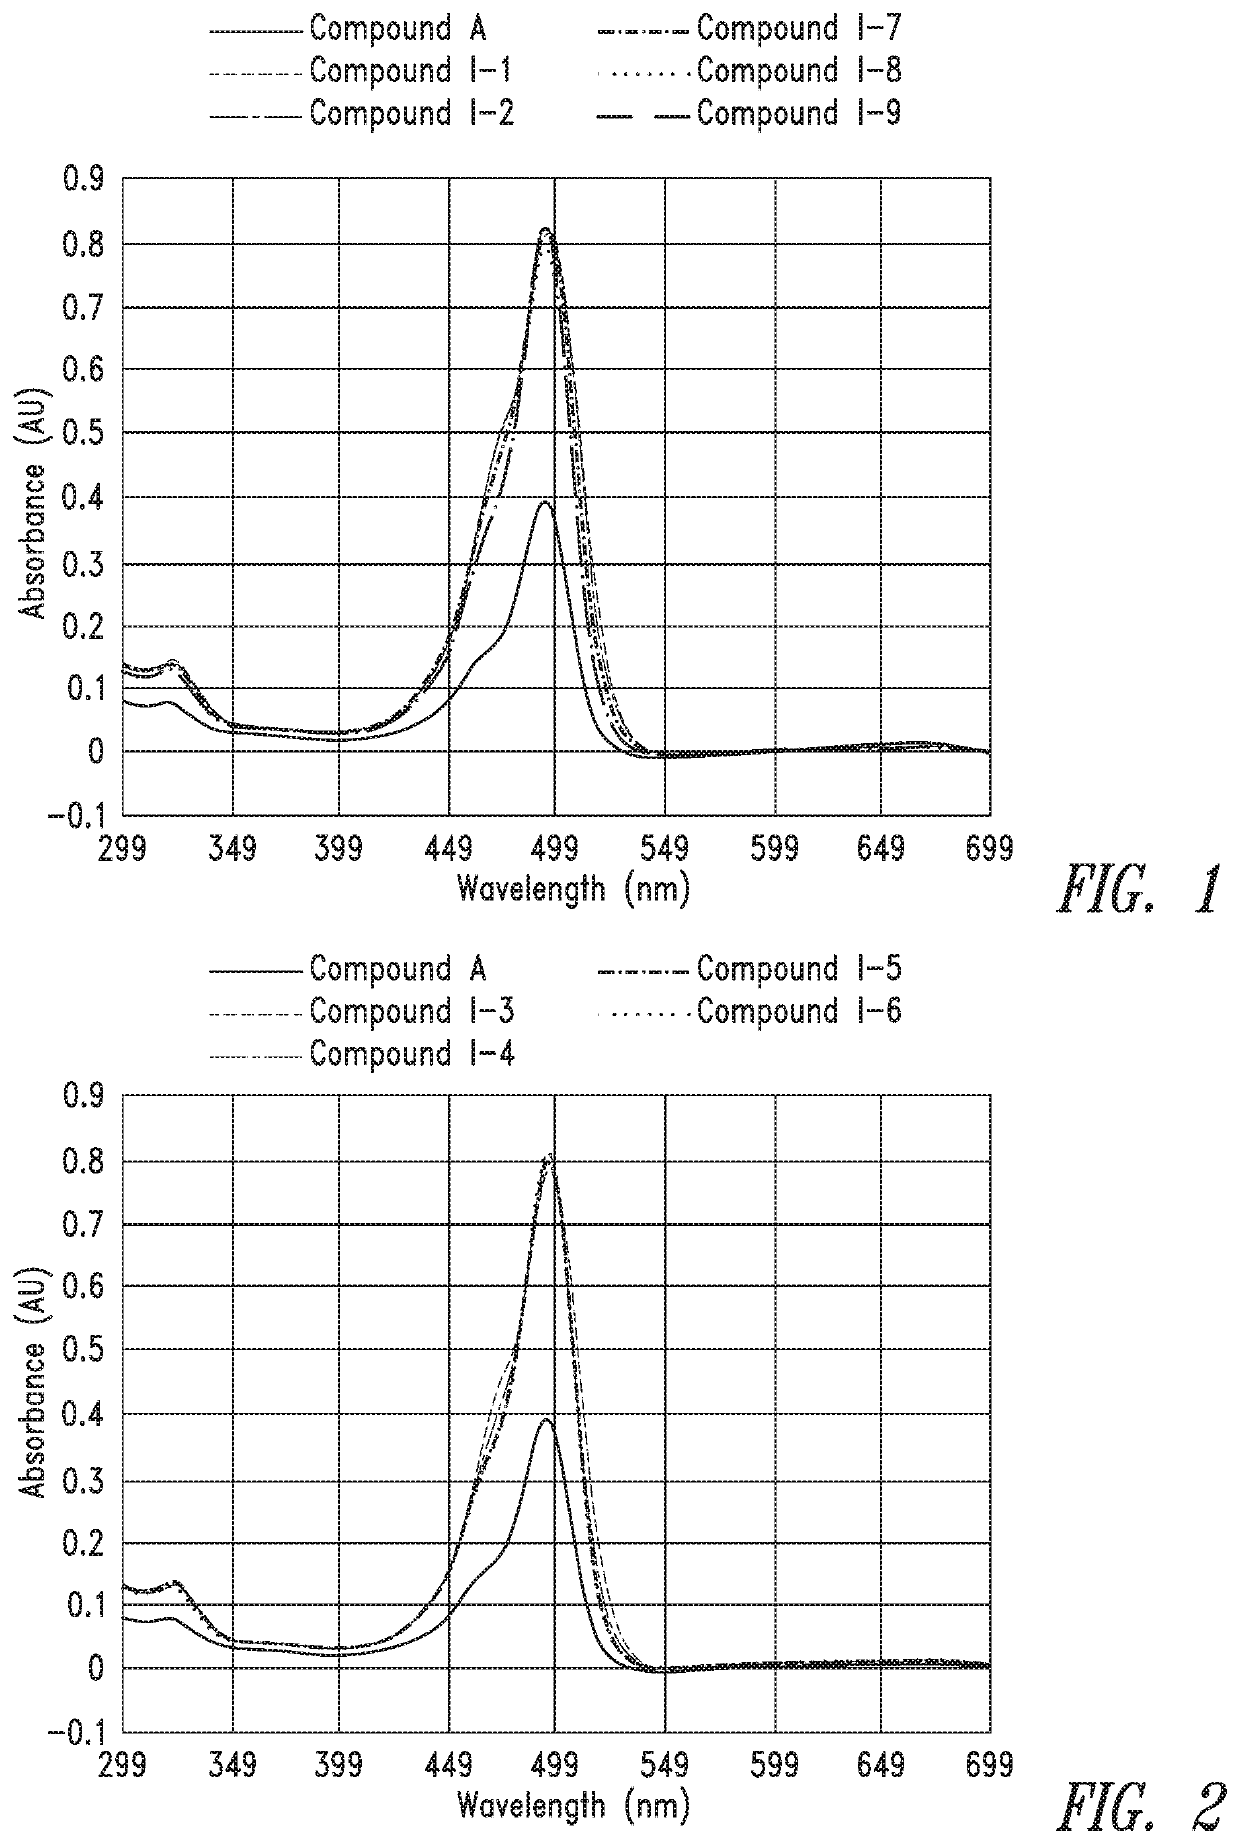
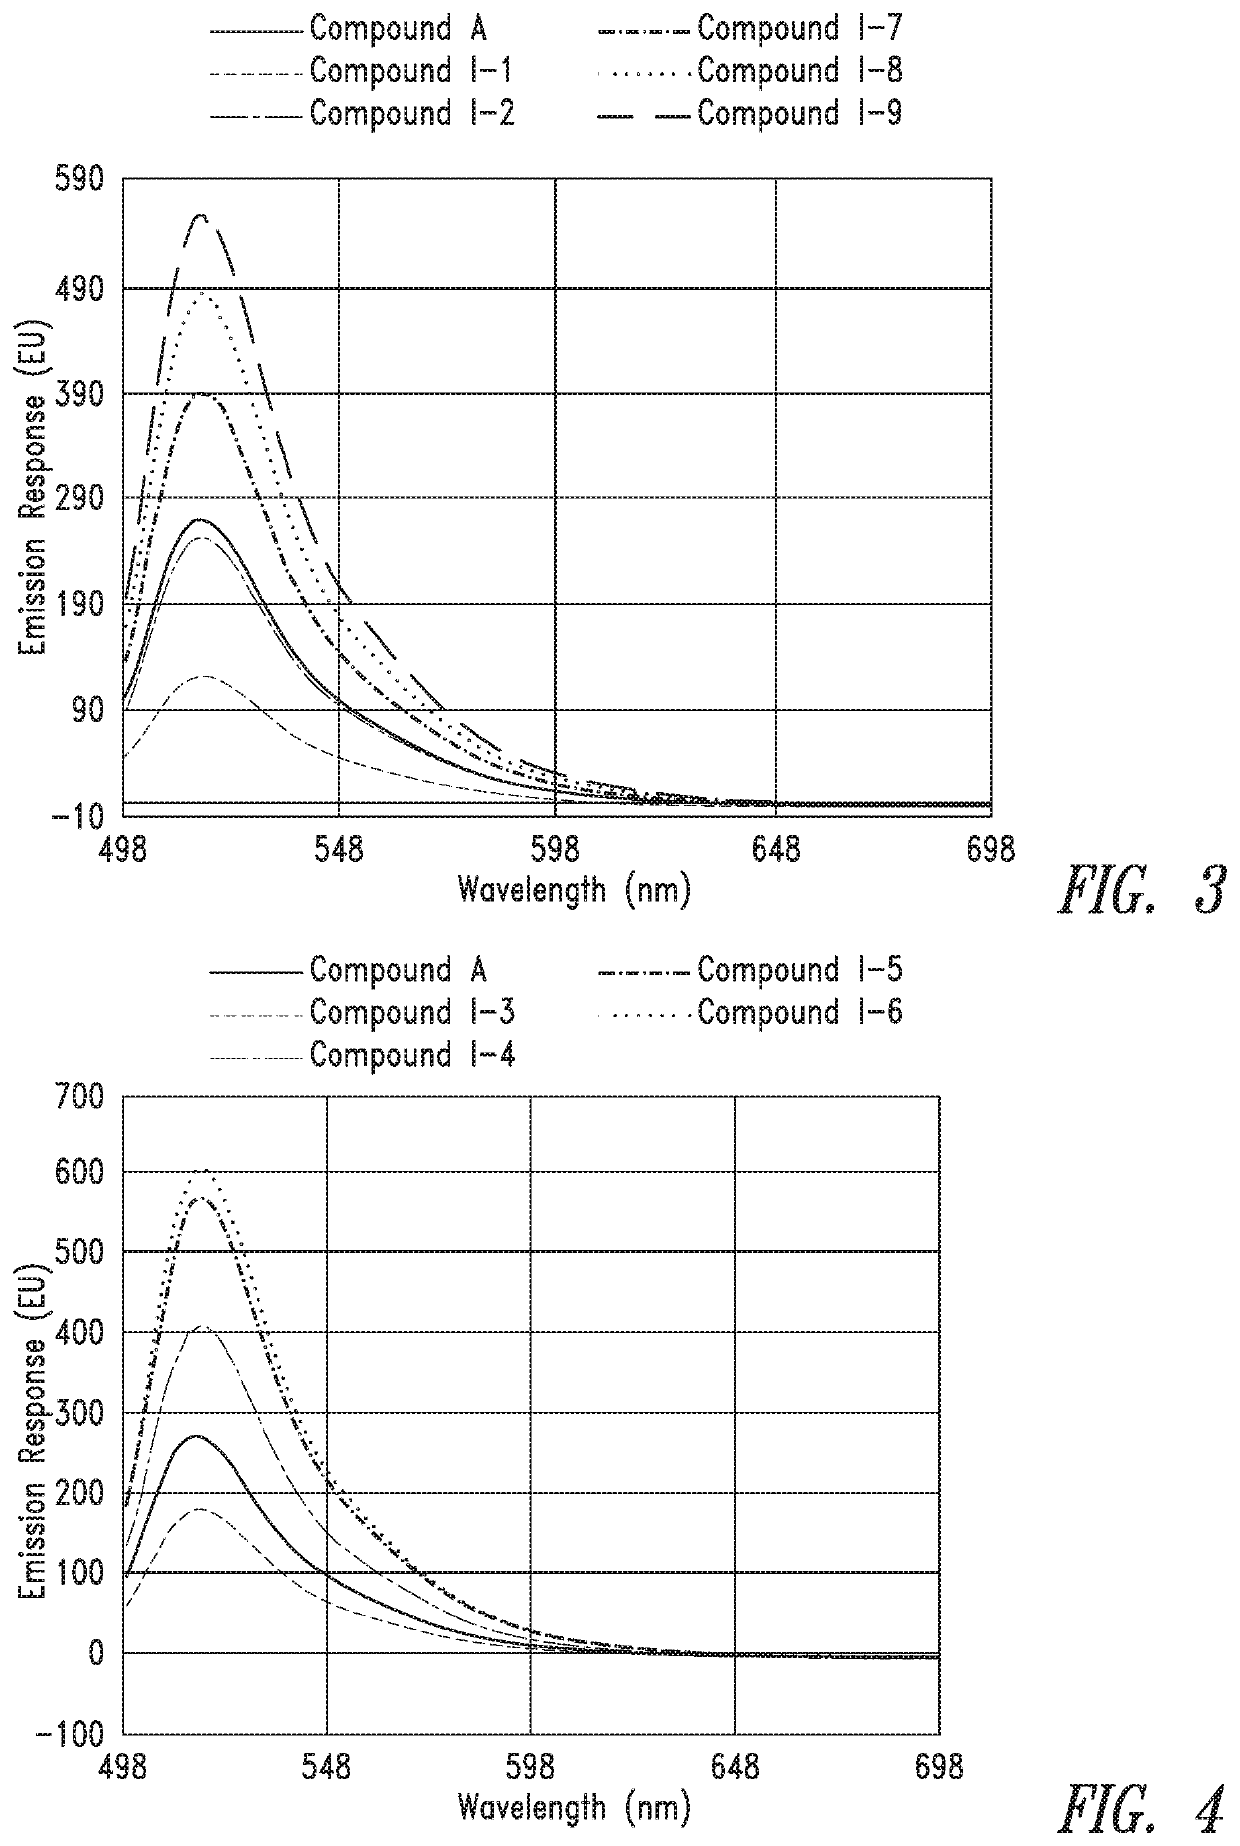
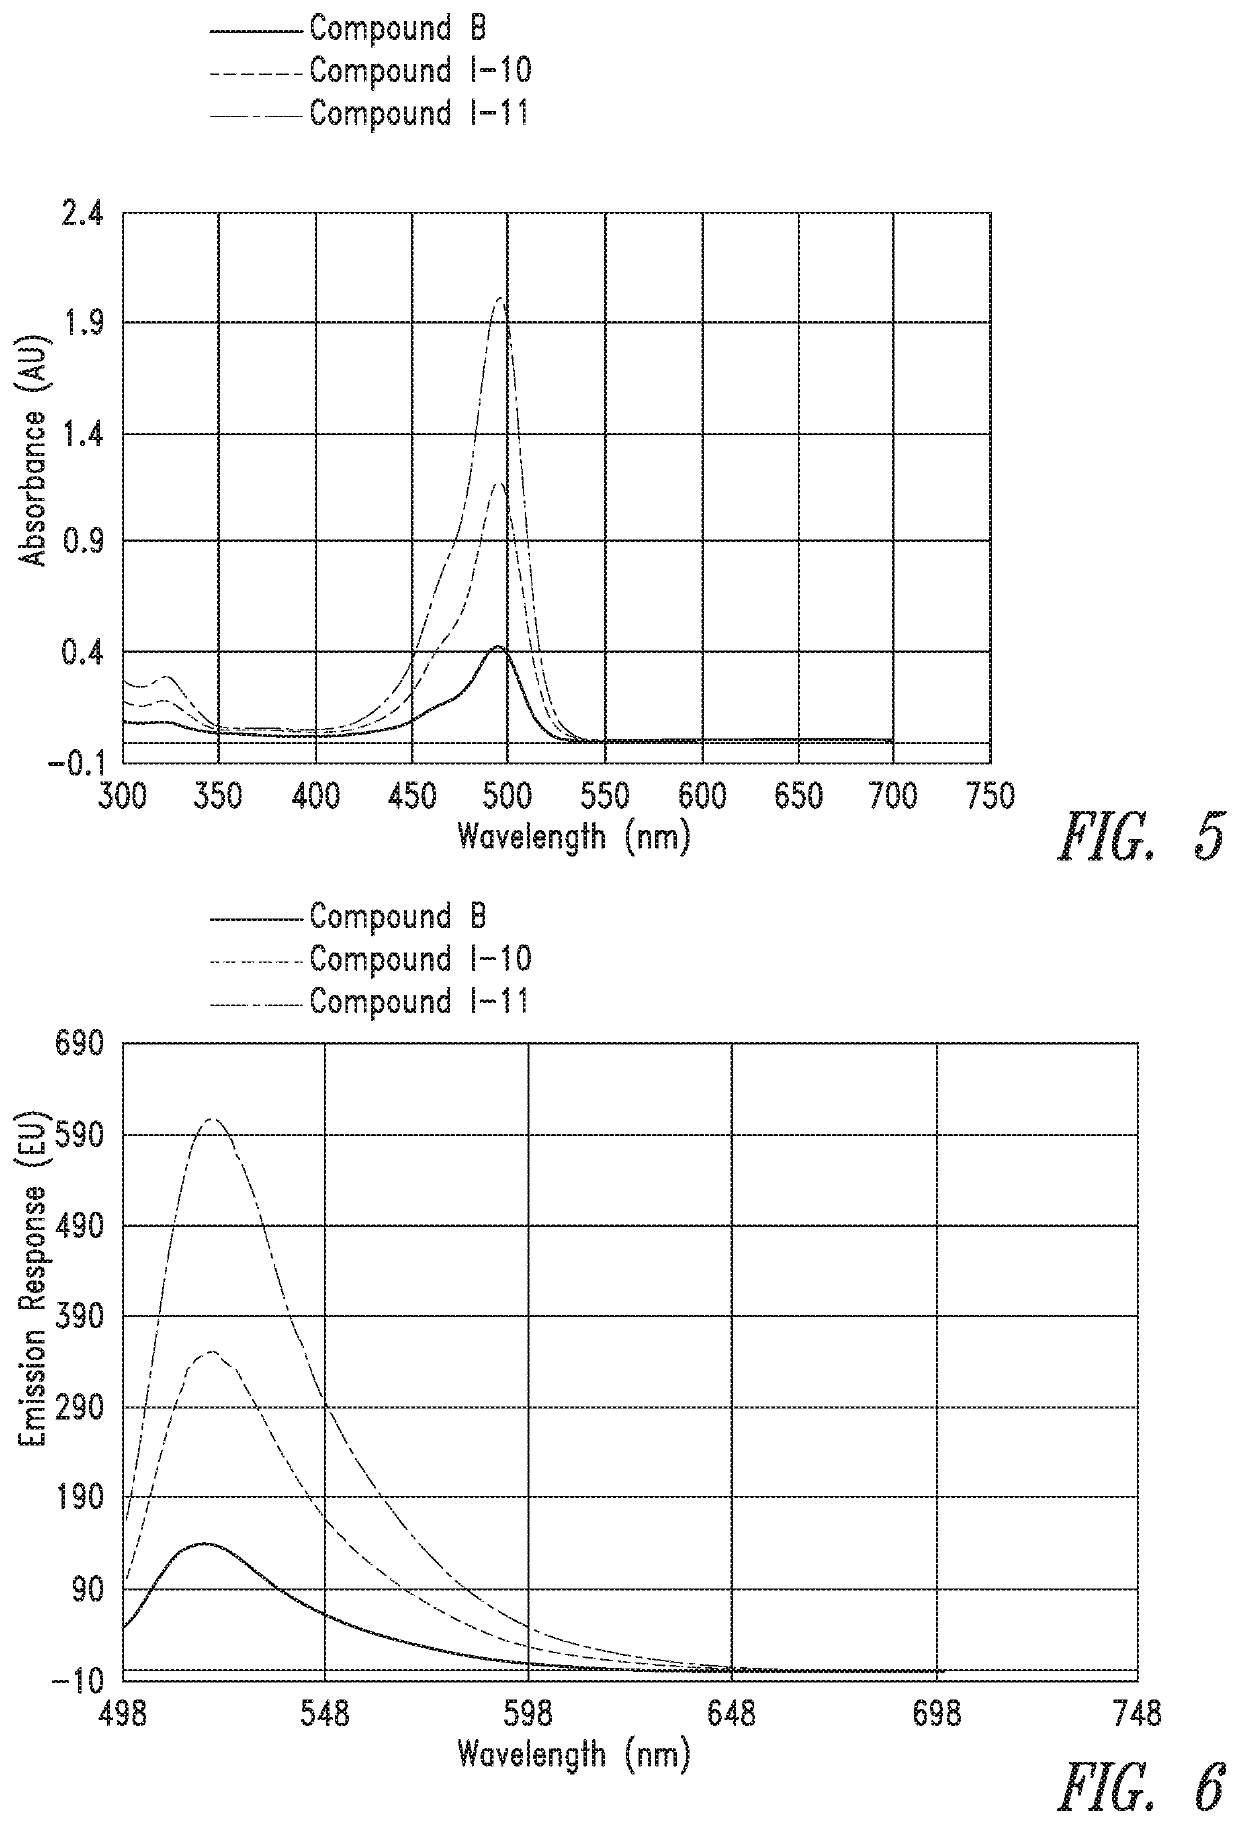
[0416]From the calculated stock concentrations, ˜4 mL of a 5 μM solution was made in 0.1M Na2CO3 (pH 9) and analyzed in a 1×1 cm quartz cuvette on a Cary 60 UV spectrometer, using a spectral range of 300 nm to 700 nm, to gauge overall absorbance relative to the group. From these 5 μM solutions, a second dilution was made at either 50 nM or 25 nM (also in 0.1M Na2CO3, pH 9) for spectral analysis on a Cary Eclipse Fluorimeter. Excitation was set at 494 nm and emission spectra were collected from 499 to 700 nm.
[0417]FIG. 1 and FIG. 2 provide the UV absorbance of representative...
example 3
Comparative Fluorescence Emission Response
[0421]Compounds “HEG,”“TEG,”“C2,”“C3,”“C4” and “C6,” wherein R2 and R3 are as defined for compound I-3 and m varied from 1 to 9, were prepared and their fluorescence emission spectra determined. Results are presented in FIG. 7. The data show that compounds according to embodiments of the present invention (i.e., HEG and TEG) have increased fluorescence emission with fewer repeating spacer moieties (i.e., lower values of m) relative to other dye compounds.
[0422]FIG. 8 provides data comparing fluorescence emission for the “HEG” compound, wherein m is 1, 2 or 3, relative to Compound A (50 nM, pH=9). The data show an increase in fluorescence emission for HEG relative to Compound A when m is greater than 2.
PUM
| Property | Measurement | Unit |
|---|---|---|
| pH | aaaaa | aaaaa |
| pH | aaaaa | aaaaa |
| pH | aaaaa | aaaaa |
Abstract
Description
Claims
Application Information
 - R&D
- Intellectual Property
- Life Sciences
- Materials
- Tech Scout
- Unparalleled Data Quality
- Higher Quality Content
- 60% Fewer Hallucinations
Browse by: Latest US Patents, China's latest patents, Technical Efficacy Thesaurus, Application Domain, Technology Topic, Popular Technical Reports.
© 2025 PatSnap. All rights reserved.Legal|Privacy policy|Modern Slavery Act Transparency Statement|Sitemap|About US| Contact US: help@patsnap.com


