System for scatterometric measurements and applications

a scatterometric and scatterometer technology, applied in the field of scatterometers, can solve the problems of difficult refinement and time-consuming calculation of the multi-dimensional look up table used in conventional scatterometry, and achieve the effects of improving the most time-consuming and least robust part of modelling, improving the accuracy of the calculation, and simplifying the processing

Inactive Publication Date: 2006-08-29
KLA TENCOR TECH CORP
View PDF11 Cites 51 Cited by
  • Summary
  • Abstract
  • Description
  • Claims
  • Application Information

AI Technical Summary

Benefits of technology

[0011]To speed up the process of matching measured data from the diffracting structure to those provided by the model which includes calculation of eigenvalues, the processing can be simplified and made faster by storing the eigenvalues so that the eigenvalues will not have to be recalculated every time matching is performed for different diffraction structures. The eigenvalues are then used to obtain the value of one or more parameters of a diffracting structure from measured data from the structure. In another embodiment, a look up table of the eigenvalues may also be pre-computed so that any eigenvalue within the needed range may be calculated with interpolation from the eigenvalue look up table. This will make the calculation of eigenvalues easier, faster, and more reliable, which improves the most time consuming and least robust part of modelling.
[0012]The diffracting structure measured frequently sits underneath and / or over a stack of one or more layers of material so that when electromagnetic radiation is directed at the structure to perform measurements, the measurements will be affected by the effects of such layers on the measurements. Therefore, where measurement of the structure is carried out by directing a polychromatic beam of electromagnetic radiation and detecting corresponding data of a diffraction of the beam at a number of wavelengths, the wavelengths at which the data on the structure is measured may be chosen as a function of the properties of the one or more layers. In one example, the wavelengths are chosen so that the measurements are less affected by the properties of the one or more layers. In this manner, measurement of similar structures will be less affected by the different layers in their vicinity.

Problems solved by technology

As noted above, the multi-dimensional look up table used in conventional scatterometry is extremely time consuming to calculate and difficult to refine.

Method used


Image

  • System for scatterometric measurements and applications
  • System for scatterometric measurements and applications
  • System for scatterometric measurements and applications

Examples


Embodiment Construction

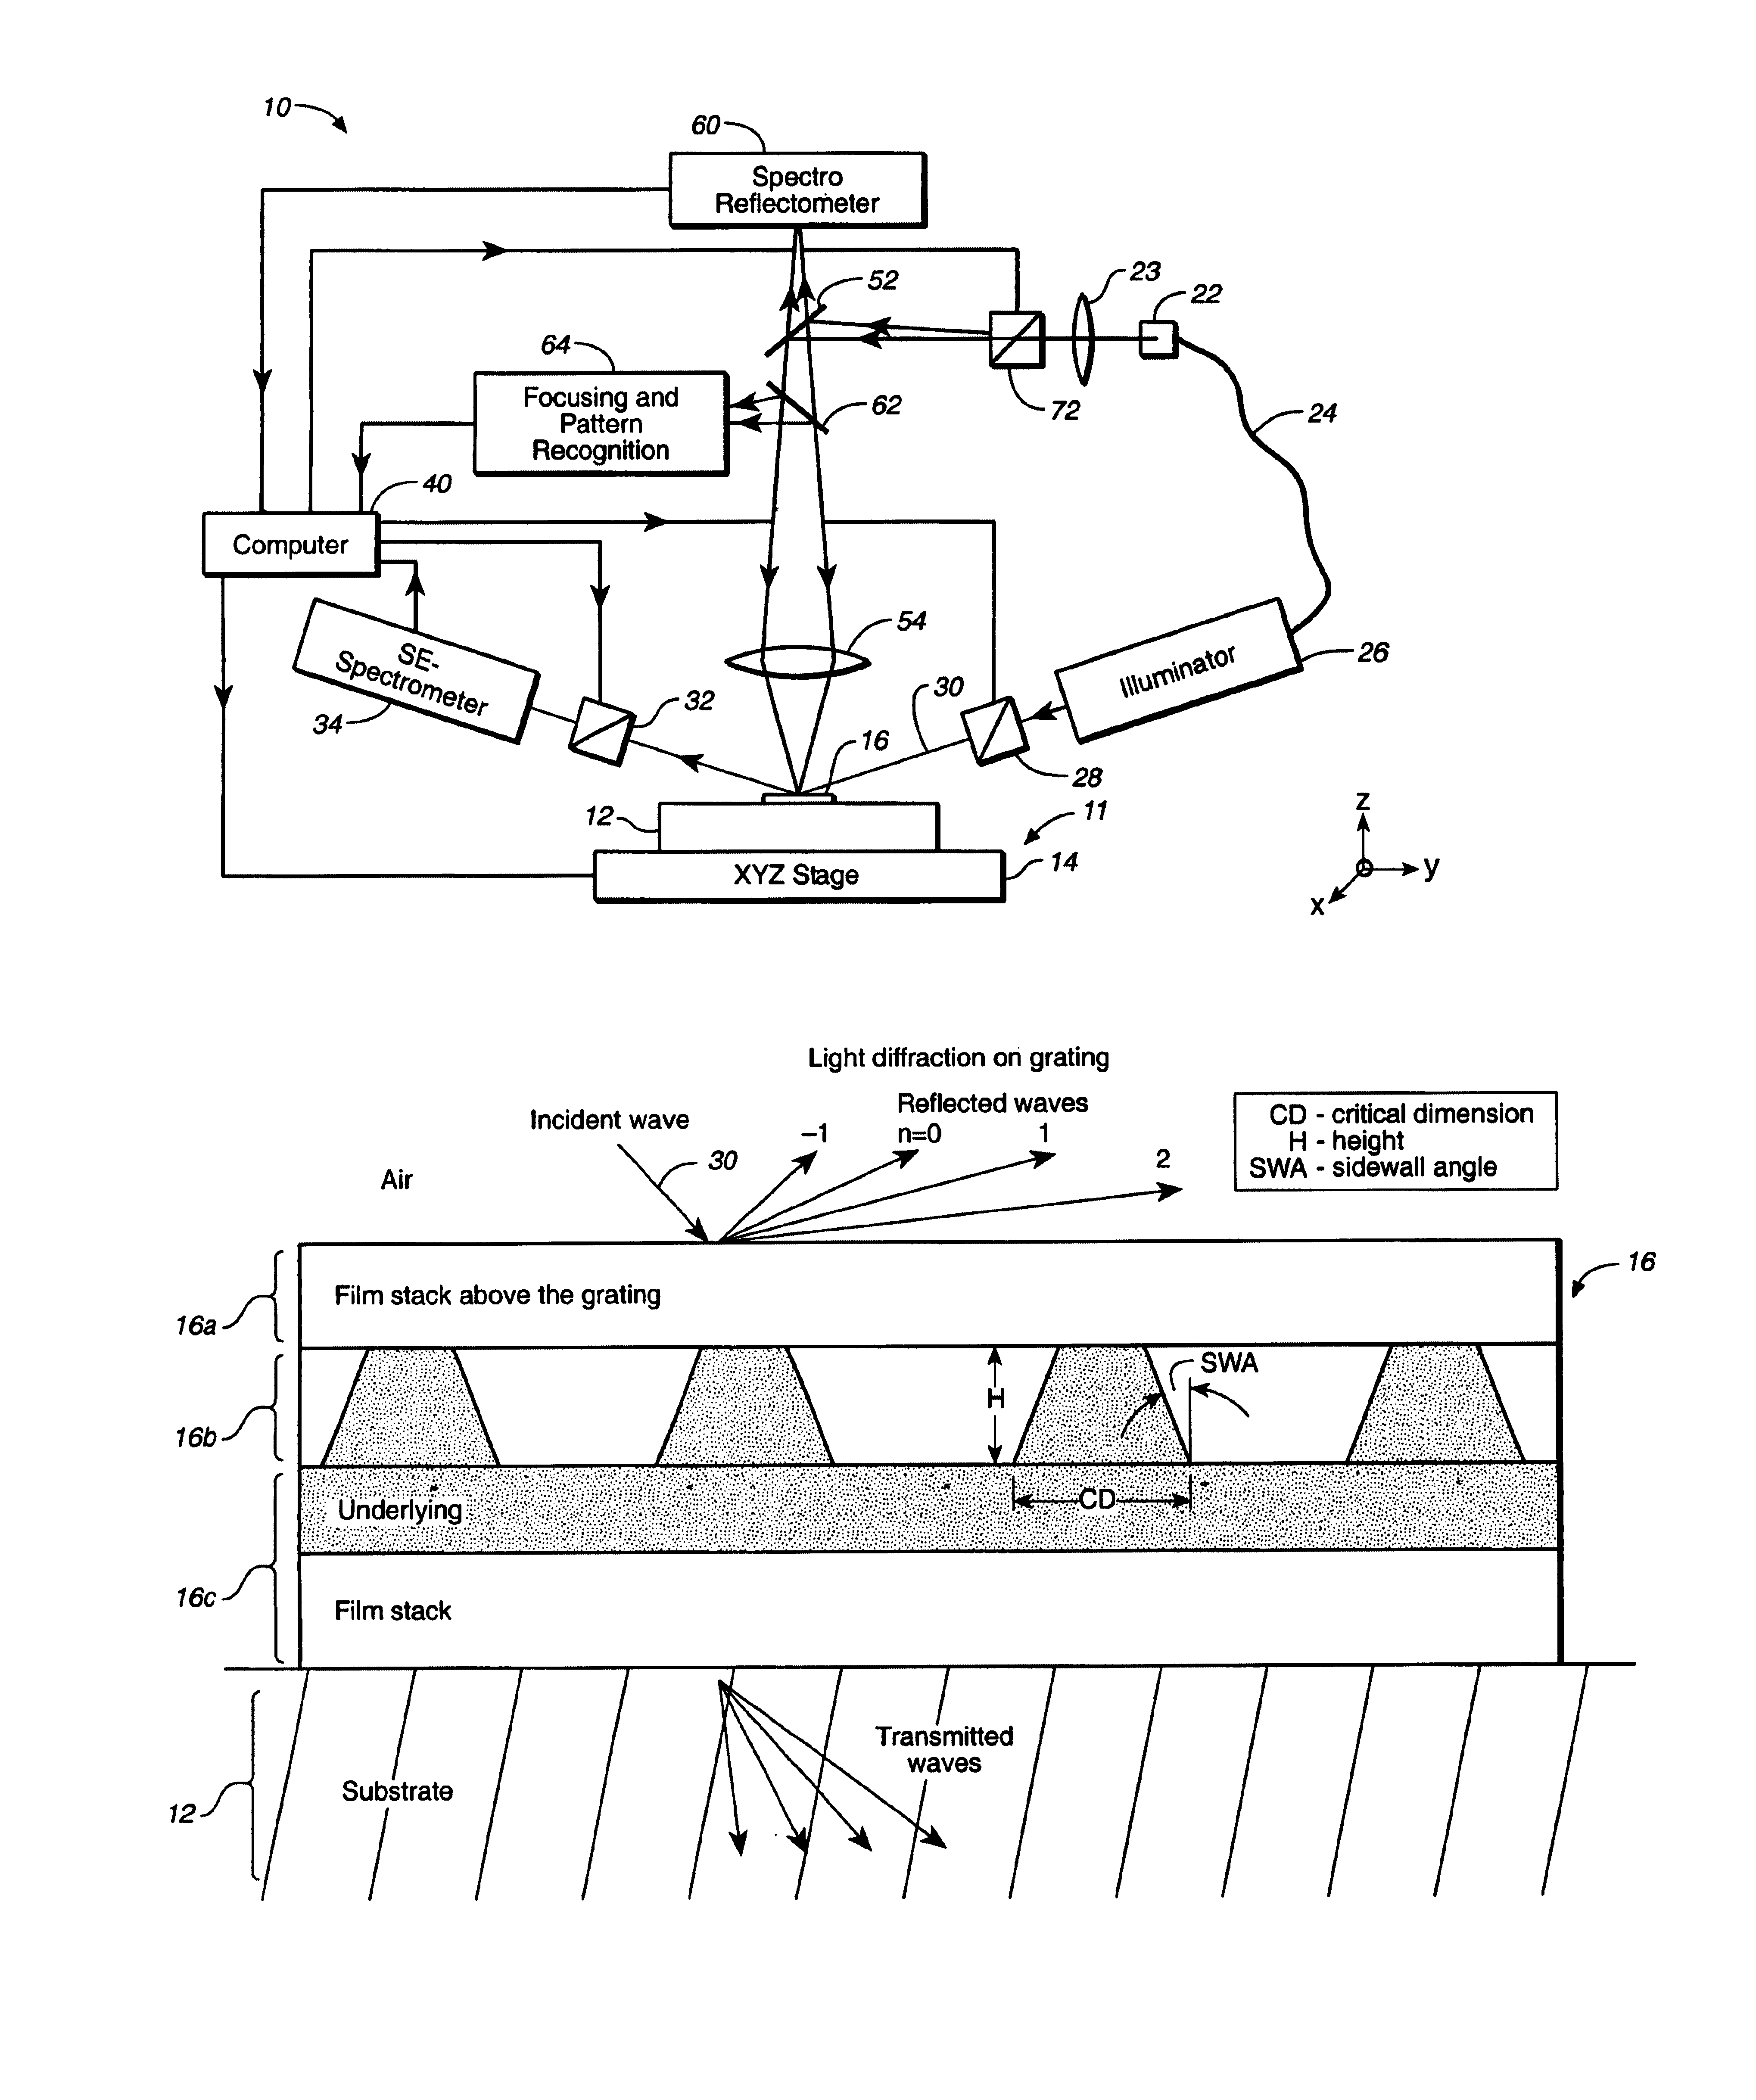
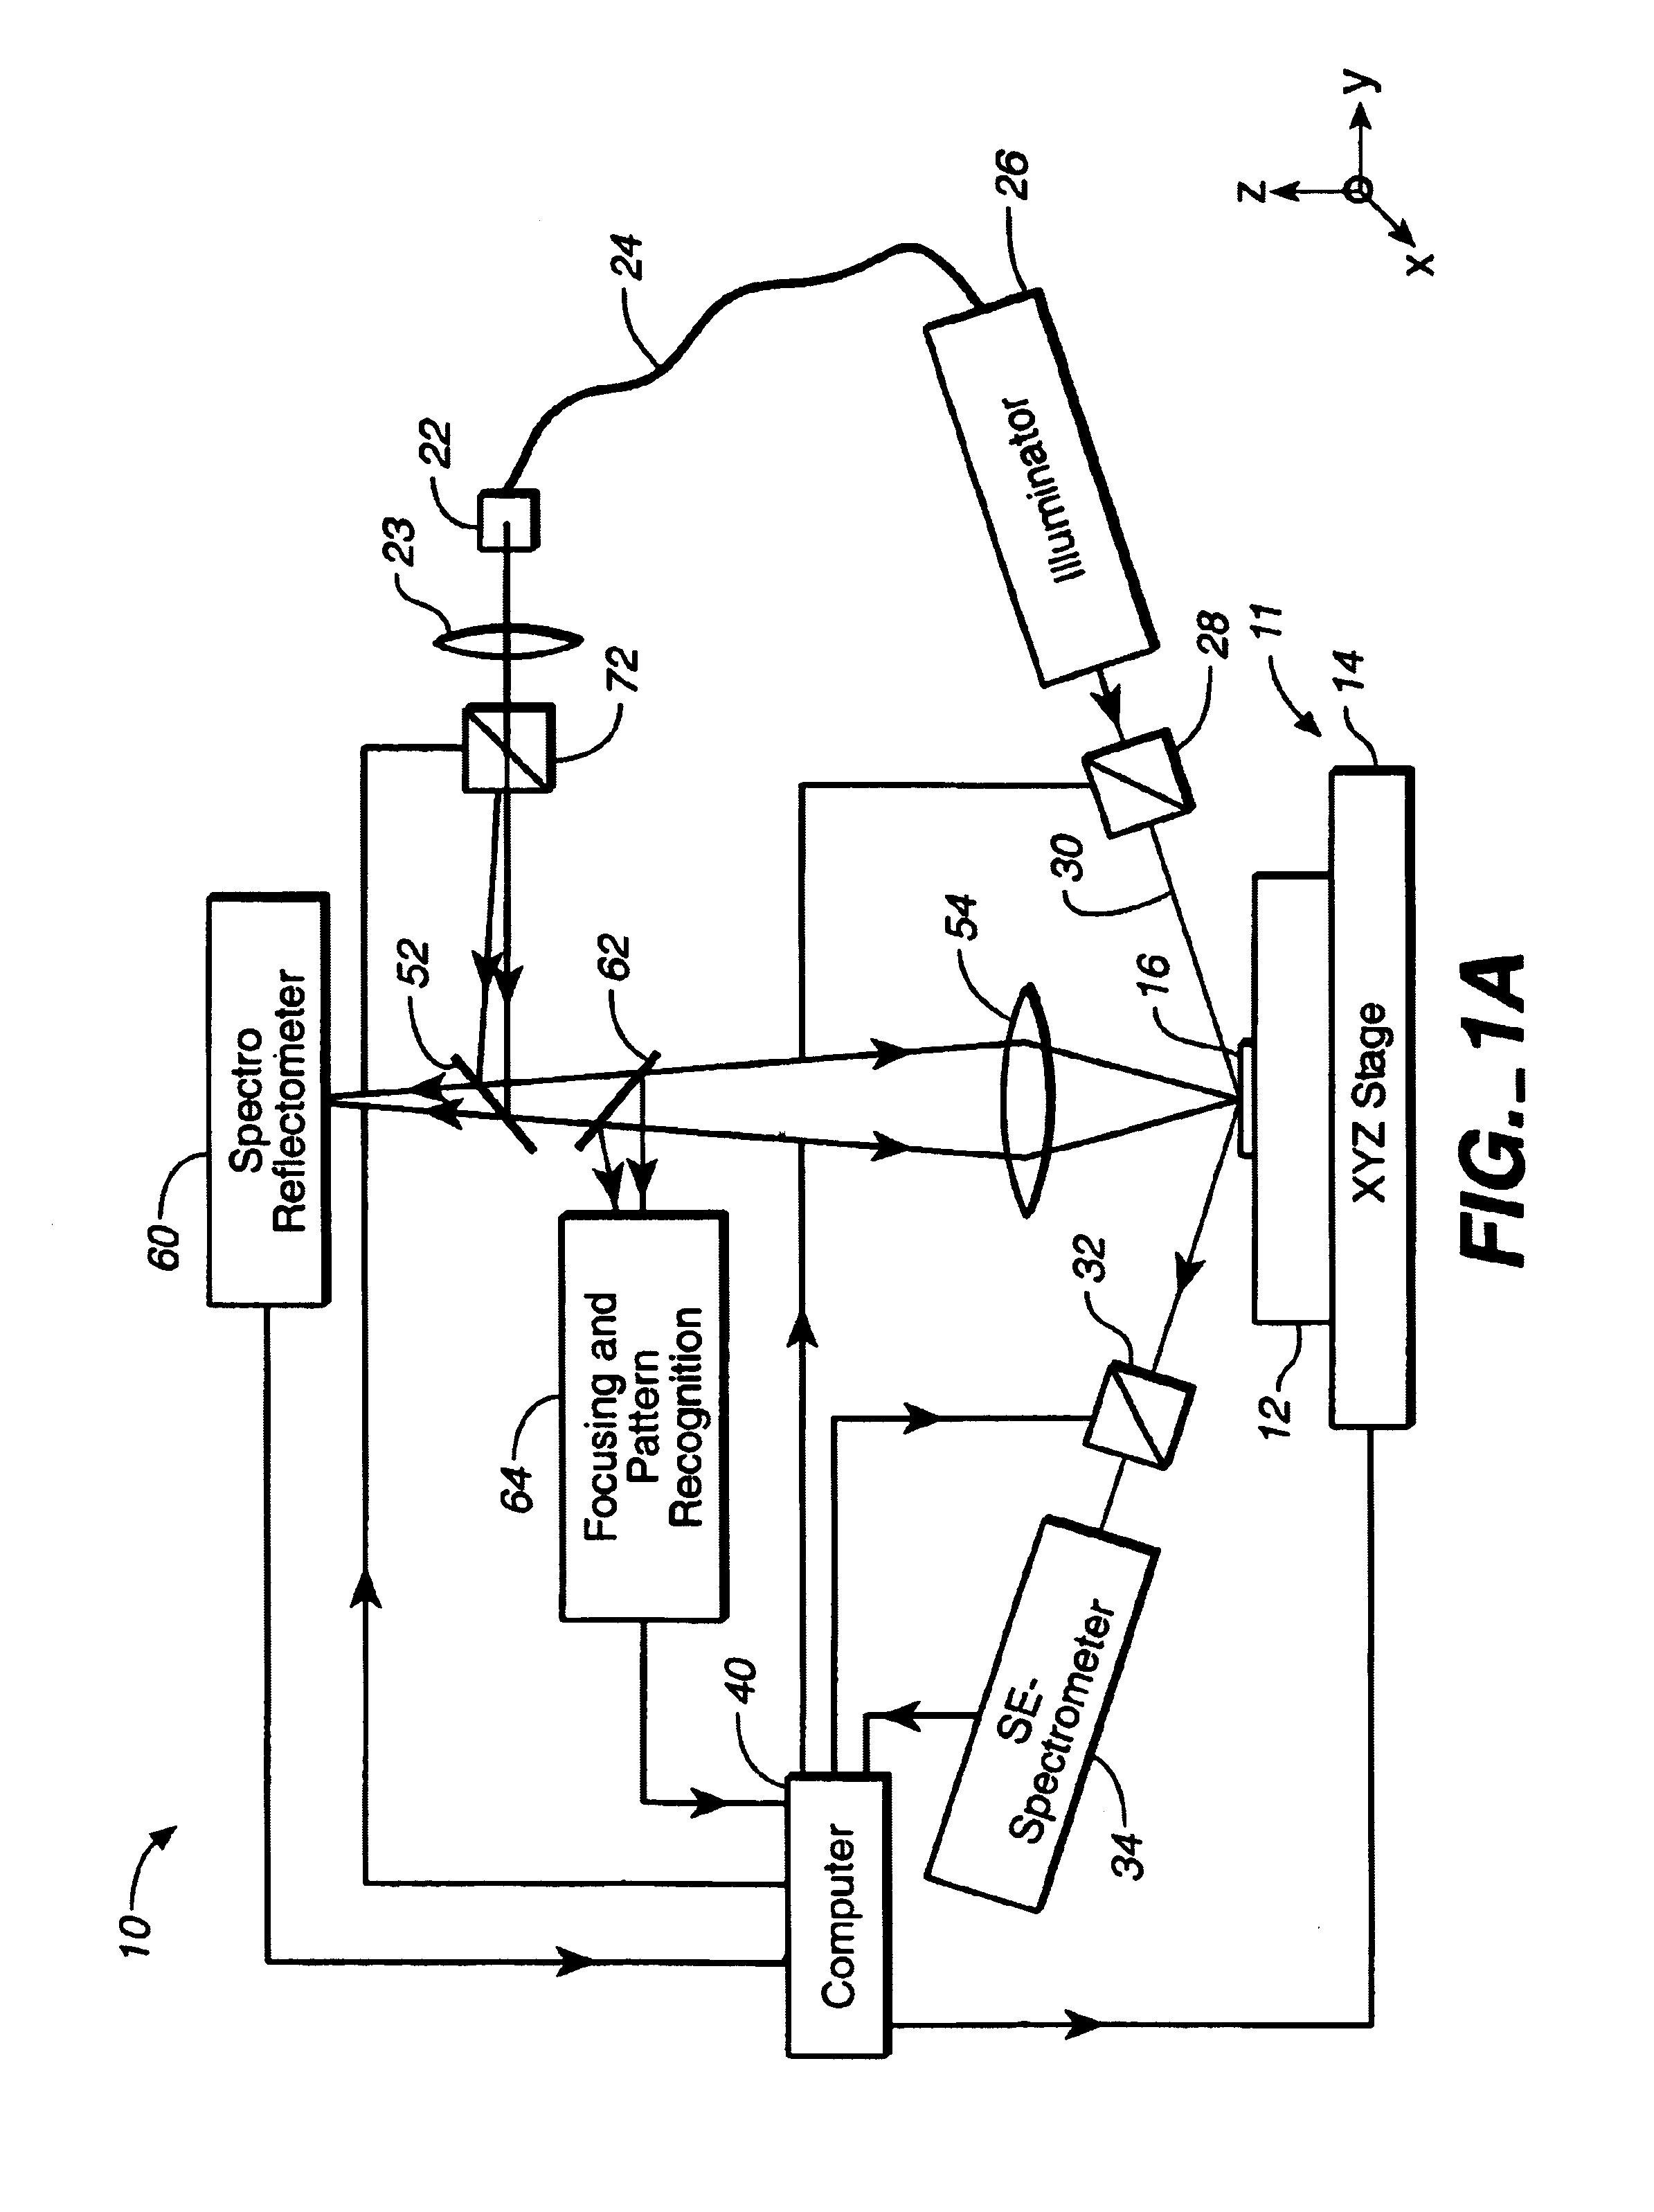
[0034]Even though much of the description below of algorithms and methods are described in terms of the reflected or transmitted intensities of the diffraction caused by the diffracting structure, it will be understood that the same techniques and algorithms may be used for data containing information concerning changes in the polarization state over different wavelengths (e.g. ellipsometric parameters and as functions of wavelength). For this reason, it may be advantageous to employ an instrument which is capable of measuring both the reflected or transmitted intensities of the diffraction caused by the structure as well as changes in polarization state caused by the diffraction of the structure. A suitable system is described below in reference to FIG. 1A.

[0035]FIG. 1A is a schematic view of a spectroscopic scatterometer system to illustrate the preferred embodiment of the invention. As shown in FIG. 1A, system 10 may be used to measure reflected or transmitted intensities or chan...


PUM

PropertyMeasurementUnit
wavelengthsaaaaaaaaaa

Abstract

Instead of constructing a full multi-dimensional look up table as a model to find the critical dimension or other parameters in scatterometry, regression or other optimized estimation methods are employed starting from a “best guess” value of the parameter. Eigenvalues of models that are precalculated may be stored and reused later for other structures having certain common characteristics to save time. The scatterometric data that is used to find the value of the one or more parameter can be limited to those at wavelengths that are less sensitive to the underlying film characteristics. A model for a three-dimensional grating may be constructed by slicing a representative structure into a stack of slabs and creating an array of rectangular blocks to approximate each slab. One dimensional boundary problems may be solved for each block which are then matched to find a two-dimensional solution for the slab. A three-dimensional solution can then be constructed from the two-dimensional solutions for the slabs to yield the diffraction efficiencies of the three-dimensional grating. This model can then be used for finding the one or more parameters of the diffracting structure in scatterometry. Line roughness of a surface can be measured by directing a polarized incident beam in an incident plane normal to the line grating and measuring the cross-polarization coefficient. The value of the one or more parameters may then be supplied to a stepper or etcher to adjust a lithographic or etching process.

Description

BACKGROUND OF THE INVENTION[0001]This invention relates in general to scatterometers and in particular, to spectroscopic scatterometric systems and methods employing models for measuring parameters of a diffracting structure as well as related applications to sample processing.[0002]As the integration and speed of microelectronic devices increase, circuit structures continue to shrink in dimension size and to improve in terms of profile edge sharpness. The state-of-the-art devices require a considerable number of process steps. It is becoming increasingly important to have an accurate measurement of submicron linewidth and quantitative description of the profile of the etched structures on a pattern wafer at each process step. Furthermore, there is a growing need for wafer process monitoring and close-loop control such as focus-exposure control in photolithography.[0003]Diffraction-based analysis techniques such as scatterometry are especially well suited for microelectronics metrol...

Claims


Application Information

Patent Timeline
Patent Type & Authority Patents(United States)
IPC IPC(8): G01J4/00G01B11/00G01B11/30G01N21/21G01N21/27G01N21/47G01N21/95G02B5/18G03F1/08H01L21/027H01L21/66
CPCG01N21/21G01N21/45G01N21/4788G02B5/18G01N21/9501G01N2021/213G01N2021/217G01N2021/8416
Inventor FABRIKANT, ANATOLYZHAO, GUOHENGWACK, DANIEL C.NIKOONAHAD, MEHRDAD
Owner KLA TENCOR TECH CORP
Why Eureka
Try Eureka