Device and procedure for visual three-dimensional presentation of ECG data

a three-dimensional, visual technology, applied in the field of medical electronics, can solve the problems of inability to provide adequate indications of electrical activity of certain regions of the heart, lack of cardiologists experienced in interpreting ecg recordings, and difficulty in analyzing ecg recordings prior to analysis,

Active Publication Date: 2007-09-04
ERESTECH +1
View PDF5 Cites 55 Cited by
  • Summary
  • Abstract
  • Description
  • Claims
  • Application Information

AI Technical Summary

Benefits of technology

[0076]Another important advantage of the invention is the fact that, unlike some methods introduced earlier (such as “spherocardiogram” and “four-dimensional ECG”) that suggest new diagnostic criteria, the inventive method uses diagnostic criteria that have been accepted within the diagnostics of standard ECG analysis; the invention makes the use of these standard diagnostics easier, aiding the interpretation of ECG results.
is the fact that, unlike some methods introduced earlier (such as “spherocardiogram” and “four-dimensional ECG”) that suggest new diagnostic criteria, the inventive method uses diagnostic criteria that have been accepted within the diagnostics of standard ECG analysis; the invention makes the use of these standard diagnostics easier, aiding the interpretation of ECG results.

Problems solved by technology

Although the ECG is a universally accepted diagnostic method in cardiology that dates from the beginning of the 20th century, the major problem of modern electrocardiography is the lack of cardiologists experienced in interpreting ECG recordings (Fisch, C., Centennial of the string galvanometer and the electrocardiogram, J. Am. Coll. Cardiol., 2000 Nov. 15; 36(6) 1737-45).
Another problem with traditional ECG recordings is that the ECG may not provide adequate indications of electrical activity of certain regions of the heart, especially the posterior region.
Furthermore, prior analysis of ECG recordings required a substantial amount of training and familiarity with reading of the recorded waveforms.
VCG introduces useful elements which cannot be found within the standard 12-lead ECG, however, the incomplete spatial presentation and loss of the time-dependence are major reasons why VCG, unlike ECG, has never been widely adopted, despite the fact that (in comparison to ECG) VCG can more often correctly diagnose cardiac problems, such as myocardial infarction.
The drawback of this method, however, is a prolonged measurement procedure in comparison to ECG, and a loose connection between the body potential map and heart anatomy.
These methods are very complicated, and are still being developed, and, so far, have not resulted in useful clinical devices.

Method used


Image

  • Device and procedure for visual three-dimensional presentation of ECG data
  • Device and procedure for visual three-dimensional presentation of ECG data
  • Device and procedure for visual three-dimensional presentation of ECG data

Examples


example 1

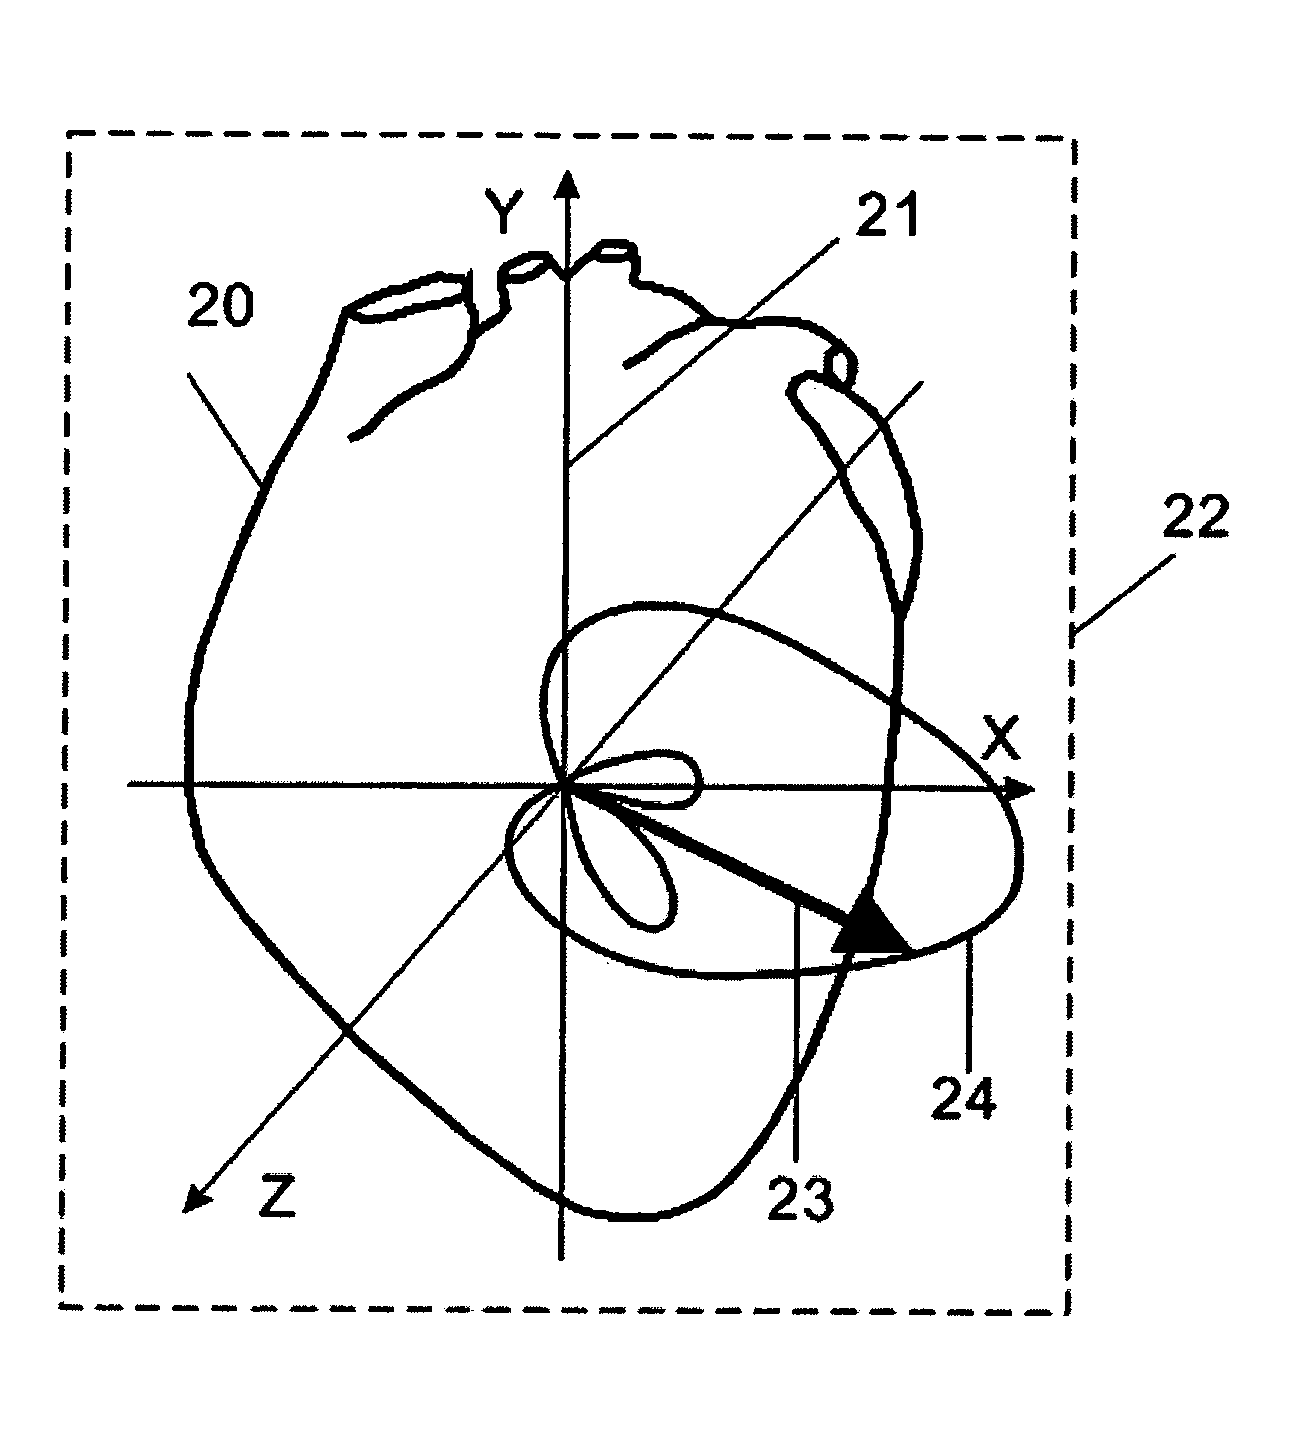
Calculation of a Heart Vector from Actual ECG Data

[0107]For example, a heart vector may be calculated from 8 standard ECG leads (recorded at leads I, II, V1, V2, V3, V4, V5, and V6). In this example, an Inverse Dower matrix is used to convert the data from the standard leads into the time variable heart vector that represents the size and orientation of a time varying electrical dipole approximating the electrical current (and voltage) of the heart.

[0108]The heart vector is described by {right arrow over (H)}:

{right arrow over (H)}=(X,Y,Z)=X{right arrow over (i)}+Y{right arrow over (j)}+Z{right arrow over (k)}  (1)

[0109]The ECG data from eight independent ECG leads can be described as a vector, {right arrow over (V)}:

{right arrow over (V)}=(I, II, V1, V2, V3, V4, V5, V6)  (2)

[0110]leads I, II, V1, V2, V3, V4, V5, and V6 described the recorded potentials from the ECG recorded at the actual lead sites on the surface of a patient's body.

[0111]Using an Inverse Dower matrix (ID), the ECG...

example 2

Calculation of a Normalization Factor

[0132]In this example, a normalization factor (ρ) is calculated using six standard precordial leads. vi(t) is the recorded voltage over time from a lead (e.g., the actual voltage from precordial leads 1 to 6, where i=1 to 6), and Vdi(t) is the derived voltage for each of the ECG leads (e.g., the same leads 1 to 6). As previously described, virtual lead voltages are calculated as a scalar product of the heart vector {right arrow over (H)} and a lead vector, {right arrow over (L)}i,

Vdi(t)={right arrow over (H)}(t)·{right arrow over (L)}i·ρi,  (9)

[0133]where {right arrow over (L)}i is defined having the direction of the position of the i-th electrode (e.g., precordial electrode 1 to 6), and ρi is an unknown normalization factor for each electrode. When normalizing the heart vector, the derived voltage is set approximately equal to the actual voltage recorded at the same lead:

Vdi(t)≈Vi(t)  (10)

[0134]The unknown factor ρi for every lead can therefore ...

example 3

Clinical Evaluation of Ischemia Detection

[0218]Preliminary clinical investigations have demonstrated that using the normalized ECG data as described herein may more reliably detect ST segment changes during myocardial ischemia, particularly in so-called “quiet zones” (e.g., regions of the heart where the standard ECG is relatively insensitive). A multi-center clinical study was initiated to investigate the diagnostic accuracy of the ECG analyzer described herein. Preliminary results compared the diagnosis of acute ischemia by evaluation of the ST segment using the standard 12-lead ECG and comparing it to the normalized ECG calculated as described herein.

[0219]This clinical trial was conducted in patients undergoing percutaneous transluminal coronary angioplasty (PTCA) in which the coronary artery was occluded with a PTCA balloon. Such patients serve as models for transient myocardial ischemia. Balloon occlusion assures complete obstruction of blood flow, and myocardium supplied by t...


PUM


Abstract

The invention relates to the analysis of ECG data by exploiting computerized three-dimensional spatial presentation of the measured data using the vector concept. A three-dimensional presentation of the human heart may be correlated with waveforms specific for standard ECG or derived ECG signals based on the dipole approximation of the heart electrical activity. The three-dimensional heart model may be rotated, and the ECG signals are interactively linked to the model. In the visualization process, different types of signal presentation may be used, including graphical presentation of the heart vector hodograph, graphical presentation of the signal waveform in an arbitrary chosen point on the heart, and graphical presentation of the map of equipotential lines on the heart in a chosen moment. Additional tools for analyzing ECG data are also provided which may be interactively used with the display tools.

Description

CROSS-REFERENCE TO RELATED APPLICATIONS[0001]This patent claims priority to Serbia and Montenegro patent P-43 / 04, filed Jan. 16, 2004, which is herein incorporated by reference in its entirety.BACKGROUND OF THE INVENTION[0002]1. Technical Field[0003]The present invention relates to the field of medical electronics. In particular, it concerns electronic devices for acquisition and presentation of diagnostic data. The invention comprises devices and procedures for acquisition and analysis of electrocardiographic (ECG) data and the three-dimensional visualization of ECG data that enables more precise diagnostic interpretation of the ECG data. According to the International Patent Classification (IPC), the invention is categorized within the A61B 5 / 00 class, which defines methods or devices for measurement or recording in diagnostic purposes. More precisely, the invention is categorized within the A61B 5 / 04 class, which defines instruments for measuring or recording bioelectric charges ...

Claims


Application Information

Patent Timeline
Patent Type & Authority Patents(United States)
IPC IPC(8): A61B5/0402A61B5/04A61B5/044G06F17/00
CPCA61B5/04011A61B5/044G06F19/3487G16H15/00A61B5/341A61B5/339A61B5/343
Inventor BOJOVIC, BOSKOHADZIEVSKI, LJUPCOBELICEV, PETAR
Owner ERESTECH
Why Eureka
Try Eureka