A ccd-type colloidal gold immunochromatographic diagnostic test paper quantitative analysis system
A technology of immunochromatography and quantitative analysis, which is applied in the direction of material analysis, material analysis through optical means, and measuring devices, etc. It can solve problems such as inability to quantitatively analyze, facilitate function upgrades and expansions, solve subjective deviations, and ensure stability Effect
- Summary
- Abstract
- Description
- Claims
- Application Information
AI Technical Summary
Problems solved by technology
Method used
Image

Examples
Embodiment 1
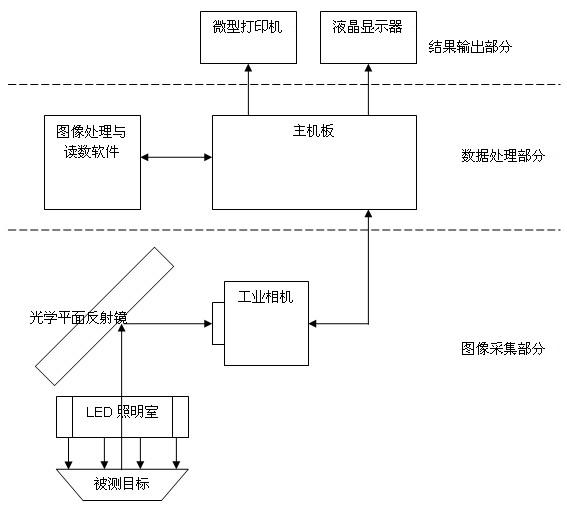
[0035] Embodiment 1: with reference to attached Figure 1-11 . A CCD-type colloidal gold immunochromatography diagnostic test paper quantitative analysis system is composed of an image collector, a data processor, and a result output device; the main board signal exchange terminal in the data processor is respectively connected with the image processing and reading software and the image collector Two-way data exchange with industrial cameras in the camera. The image collector consists of a target tray, an LED lighting chamber, an optical flat mirror, and an industrial camera. The receiving surface and the reflecting surface of the optical flat mirror are distributed at 45 degrees, and the LED lighting chamber located under the optical flat mirror illuminates the measured target. The light on the surface is vertically reflected to the 45-degree distributed optical plane reflector and the measured target image is reflected to the industrial camera lens through the 45-degree di...
Embodiment 2
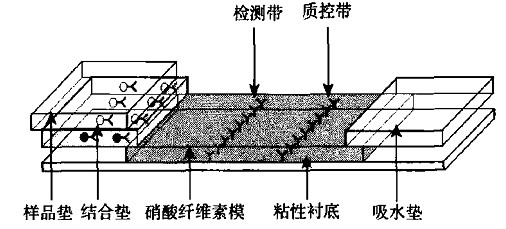
[0066] Embodiment 2: On the basis of embodiment 1, a kind of CCD type colloidal gold immunochromatography diagnostic test paper quantitative analysis method, light is sent by LED lighting chamber, is irradiated on the test paper strip after reaction, diffuses through the test paper surface After reflection, the light is reflected by the optical flat mirror to the industrial camera, and the digital image is captured by the industrial camera, and then sent to the computer software for analysis and processing, and finally the reading values of the test line and the quality control line on the colloidal gold immunochromatography diagnostic test strip are obtained. On the test line and quality control line of the test strip, due to the light absorption characteristics of gold nanoparticles, the scattered light signal at the test line - T line and quality control line - C line will be smaller than that of other areas of the test strip. Signal, after analyzing the brightness of the ...
PUM
 Abstract
Description
Claims
Application Information
PatSnap Eureka turns technology decisions into work you can execute. Powered by our Innovation Knowledge Graph, it runs expert workflows across engineering, life sciences, materials and intellectual property. Get your review-ready output in minutes.


