Fast instrumental analysis method for aflatoxins in foods
A technology of aflatoxin and aflatoxin, applied in instruments, scientific instruments, analytical materials, etc., can solve the problems of inaccurate characterization and cumbersome processing, and achieve the effects of high recovery rate, simple processing method and accurate analysis method
- Summary
- Abstract
- Description
- Claims
- Application Information
AI Technical Summary
Problems solved by technology
Method used
Image
Examples
Embodiment 1
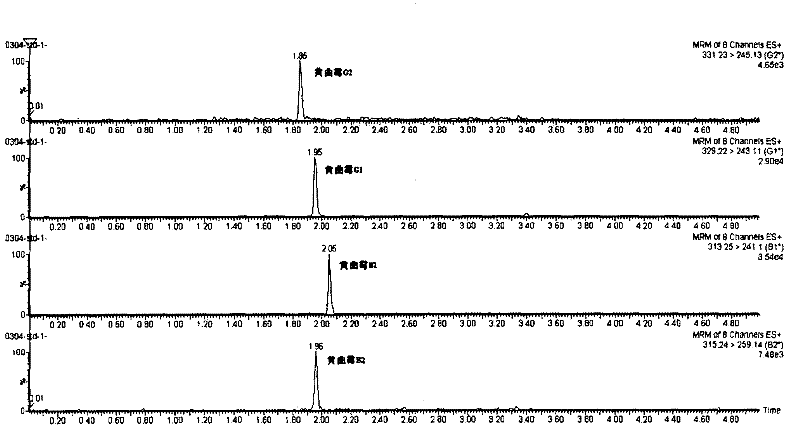
[0029] With 0.1% formic acid acetonitrile-water (10:90, V / V) as a solvent, prepare a series of standard solutions with concentrations of aflatoxin mixed solution of 0.1, 0.5, 1.0, 2.0, 5.0 μg / mL respectively, under the above chromatographic conditions The peak area was determined by injection, and quantified by external standard method. Standard solution extracted ion chromatogram as figure 1 , with the peak area y as the ordinate and the concentration x as the abscissa, a linear regression was performed, and the results are shown in Table 1.
[0030] The retention time of table 1 four kinds of aflatoxins, monitoring ion, linear equation and correlation coefficient
[0031]
[0032] Based on the sample mass of 5g and constant volume of 20mL, the detection limits of Aspergillus flavus B1 and G1 in the sample are both 0.2 μg / kg, and the detection limits of Aspergillus flavus B2 and G2 are both 0.04 μg / kg.
Embodiment 2
[0034] Accurately weigh 5g of the crushed flour sample (accurate to 0.01g), extract and measure according to the above-mentioned experimental method, select the flour sample, and carry out three parallel determinations. The experiment numbers are A-1, A-2, and A-3, respectively. The analysis results are shown in Table 2. The first parallel sample (Experiment No. A-1) was measured 5 times in parallel, and the analysis results are shown in Table 3. It can be seen from Table 2 that the relative standard deviations of the four targets of Aspergillus flavus B1, B2, G1 and G2 in the parallel samples are 1.1-4.1%. It can be seen from Table 3 that the relative standard deviation of the repeatability test is between 3.9% and 6.4%.
[0035] Table 2 Test results of four kinds of target objects to be tested in flour samples
[0036]
[0037] Table 3 Flour sample test repeatability
[0038]
Embodiment 3
[0040] The standard solution in Example 1 was added to the flour sample in Example 2, and the experiment was carried out according to the above-mentioned sample pretreatment method and instrumental analysis and detection method. The sample was spiked at two concentrations, and the average value was measured three times for each spiked sample, and the spiked recovery rate of the sample was calculated according to the actual amount added and the measured results. The results are shown in Table 4. It can be seen from Table 4 that the recovery rate of the sample addition is in the range of 83.3-91.6%.
[0041] The recovery rate of standard addition of table 3 flour samples
[0042]
PUM
 Abstract
Description
Claims
Application Information
 - R&D
- Intellectual Property
- Life Sciences
- Materials
- Tech Scout
- Unparalleled Data Quality
- Higher Quality Content
- 60% Fewer Hallucinations
Browse by: Latest US Patents, China's latest patents, Technical Efficacy Thesaurus, Application Domain, Technology Topic, Popular Technical Reports.
© 2025 PatSnap. All rights reserved.Legal|Privacy policy|Modern Slavery Act Transparency Statement|Sitemap|About US| Contact US: help@patsnap.com


