Preparation and value setting method for calibration sample used for X-ray fluorescence analysis calibration
A technique for fluorescence analysis and calibration of samples, which is used in material analysis, analysis of materials, and measurement devices using wave/particle radiation.
Active Publication Date: 2014-02-12
CHINA TEST & CERTIFICATION INT GRP CO LTD
4 Cites 3 Cited by
AI-Extracted Technical Summary
Problems solved by technology
At present, the calibration samples used in X-ray fluorescence analysis generally select appropriate samples, and use chemical analysis methods or other analysis methods to measure the actual values. Since the calibration samples are actual samples, the content of each component, the number of samples and each component cannot be adjusted...
Abstract
The invention relates to a preparation and value setting method for a calibration sample used for X-ray fluorescence analysis calibration. An actual sample received by a laboratory is adopted as the matrix, and a reference reagent (or substitute reagent) is mixed to prepare the calibration sample. The number of the calibration sample and the mass fraction range of each component can be arbitrarily controlled. The value setting of the calibration sample is totally completed by an X-ray fluorescence analyzer, no chemical analysis is needed, and the laboratory equipped with the X-ray fluorescence analyzer can prepare the calibration sample on its own without a chemical analysis laboratory and assistance of related technical staff.
Application Domain
Material analysis using wave/particle radiation
Technology Topic
PhysicsSoft x ray +5
Image
Examples
- Experimental program(1)
Example Embodiment
[0030] The invention provides a method for preparing a calibration sample by using an actual sample received by a laboratory as a matrix by adding a reference reagent.
[0031] The method is implemented like this:
[0032] Select a sample S for daily analysis, and prepare S into a uniform powder sample;
[0033] According to the chemical composition of the sample S, prepare corresponding pure reference chemical substances (reference reagents) or related chemical reagents to replace the pure reagents (replacement reagents). For example, for cement samples, the chemical composition is silicon dioxide, aluminum oxide, 11 kinds of compositions such as ferric oxide, calcium oxide, magnesium oxide, sulfur trioxide, potassium oxide, sodium oxide, titanium dioxide, manganese oxide and phosphorus pentoxide, then should prepare 11 kinds of reference reagents or substitute reagents such as silicon dioxide, Since chemical components such as calcium oxide and potassium oxide do not have high-purity reagents as reference reagents, chemical reagents such as calcium carbonate, potassium carbonate or potassium sulfate can be used as substitute reagents. The principle of selecting a replacement reagent is that the chemical reagent is only composed of the chemical components to be replaced and other components present in the cement sample, such as potassium sulfate, potassium dihydrogen phosphate; or only composed of the chemical components to be replaced and high-temperature volatile components, such as calcium carbonate .
[0034] Mix the sample S with each standard reagent or substitute reagent (collectively referred to as "chemical reagents") in a certain proportion to obtain "extreme samples" of each chemical composition, such as cement samples can prepare "silicon dioxide extreme samples" , "Extreme Calcium Oxide Samples" and other 11 extreme samples. The ratio of chemical reagents and sample S for each extreme sample is determined according to the chemical composition range of this type of sample.
[0035] If the mass fraction of a certain chemical component i in the sample S is Ci, and the mass fraction of other chemical components j is Cj, then Xi (the proportion of the chemical reagent corresponding to the i component in the extreme sample of the component) parts of the chemical reagent (set the The conversion coefficient of chemical reagent to chemical component i is Ki, Ki=molar mass of chemical component i/molar mass of chemical reagent) in the "i extreme sample" obtained after mixing with (1-Xi) parts of sample S, the The mass fraction of chemical component i in its extreme sample is:
[0036] Ci 极端 =[(1-Xi)×Ci+Ki×Xi] Formula 1
[0037] The mass fraction of other chemical components j is:
[0038] C j 极端 =(1-Xi)×Cj Formula 2
[0039] After mixing Ym (meaning the share of i extreme sample in the mixed sample, the value is between 0 and 1, including the extreme value) part of "i extreme sample" and (1-Ym) part of sample S, the mixed sample Sxy can be obtained , then the mass fraction Cim of component i in the sample is:
[0040] Cim=(1-Ym)×Ci+Ym×[(1-Xi)×Ci+Ki×Xi] Formula 3
[0041] Prepare a series of n mixed samples Sxym (the Ym value is changed in n kinds, and a standard curve needs to be made with a calibration sample during use, so n is usually greater than 4). Calibration samples. The valuation process is as follows:
[0042] The n mixed samples and the sample S are respectively melted and made into slices, and then the n+1 samples are measured with an X-ray fluorescence instrument for the fluorescent X-ray intensity of the chemical component i, and the concentration is the fluorescent X-ray of the Cim mixed sample Sxym The intensity is Iim (m=1,2....,n), and the fluorescent X-ray intensity of S sample is Ii. For Ci in the range of 0~1 (excluding the end value), the value of Cim corresponding to different Ym values (Ym values can be evenly distributed or randomly distributed) can be obtained by using formula (3). Take Cim as the ordinate, and the corresponding Iim as the abscissa to draw a straight line through the origin, then the slope K of the straight line is calculated according to formula 4:
[0043] K = Σ i = 1 n C i I i - 1 n ( Σ i = 1 n C i ) ( Σ i = 1 n I i ) Σ i = 1 n I i 2 - 1 n ( Σ i = 1 n I i ) 2 Formula four
[0044] From K and the i fluorescent X-ray intensity Ii of the sample S, Ci can be obtained according to Formula 5:
[0045] Ci=K×Ii Formula 5
[0046] Substitute the Ci obtained from Equation 5 into Equation 3, recalculate Cim, K and Ci, and perform iterative calculations until the value of Ci calculated twice in a row is stable, and the final Ci calculation result is the mass fraction of chemical component i in sample S.
[0047] The mass fraction of other chemical components in sample S can be determined by the same process.
[0048] Then calculate and determine the mass fraction of each chemical component in each extreme sample Sxy by formula 1 and formula 2, and determine the mass fraction of each chemical component in each corresponding calibration sample Sxym prepared by mixing sample S and each extreme sample Sxy by formula 6.
[0049] Cim=(1-Ym)×Ci+Ym×Ci 极端 Formula six
[0050] Each calibration sample is prepared by the formula above, and the mass fraction of each chemical component in each calibration sample is determined.
[0051] The above-mentioned process is described in detail below with an embodiment:
[0052] 1) Preparation of extreme samples of cement: Take about 3 kg of Portland cement, sieve it with a 0.08mm square hole sieve, mix the sieved part, pass the uniformity test, and quantitatively mix it with the reagents and ratios listed in Table 1 11 extreme samples were evenly obtained, and the value of the chemical reagent ratio Xi was determined according to the possible maximum value of the chemical composition (oxide) in the actual cement sample.
[0053] Table 1: The ratio of Portland cement to various chemical reagents in each extreme sample
[0054]
[0055] *When preparing extreme samples of calcium oxide, since calcium oxide can easily absorb moisture and carbon dioxide in the air, it is not possible to first decompose calcium carbonate into calcium oxide and then weigh it. Calcium carbonate can be weighed directly. The amount of calcium carbonate can be weighed according to 100.09/56.08=1.78477 times the designed amount of calcium oxide was weighed, and the prepared extreme samples were burned at 950°C before use.
[0056] 2) Determine the mass fraction of each component in cement
[0057] Taking silicon dioxide as an example (i=SiO 2 ), in order to obtain the mass fraction of silica in Portland cement, weigh W×Ym grams of “silicon dioxide extreme sample” and W×(1-Ym) grams of Portland cement samples and mix them into W grams (W The value is determined according to the diameter of the melting piece and the dilution ratio. Generally, the diameter of the melting piece is 32 mm. When the dilution ratio is 5, W is 1.2000 grams). After mixing the sample, add flux W×R grams (R is the dilution ratio of the melting piece), Melt glass flakes, and measure the fluorescent X-ray intensity (Ii) of silicon in each melt flake with an X-ray fluorescence instrument. For "extreme silicon dioxide sample", look up Table 1 to know: Xi=0.101145, Ym value (generally, the value is evenly distributed between 0.05 and 1, when Ym=0, it means that the sample is an S sample melt) and the corresponding The silicon dioxide fluorescence X-ray intensity value (Iim, measured value) of the mixed sample melt is shown in Table 2. In this example, Ym has 30 values, corresponding to 30 mixed sample melts.
[0058] Assuming that the initial mass fraction (Ci) of silica in the Portland cement sample is 0.3000, the mass fraction Cim of silica in different Ym mixture samples can be calculated from Equation 3 (see column 4 of Table 2).
[0059] Table 2: Assumed value of silica mass fraction in actually prepared glass sample and actual measured value of X-ray intensity
[0060]
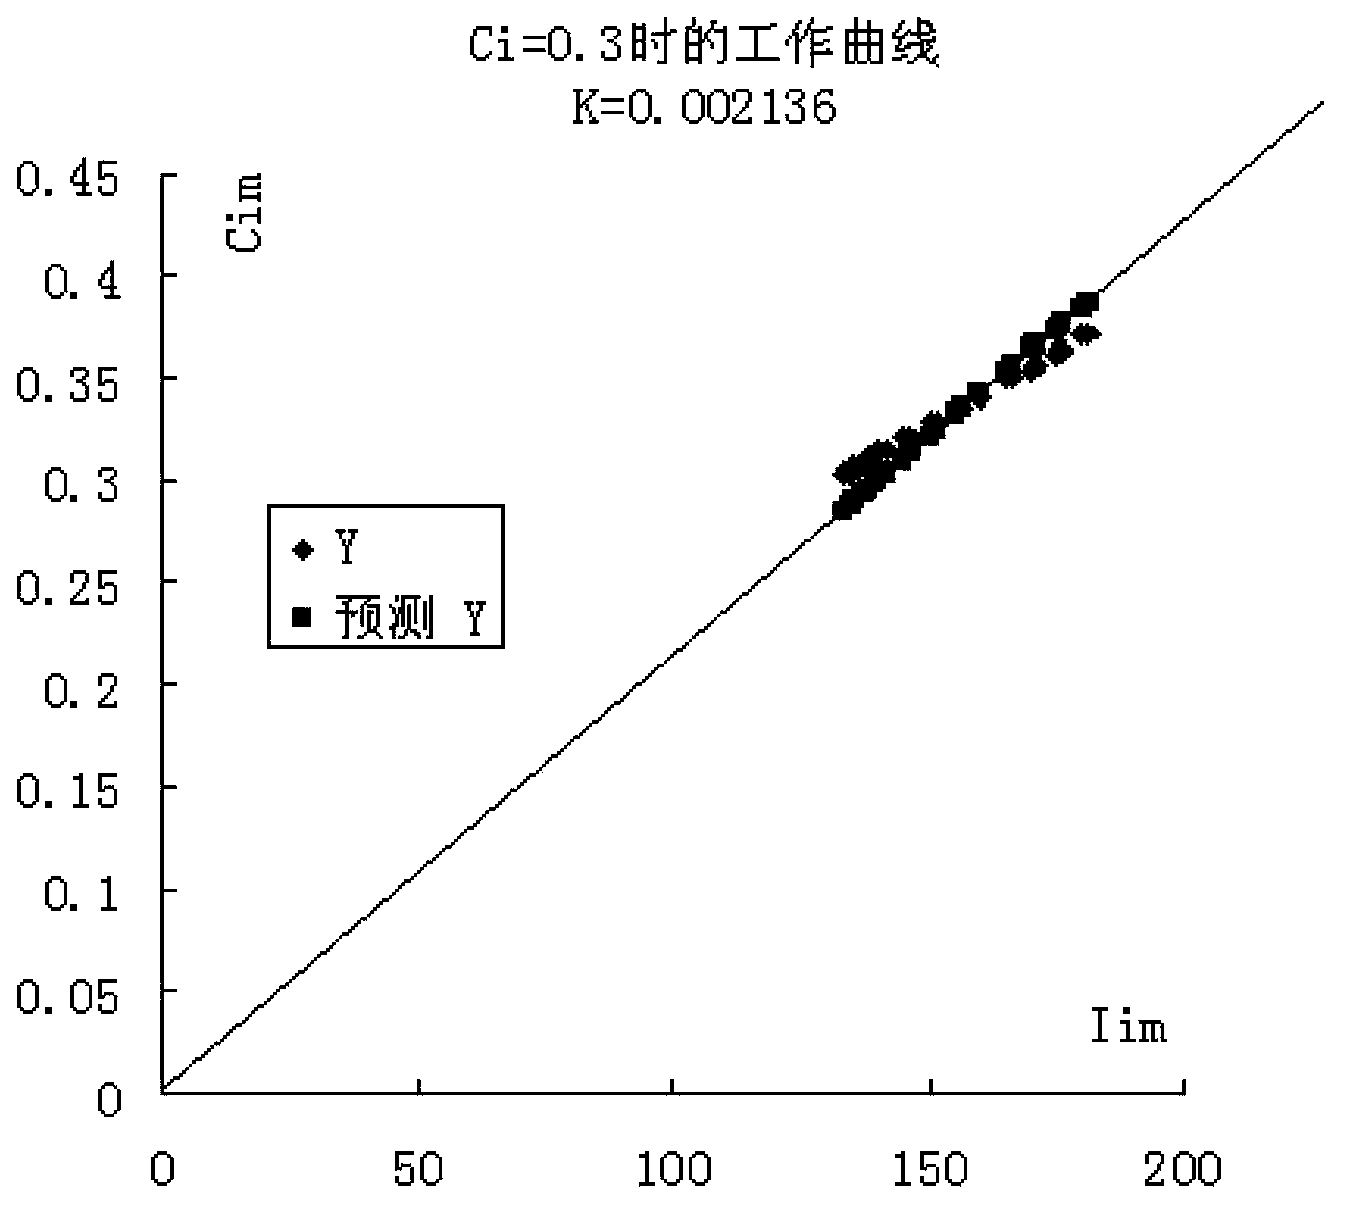
[0061] Take the Cim value in the fourth column in Table 2 as the ordinate point, and the corresponding Iim value as the abscissa point. For 29 value points (excluding the 30th point of Ym=0), draw a straight line through the origin to get figure 1 , figure 1 The slope K of the middle line is calculated according to formula 4, and K=0.002136 is obtained.
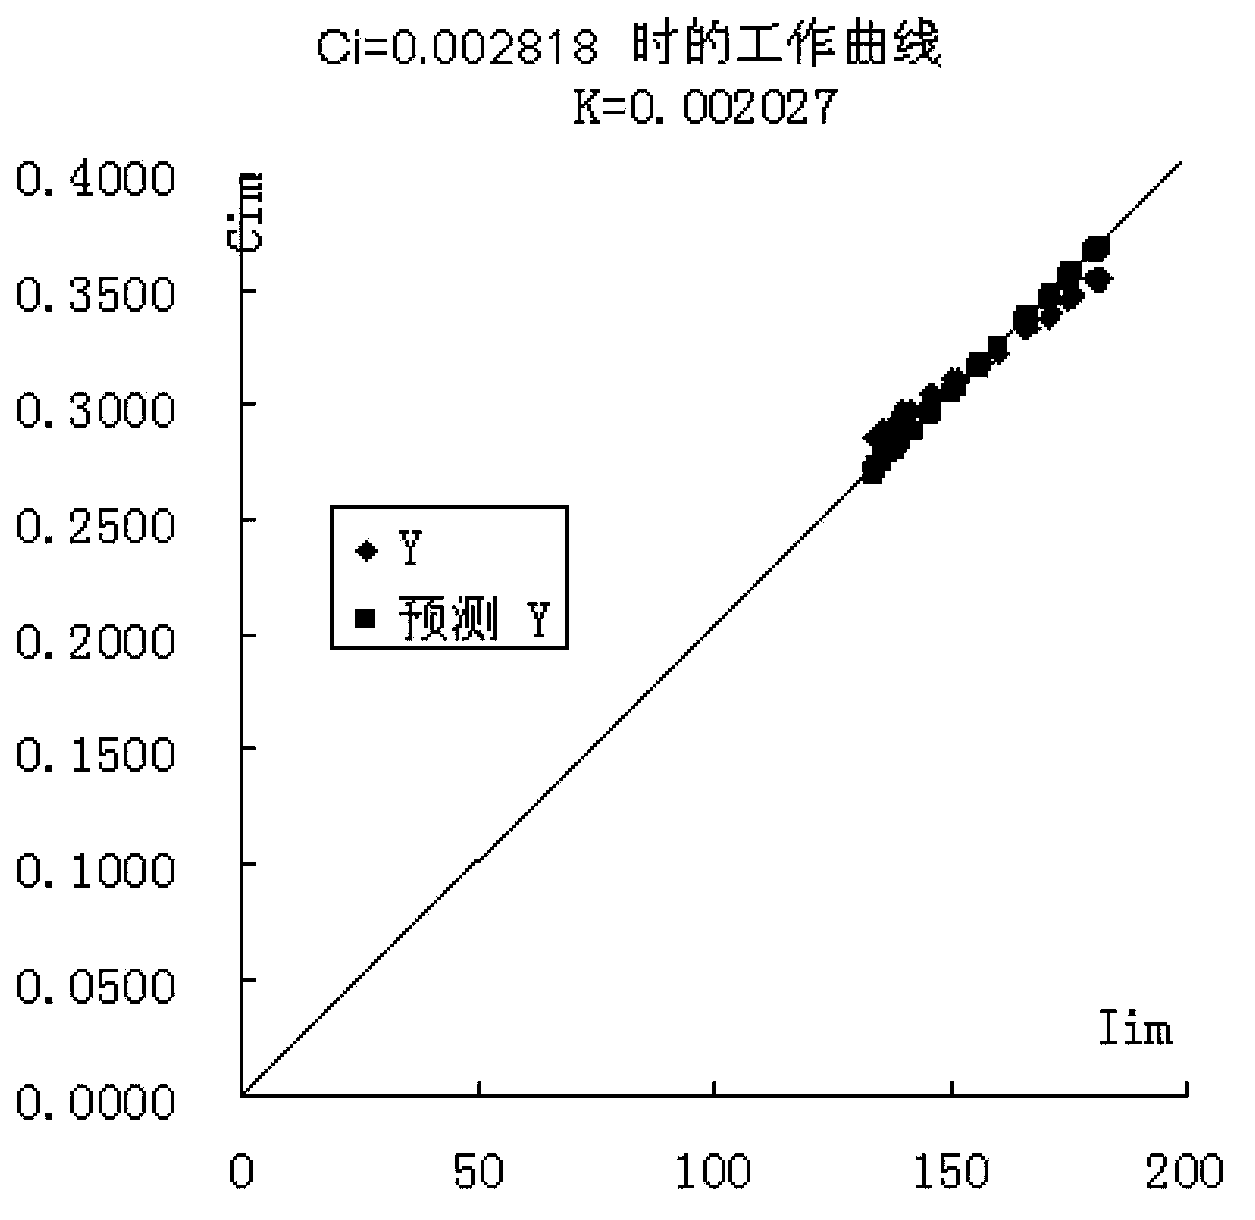
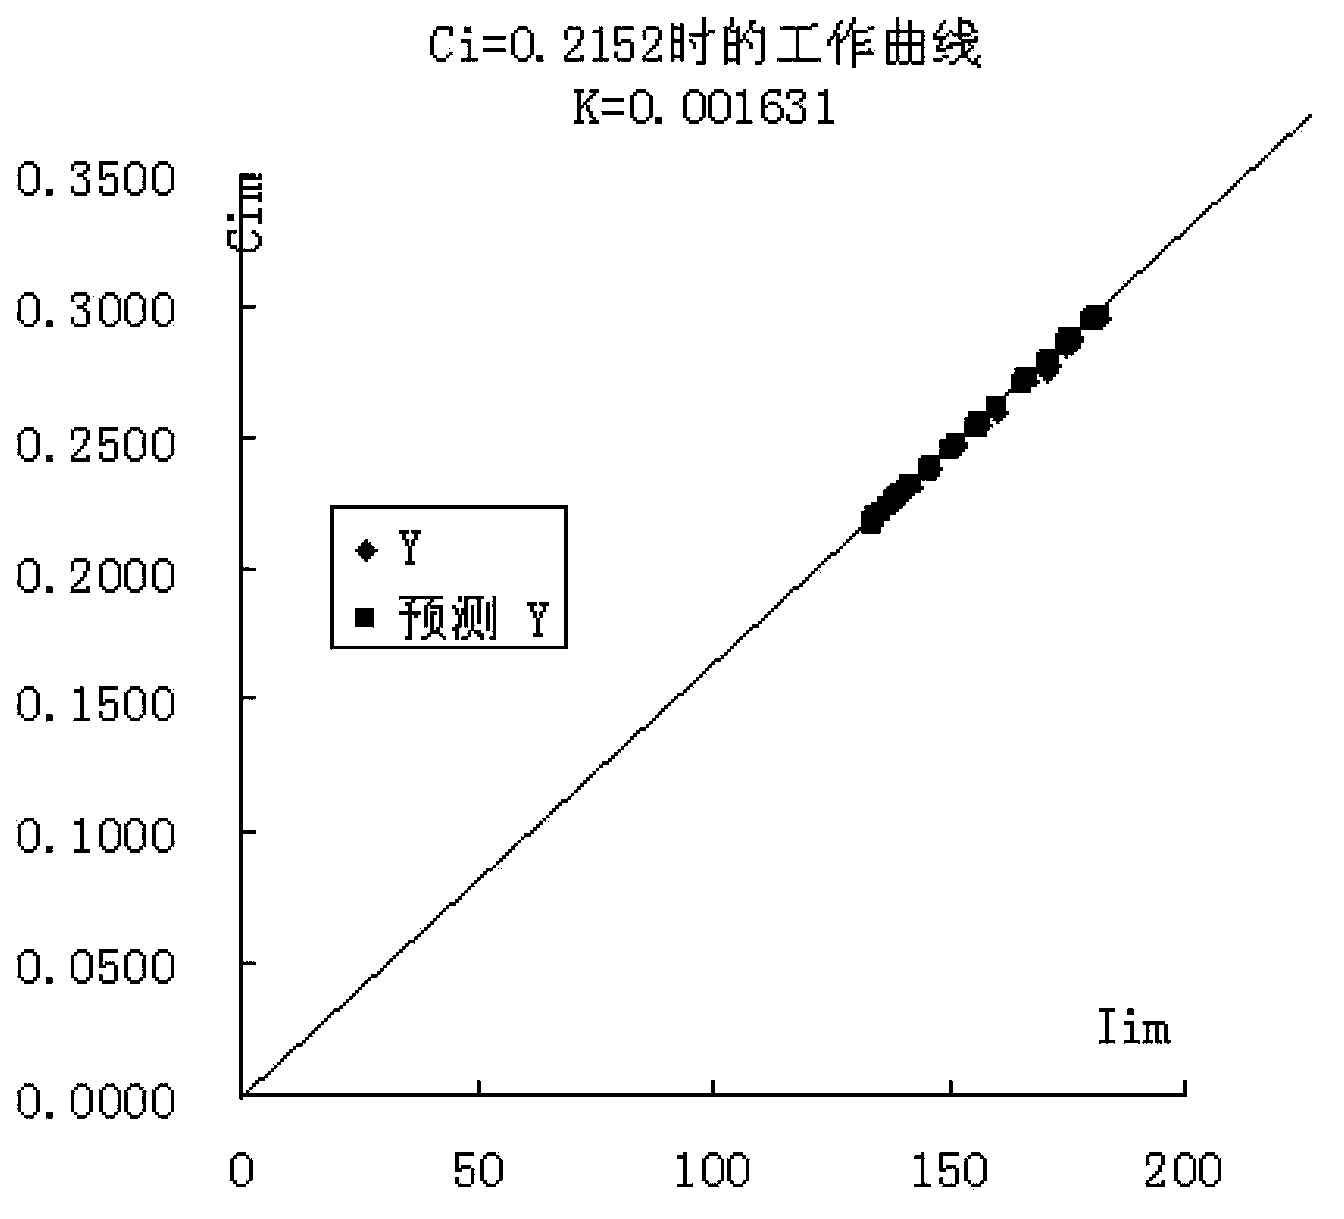
[0062] Substituting K=0.002136 into Portland cement sample (S) melt sheet strength measurement value 131.96 (see row 30 in Table 2) into Equation 5 to obtain Ci=0.002136×131.96=0.2818; Substituting Ci=0.2818 into Equation 3 , and calculate the mass fraction Cim of silica in different Ym mixture samples again by Equation 3 (see column 5 of Table 2). Take the Cim calculated for the second time (column 5 of Table 2) and the corresponding Iim as numerical points to plot again, and the result is as follows figure 2 , and K and Ci are calculated again from Formula 4 and Formula 5, and iterative calculations are repeated for many times until the calculated value of Ci is stable, and the final Ci calculation result is the mass fraction of silica in Portland cement. Columns 7 and 8 of Table 2 are the results of Ci and Cim obtained after the 49th and 50th iterations. The results of the previous and second times are exactly the same. Ci is 0.2152, and the corresponding K=0.001631. The working curve is shown in image 3.
[0063] Similarly, the same calculation above can also be performed with Ci=0.1000 as the starting value. After 50 iterations, the final result of Ci is also 0.2152. In fact, Ci takes any initial value between 0 and 1, and the final stable value of Ci in the iterative results is 0.2152, indicating that the mass fraction of silica in Portland cement is 0.2152.
[0064] Using the same method to determine the value of other components in Portland cement, the mass fraction of each component can be obtained respectively. In the determination of each component, a design quantity of mixed samples corresponding to the change of the mass fraction of the component is formed.
[0065] See Table 3 for the denomination results of each chemical component in this Portland cement by the above-mentioned method of the present invention. Table 3 also lists the chemical method determination results (mass percentage) of the Portland cement samples.
[0066] Table 3: The present invention compares cement value-valued results with chemical method results
[0067] chemical composition
[0068] The results in Table 3 show that the determination results of the present invention for each component in Portland cement are consistent with the chemical method determination results.
[0069] 3) Preparation of calibration samples
[0070] According to the above determination results of Portland cement samples, the mass fractions of 11 extreme samples can be calculated and determined according to formula 1 and formula 2. Table 4 shows the results of the extreme sample values obtained by calculation.
[0071] Table 4: Evaluation results of extreme samples (%)
[0072]
[0073]
[0074] Use sample S and different extreme samples according to the ratio of approximately even distribution between 0 and 1 (for example, take two extreme values of 0 and 1, take one or two in the 0.1 segment, 0.2 segment, 0.3 segment...0.9 segment or three values, or at least not less than 4 values) to prepare 4 to 29 calibration samples corresponding to each chemical composition, and a total of 192 calibration samples were obtained for the design of Portland cement referring to Table 5. (The number of calibration samples corresponding to each component can be manually adjusted as needed, but not less than 4). The definite value result of the calibration sample prepared by mixing the sample S with each extreme sample can be calculated and determined according to formula 6, and the definite value of SiO 2 For example, when calculating Ci, take the fixed value result in Table 3, Ci 极端 Take the data in Table 4, and Ym is the value listed in the second column of Table 5. See Table 5 for the results of the fixed values.
[0075] Table 5: Calibration sample determination results (%, mass percentage content)
[0076]
[0077]
[0078]
[0079]
[0080]
[0081] Table 5, 29 SiO 2 The calibration samples are the same as the mixed samples No. 1-29 in Table 2. In fact, the values can be determined directly for the mixed samples in step 2), and these mixed samples are the calibration samples.
[0082] Table 5 lists 192 calibration samples of Portland cement. In practical application, X-ray fluorescence spectrometer is used to analyze the components of Portland cement samples to be detected. Taking the CaO content as an example, any 4 or more of the 19 CaO calibration samples listed in Table 5 can be used for detection (In order to make the standard curve more accurate, the points should be scattered and evenly distributed as much as possible.) Make a standard curve with the measured fluorescence intensity and CaO content of each calibration sample, and then detect the sample to be tested, and use the measured fluorescence from the standard curve. The corresponding CaO content obtained is the CaO content in the sample to be tested.
PUM


Description & Claims & Application Information
We can also present the details of the Description, Claims and Application information to help users get a comprehensive understanding of the technical details of the patent, such as background art, summary of invention, brief description of drawings, description of embodiments, and other original content. On the other hand, users can also determine the specific scope of protection of the technology through the list of claims; as well as understand the changes in the life cycle of the technology with the presentation of the patent timeline. Login to view more.