Method for identifying Manuka honey based on SIMCA model
A technique of manuka honey, model
- Summary
- Abstract
- Description
- Claims
- Application Information
AI Technical Summary
Problems solved by technology
Method used
Image
Examples
Embodiment 1
[0039] Embodiment 1 Model establishment
[0040] 1. Instruments and equipment
[0041] Experimental equipment includes: Advance 400 nuclear magnetic resonance instrument (Bruker, Switzerland), 14.1 T superconducting magnet, 5 mm dual-core z-gradient probe and Topspin 2.3 test control and data processing software; 5 mm nuclear magnetic resonance sample tube; high-speed centrifuge (Sigma , German company); Vortex mixer (XW-80A, Shanghai Medical University Instrument Factory); LP403 analytical balance (Sartorius, German company);
[0042] Experimental solvents include: deuterated water (99.8% deuterium band) purchased from Cambridge Isotope Laboratories; 3-trimethylsilyl-1-propyl sodium sulfonate (TSPSA) purchased from Aldich-Sigma; dihydrogen phosphate Potassium and sodium dihydrogen phosphate (excellent grade) were purchased from Aldich-Sigma.
[0043] 2. Honey Sample Collection
[0044] A total of 7 varieties of Manuka honey, Kanuka honey, Rewariwa honey, Kamasi honey, Chri...
Embodiment 2
[0054] Example 2 Model Validity Verification
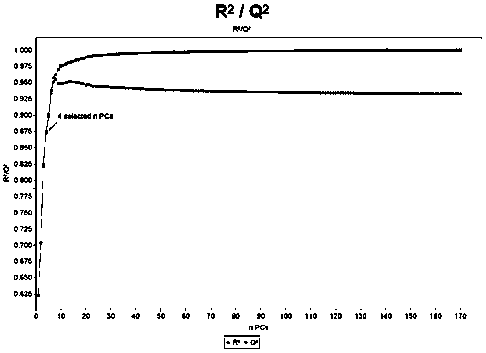
[0055] The validity of the model is verified by random permutation test. The parameters for evaluating the quality of the model are R2 and Q2, where R2 represents the model’s ability to explain the X and Y matrices, and Q2 represents the model’s predictive ability. The closer R2 and Q2 are to A value of 1 indicates that the model is more stable and reliable, and generally a value higher than 0.5 indicates a better model.
[0056] Such as figure 2 The R2 and Q2 of the model established in Example 1 shown are 0.99 and 0.95, respectively. It shows that the identification model established by the present invention is stable and reliable.
Embodiment 3
[0057] Example 3 Identification of Unknown Samples
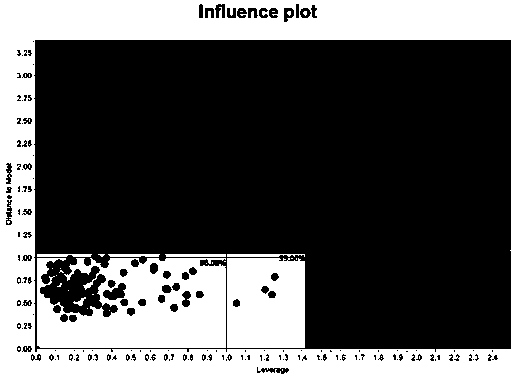
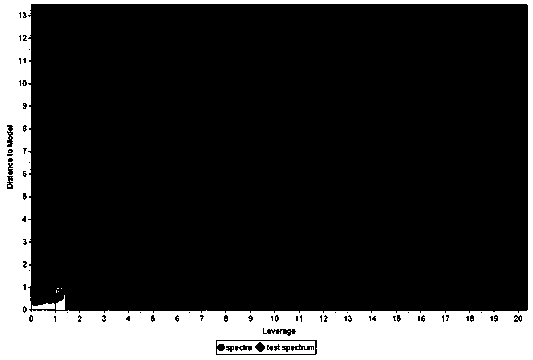
[0058] Three unknown samples were processed according to the sample preparation method in Example 1, and were processed according to the NMR spectrum analysis conditions in Example 1. 1 For the HNMR test, the hydrogen nuclear magnetic resonance spectrum data of 3 unknown samples were collected respectively. Use the established SMICA model to predict, and the SIMCA distribution diagrams are as follows: Figure 3-Figure 5 shown. According to the comprehensive evaluation of the position of the unknown sample from the model and the distance from the center of the model, the results are shown in Table 1.
[0059] Table 1:
[0060] Sample serial number
Model results
relative distance to model center
relative distance to model
1
outside the model
3.114
2.312
2
suspicious
0.375
1.014
3
in the model
0.278
0.769
[0061] According to the position of the samp...
PUM
 Abstract
Description
Claims
Application Information
 - R&D
- Intellectual Property
- Life Sciences
- Materials
- Tech Scout
- Unparalleled Data Quality
- Higher Quality Content
- 60% Fewer Hallucinations
Browse by: Latest US Patents, China's latest patents, Technical Efficacy Thesaurus, Application Domain, Technology Topic, Popular Technical Reports.
© 2025 PatSnap. All rights reserved.Legal|Privacy policy|Modern Slavery Act Transparency Statement|Sitemap|About US| Contact US: help@patsnap.com


