Test strip for combined detection of CRP and SAA, kit and preparation method
A technology of combined detection and test strips, which is applied in the field of kits and preparations, combined detection of CRP and SAA test strips, can solve problems such as narrow linearity, and achieve the effects of expanding the degree of discrimination, making it simple, and broadening the linearity
- Summary
- Abstract
- Description
- Claims
- Application Information
AI Technical Summary
Problems solved by technology
Method used
Image
Examples
Embodiment 1
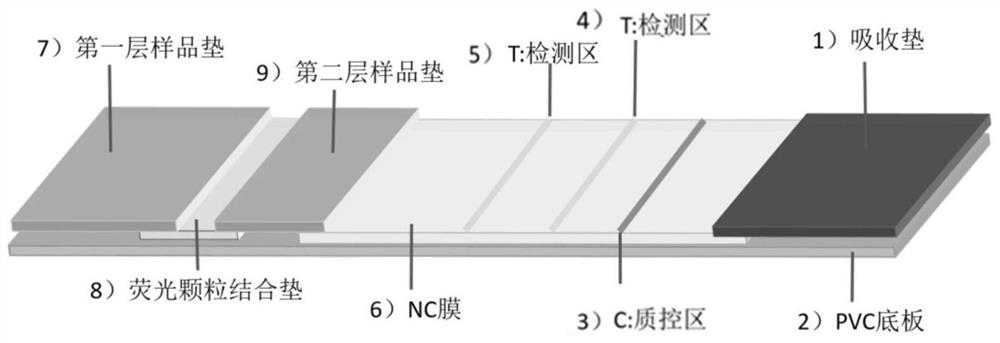
[0057] The present embodiment provides a kind of test strip of joint detection CRP and SAA, the test strip assembled by this method refers to figure 1 shown.
[0058] The detection test strip includes a PVC bottom plate 2, on which a nitrocellulose membrane 6 (NC membrane) is arranged, one end of the nitrocellulose membrane is connected with a second layer of sample pad 9, and the other end of the sample pad is connected with a fluorescent particle binding pad 8 , the other end of the fluorescent particle binding pad is connected with the first layer of sample pad 7 . The other end of the nitrocellulose membrane is connected with an absorbent pad 1 . A CRP detection line 5 coated with CRP monoclonal antibody 2, a SAA detection line 4 coated with SAA monoclonal antibody 2, and a goat anti-rabbit IgG polyclonal antibody coated in parallel are arranged on the nitrocellulose membrane 6 Quality control line 3.
[0059] The CRP antibody 1 conjugates of 150nm±25nm and 330nm±25nm, ...
experiment example 1
[0083] Preparation of Calibration Curve.
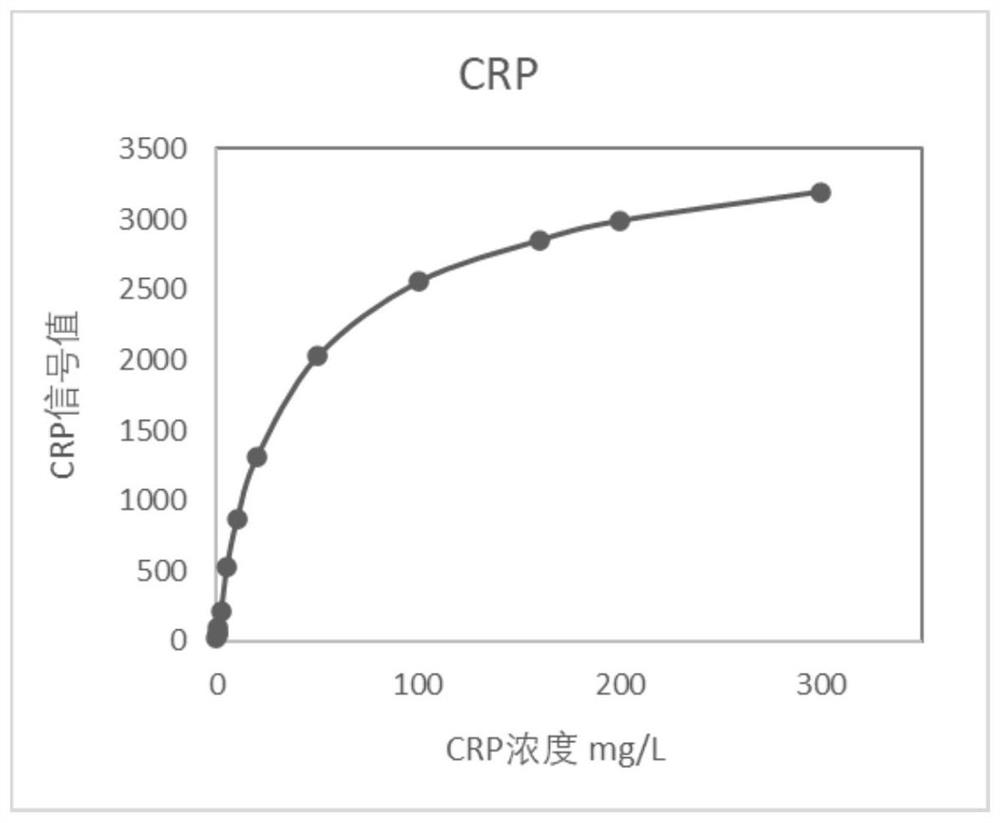
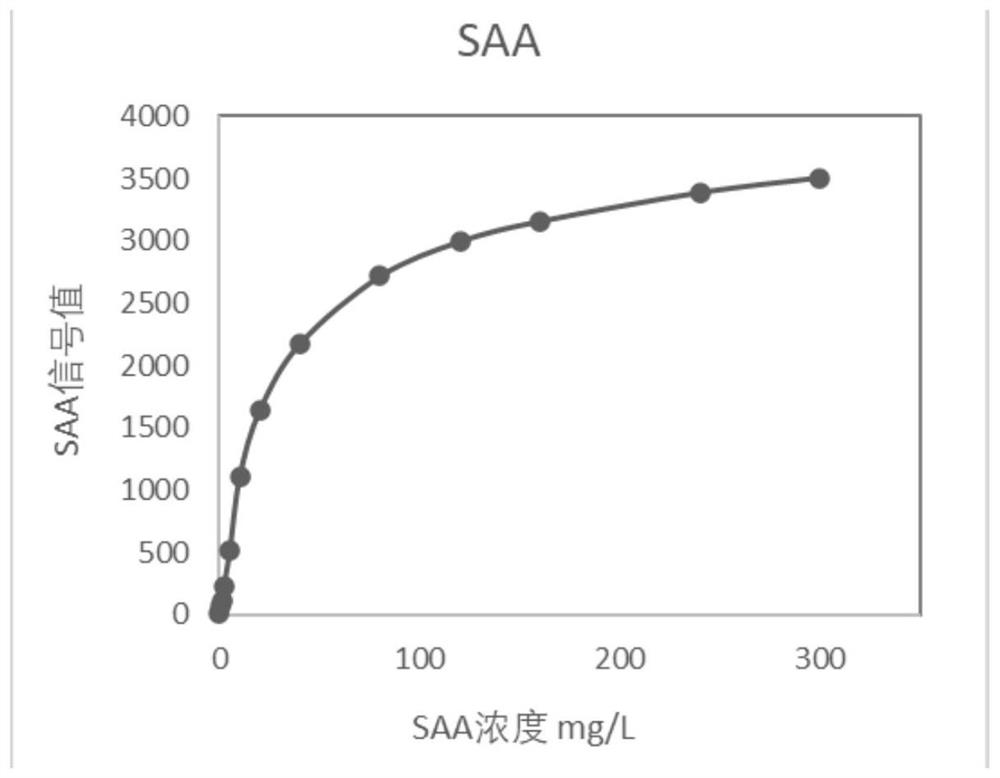
[0084] The test strip prepared by the above method was used for the determination of the calibrator, and each concentration was repeated 5 times. Use the I-Reader S automatic dry immunoassay analyzer of Shanghai Ai Ruide Biotechnology Co., Ltd. to test, and the result can be obtained in 3 minutes. The standard curve data is shown in Table 1 and Table 2, and the standard curve is shown in Table 1. figure 2 and image 3 shown.
[0085] From Table 1, Table 2 and figure 2 , image 3 As shown, the precision and sensitivity of each concentration point of the CRP and SAA standard curves are good, and there is a significant distinction between CRP at a concentration of 0.4 mg / L and a value of 0, and that of SAA at a concentration of 0.5 mg / L and a value of 0. Good linearity.
[0086] Table 1 CRP quantitative detection calibration curve data
[0087] CRP concentrationmg / L 300 200 160 100 50 20 10 repeat 1 3179 2...
experiment example 2
[0091] In this experiment example, the test experiment of the sample is carried out.
[0092] Carry out sample (donated by Changzhou Sinopharm Medical Testing Laboratory Co., Ltd.) test based on the calibration curve of Experimental Example 1, and test the target value with the Siemens system and its supporting CRP and SAA kits, and perform correlation analysis, such as Figure 4 and Figure 5 As shown, the CRP correlation coefficient R 2 is 0.9868, SAA correlation coefficient R 2 It is 0.9854, and the correlation between the two is good.
PUM
| Property | Measurement | Unit |
|---|---|---|
| particle diameter | aaaaa | aaaaa |
| particle diameter | aaaaa | aaaaa |
| particle diameter | aaaaa | aaaaa |
Abstract
Description
Claims
Application Information
 - R&D
- Intellectual Property
- Life Sciences
- Materials
- Tech Scout
- Unparalleled Data Quality
- Higher Quality Content
- 60% Fewer Hallucinations
Browse by: Latest US Patents, China's latest patents, Technical Efficacy Thesaurus, Application Domain, Technology Topic, Popular Technical Reports.
© 2025 PatSnap. All rights reserved.Legal|Privacy policy|Modern Slavery Act Transparency Statement|Sitemap|About US| Contact US: help@patsnap.com


