
Multiplexed excitation emission matrix spectroscopy

Active Publication Date: 2019-11-19
QUEENS UNIV OF KINGSTON
View PDF17 Cites 0 Cited by
  • Summary
  • Abstract
  • Description
  • Claims
  • Application Information

AI Technical Summary

Benefits of technology

This patent describes an apparatus for analyzing light from a sample using a special probe. The probe has two sets of optical fibers that receive and emit light, and a bevelled window that reduces back reflections. The apparatus also has a detector and a device that triggers the optics to collect data from the sample. The technical effects of this design are improved accuracy and efficiency in analyzing light from samples and the ability to automatically or minimally user input the apparatus.

Problems solved by technology

In liquid samples excitation and emission bands are broad, making it difficult to identify an analyte.
Determining the concentration of specific fluorophores within a mixture can prove complicated, especially when the broad fluorescence peaks overlap.
Through such analyses the excitation emission matrix spectra can be decomposed into its various components and hence number of fluorophores, a feat which would be otherwise difficult for complicated mixtures.
Since array detectors tend to be less sensitive than broad-band photodetectors the latter is less efficient as it could be.
This is a time-consuming process that uses only a fraction of the light to generate the EEM spectrum (e.g., about 1 / 10,000 for the former and 1 / 100 for the latter design, depending on the required spectral resolution and spectral range) of the light to generate the EEM spectrum.
However, Fourier transforms require analogue or high-bit digital modulation of light intensities and thus can be afflicted with harmonics that interfere with one another and confound the results.

Method used


Image

  • Multiplexed excitation emission matrix spectroscopy
  • Multiplexed excitation emission matrix spectroscopy
  • Multiplexed excitation emission matrix spectroscopy

Examples


example 1

DMA Hadamard EEM Spectrometer

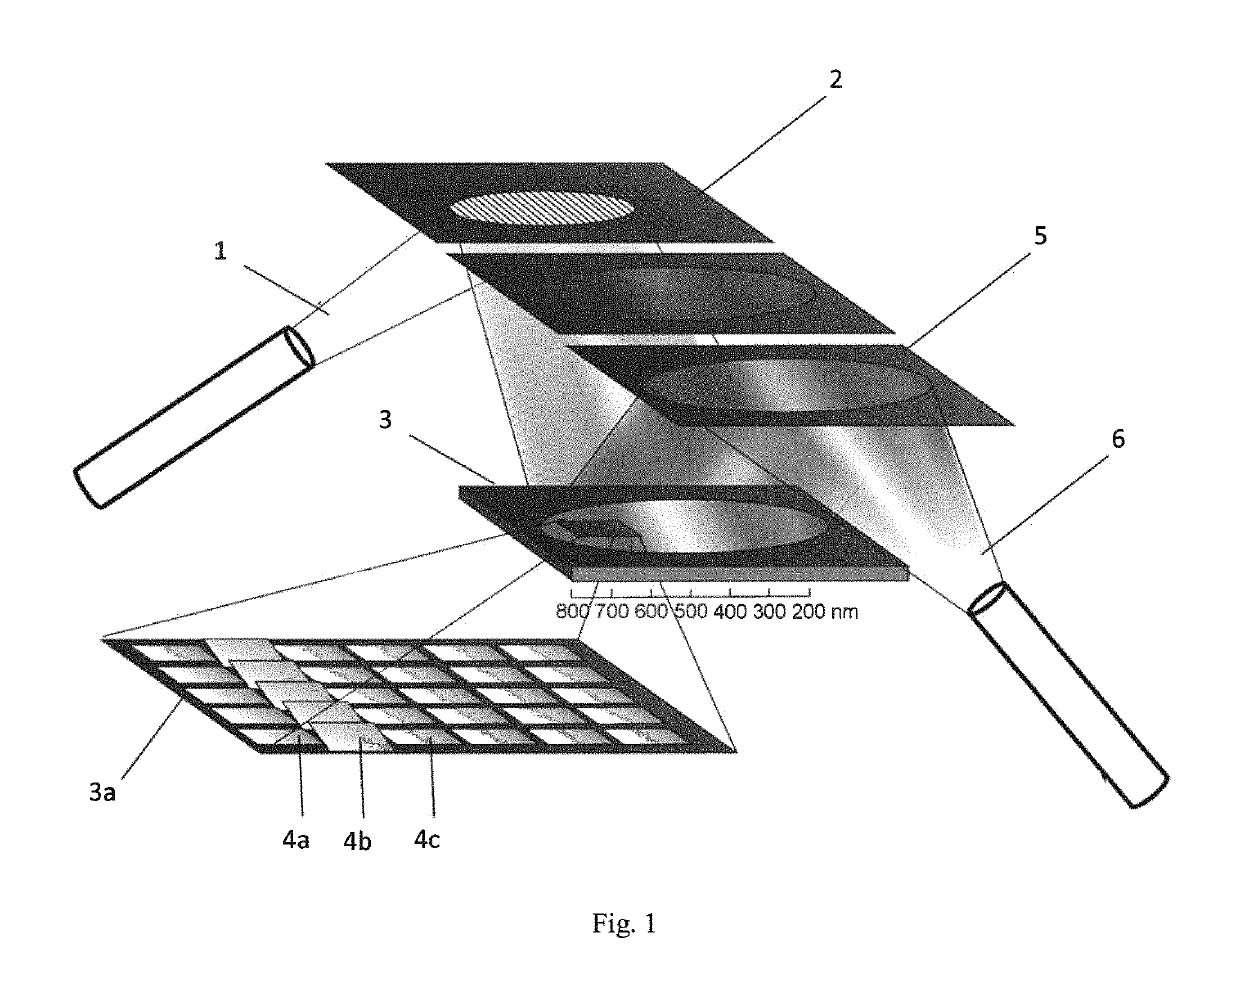
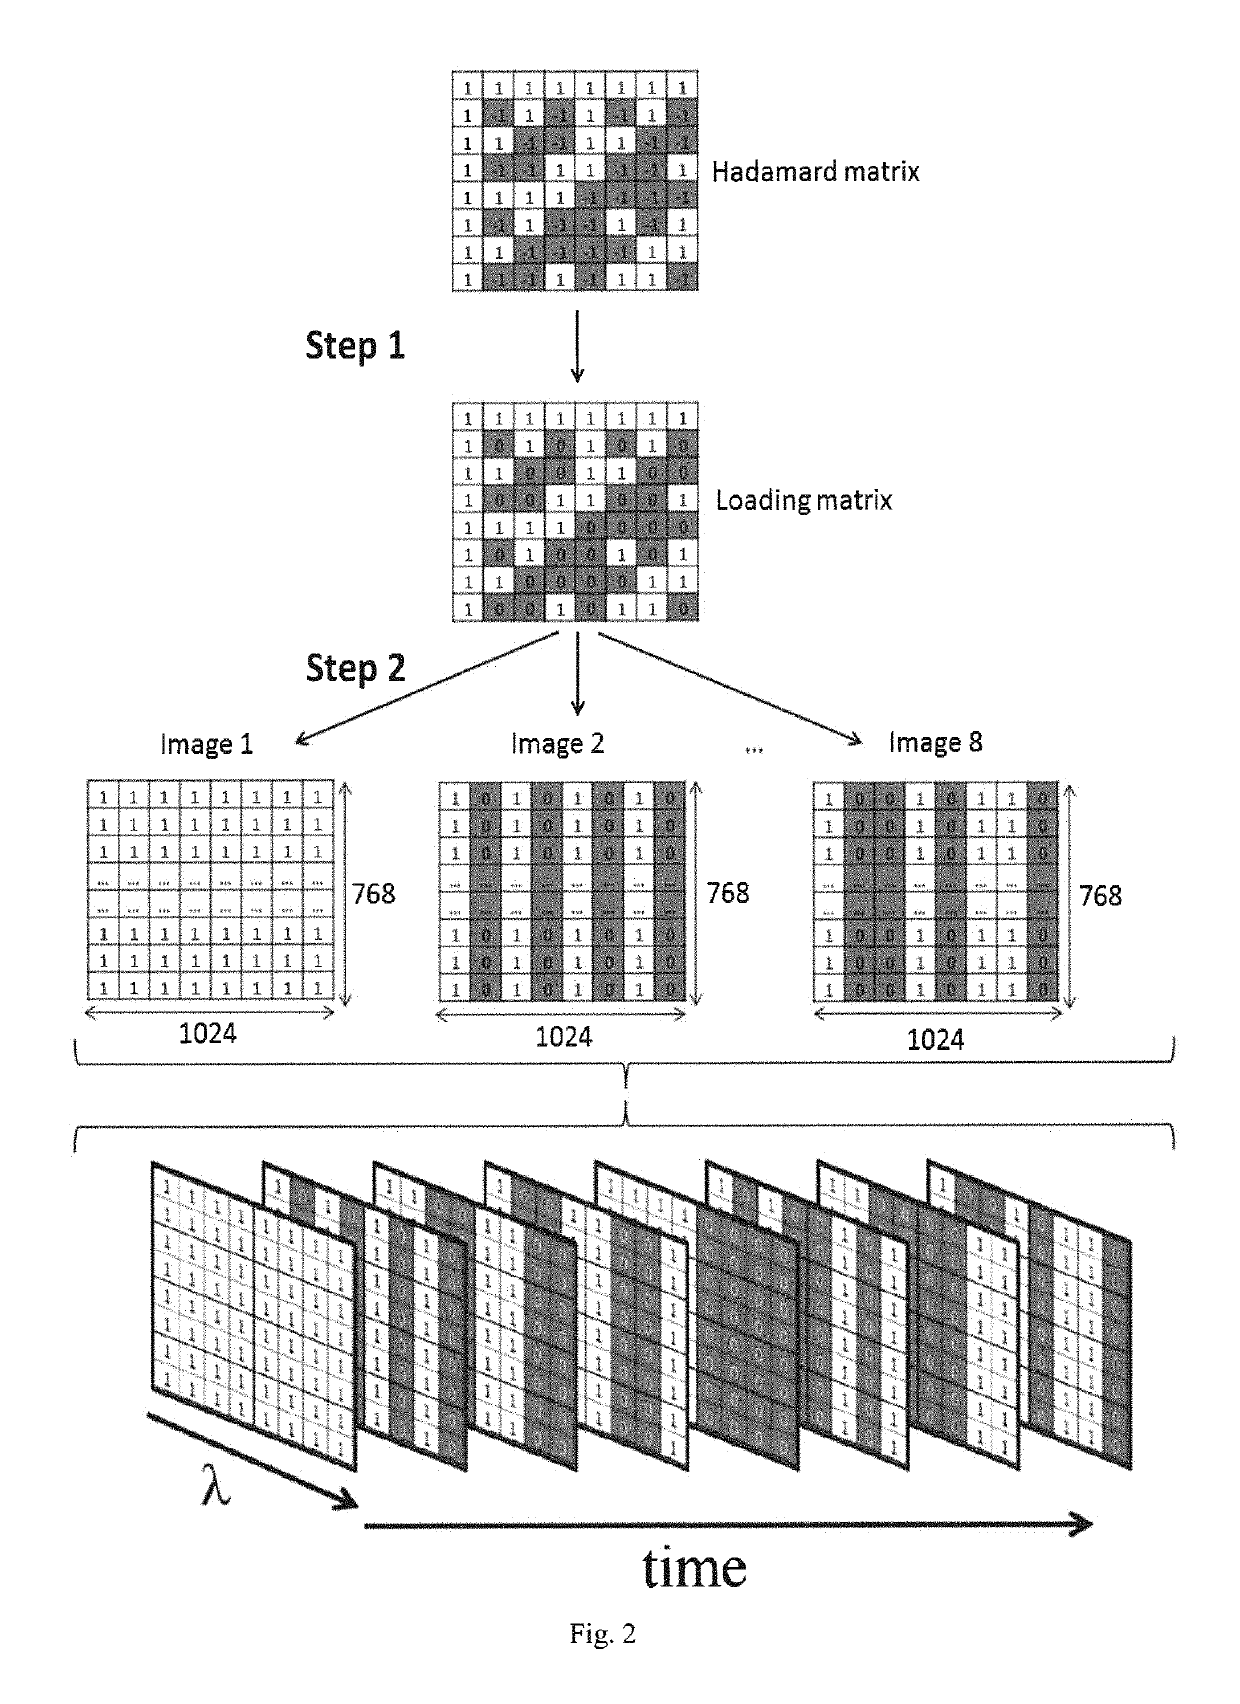
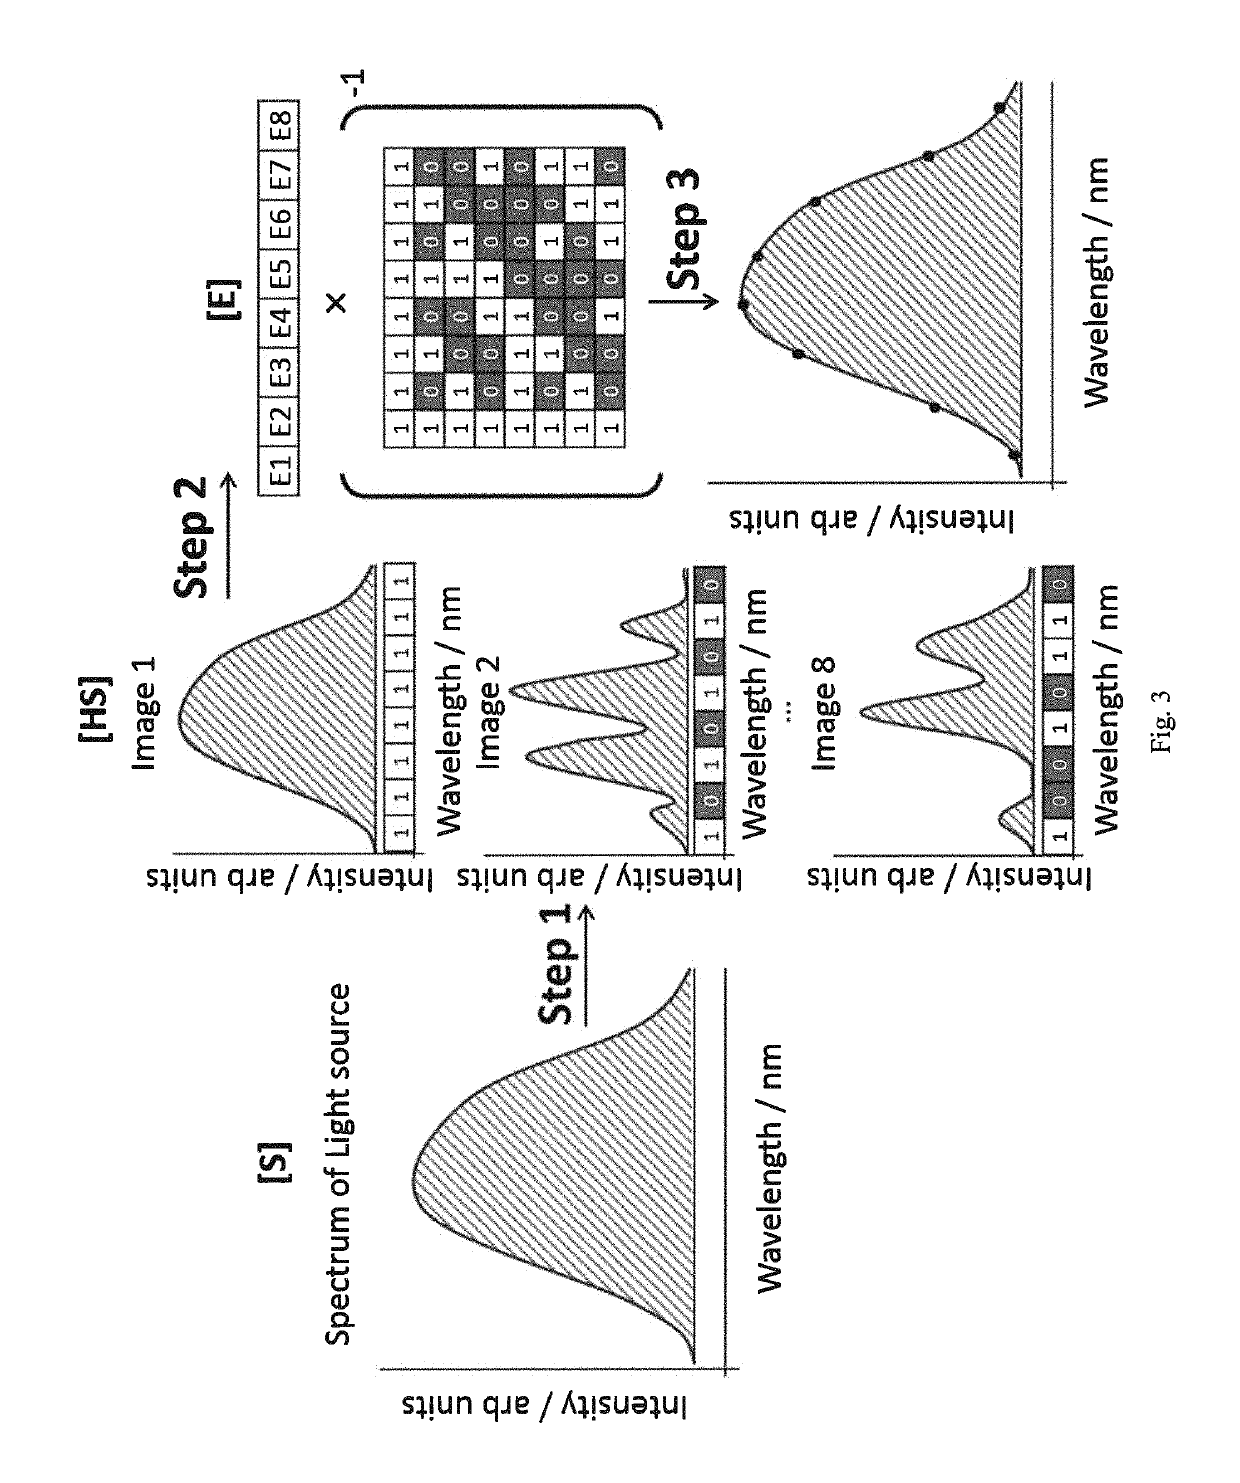
[0058]In this example a compact spectrometer (USB2000+, Ocean Optics, Inc., Florida, USA) was reconfigured. In its original configuration the spectrometer collimates the light from a multimode optical fibre onto a one-dimensional (1D) CCD array at high resolution using a reflection gating and a series of optical elements. The CCD array was removed and replaced with a DMA (ViALUX Chemnitz, Germany, V4100 XGA UV module, 1024×768 micromirrors, 13.6 μm pitch based on Texas Instruments DLP technology) to encode the excitation light. The Hadamard mask was generated and displayed on the DMA using custom designed MATLAB® (The MathWorks, Inc., Natick, Mass., USA) codes. The Hadamard mask was generated using a Hadamard matrix of order 2m as shown in FIG. 2 where, for illustration purposes, m=3 and the DMA micromirrors are grouped into 8 segments. With the available DMA the Hadamard matrix may be scaled up to 1024×1024 (m=10). At this resolution each DMA column may...

example 2

Further Embodiments

[0083]It is expected that performance of the embodiment described above may be improved when using a more powerful light source or pulsed light source to obtain a stronger fluorescence signal. A more sensitive array spectrometer based, e.g., on a thinned CCD array chip will also increase the signal-to-noise ratio. Refinements to the MATLAB (or other) code will allow EEM spectral acquisition and demodulation of the signal to be done simultaneously and continuously. Such optimization is expected to allow monitoring EEM spectra in real-time. Further, excitation wavelengths may be extended into UV for use in further applications. Also contemplated is an embodiment with simultaneous Hadamard-encoding of the excitation and emission light using a single photo multiplier tube (PMT) detector. PMTs are much faster and more sensitive than CCD arrays and this is expected to allow to sensing analytes in situ and in real-time.

[0084]The EEM spectrometer may be simplified and mad...


PUM


Abstract

Described herein is an excitation emission matrix (EEM) spectrometer and method, comprising a multiplexer that encodes excitation light produced by at least one excitation light source; and a demultiplexer that decodes encoded light emitted from a sample, and produces an output indicative of a characteristic of the sample. Embodiments are described wherein the multiplexer and the demultiplexer may comprise FDM or OFDM, and wherein both the excitation light and the emitted light may be encoded using a DMA or a SLM. In some embodiments the same DMA or SLM may be used to encode the excitation light and the emitted light. In some embodiments excitation light may be encoded using a Walsh function, or the excitation light may be encoded using a Walsh function and the emitted light may be decoded using an inverse Hadamard transformation.

Description

RELATED APPLICATIONS[0001]This application claims the benefit of the filing date of U.S. patent application Ser. No. 62 / 194,919, filed on Jul. 21, 2015, the contents of which are incorporated herein by reference in their entirety.FIELD[0002]This invention relates generally to the field of spectroscopy. More specifically, this invention relates to excitation emission matrix (EEM) spectroscopy.BACKGROUND[0003]Fluorescence spectroscopy is a highly sensitive, nearly background-free technique for chemical detection. Fluorescence detection is typically achieved by either single-line UV excitation and dispersion of the entire fluorescence emission spectrum (e.g., laser induced fluorescence (LIF)) or by tuning the excitation source over a wide wavelength range and detecting the entire spectrum of emitted light as a function of excitation wavelength with a broad band detector (e.g., excitation spectroscopy). In liquid samples excitation and emission bands are broad, making it difficult to id...

Claims


Application Information

Patent Timeline
IPC IPC(8): G01N21/64G01J3/02G01J3/44G01N21/65G02B6/36
CPCG01J3/021G01N21/645G01J3/4406G01N21/65G01N2021/6419G01J3/0218G01N2201/0675G02B6/3624G01N2021/6421
Inventor LOOCK, HANS-PETERREICH, OLIVERANDREWS, NICHOLAS L. P.
Owner QUEENS UNIV OF KINGSTON
Learn More