
Median filter for liquid chromatography-mass spectrometry data

a mass spectrometry and media filter technology, applied in the field of data analysis, can solve the problems of increasing the difficulty of the operator the procedure is clearly time-consuming, and the noise spike is difficult to distinguish the chromatographic peak, so as to achieve the effect of higher intensity

Inactive Publication Date: 2005-05-26
CAPRION PROTEOMICS INC
View PDF41 Cites 12 Cited by
  • Summary
  • Abstract
  • Description
  • Claims
  • Application Information

AI Technical Summary

Benefits of technology

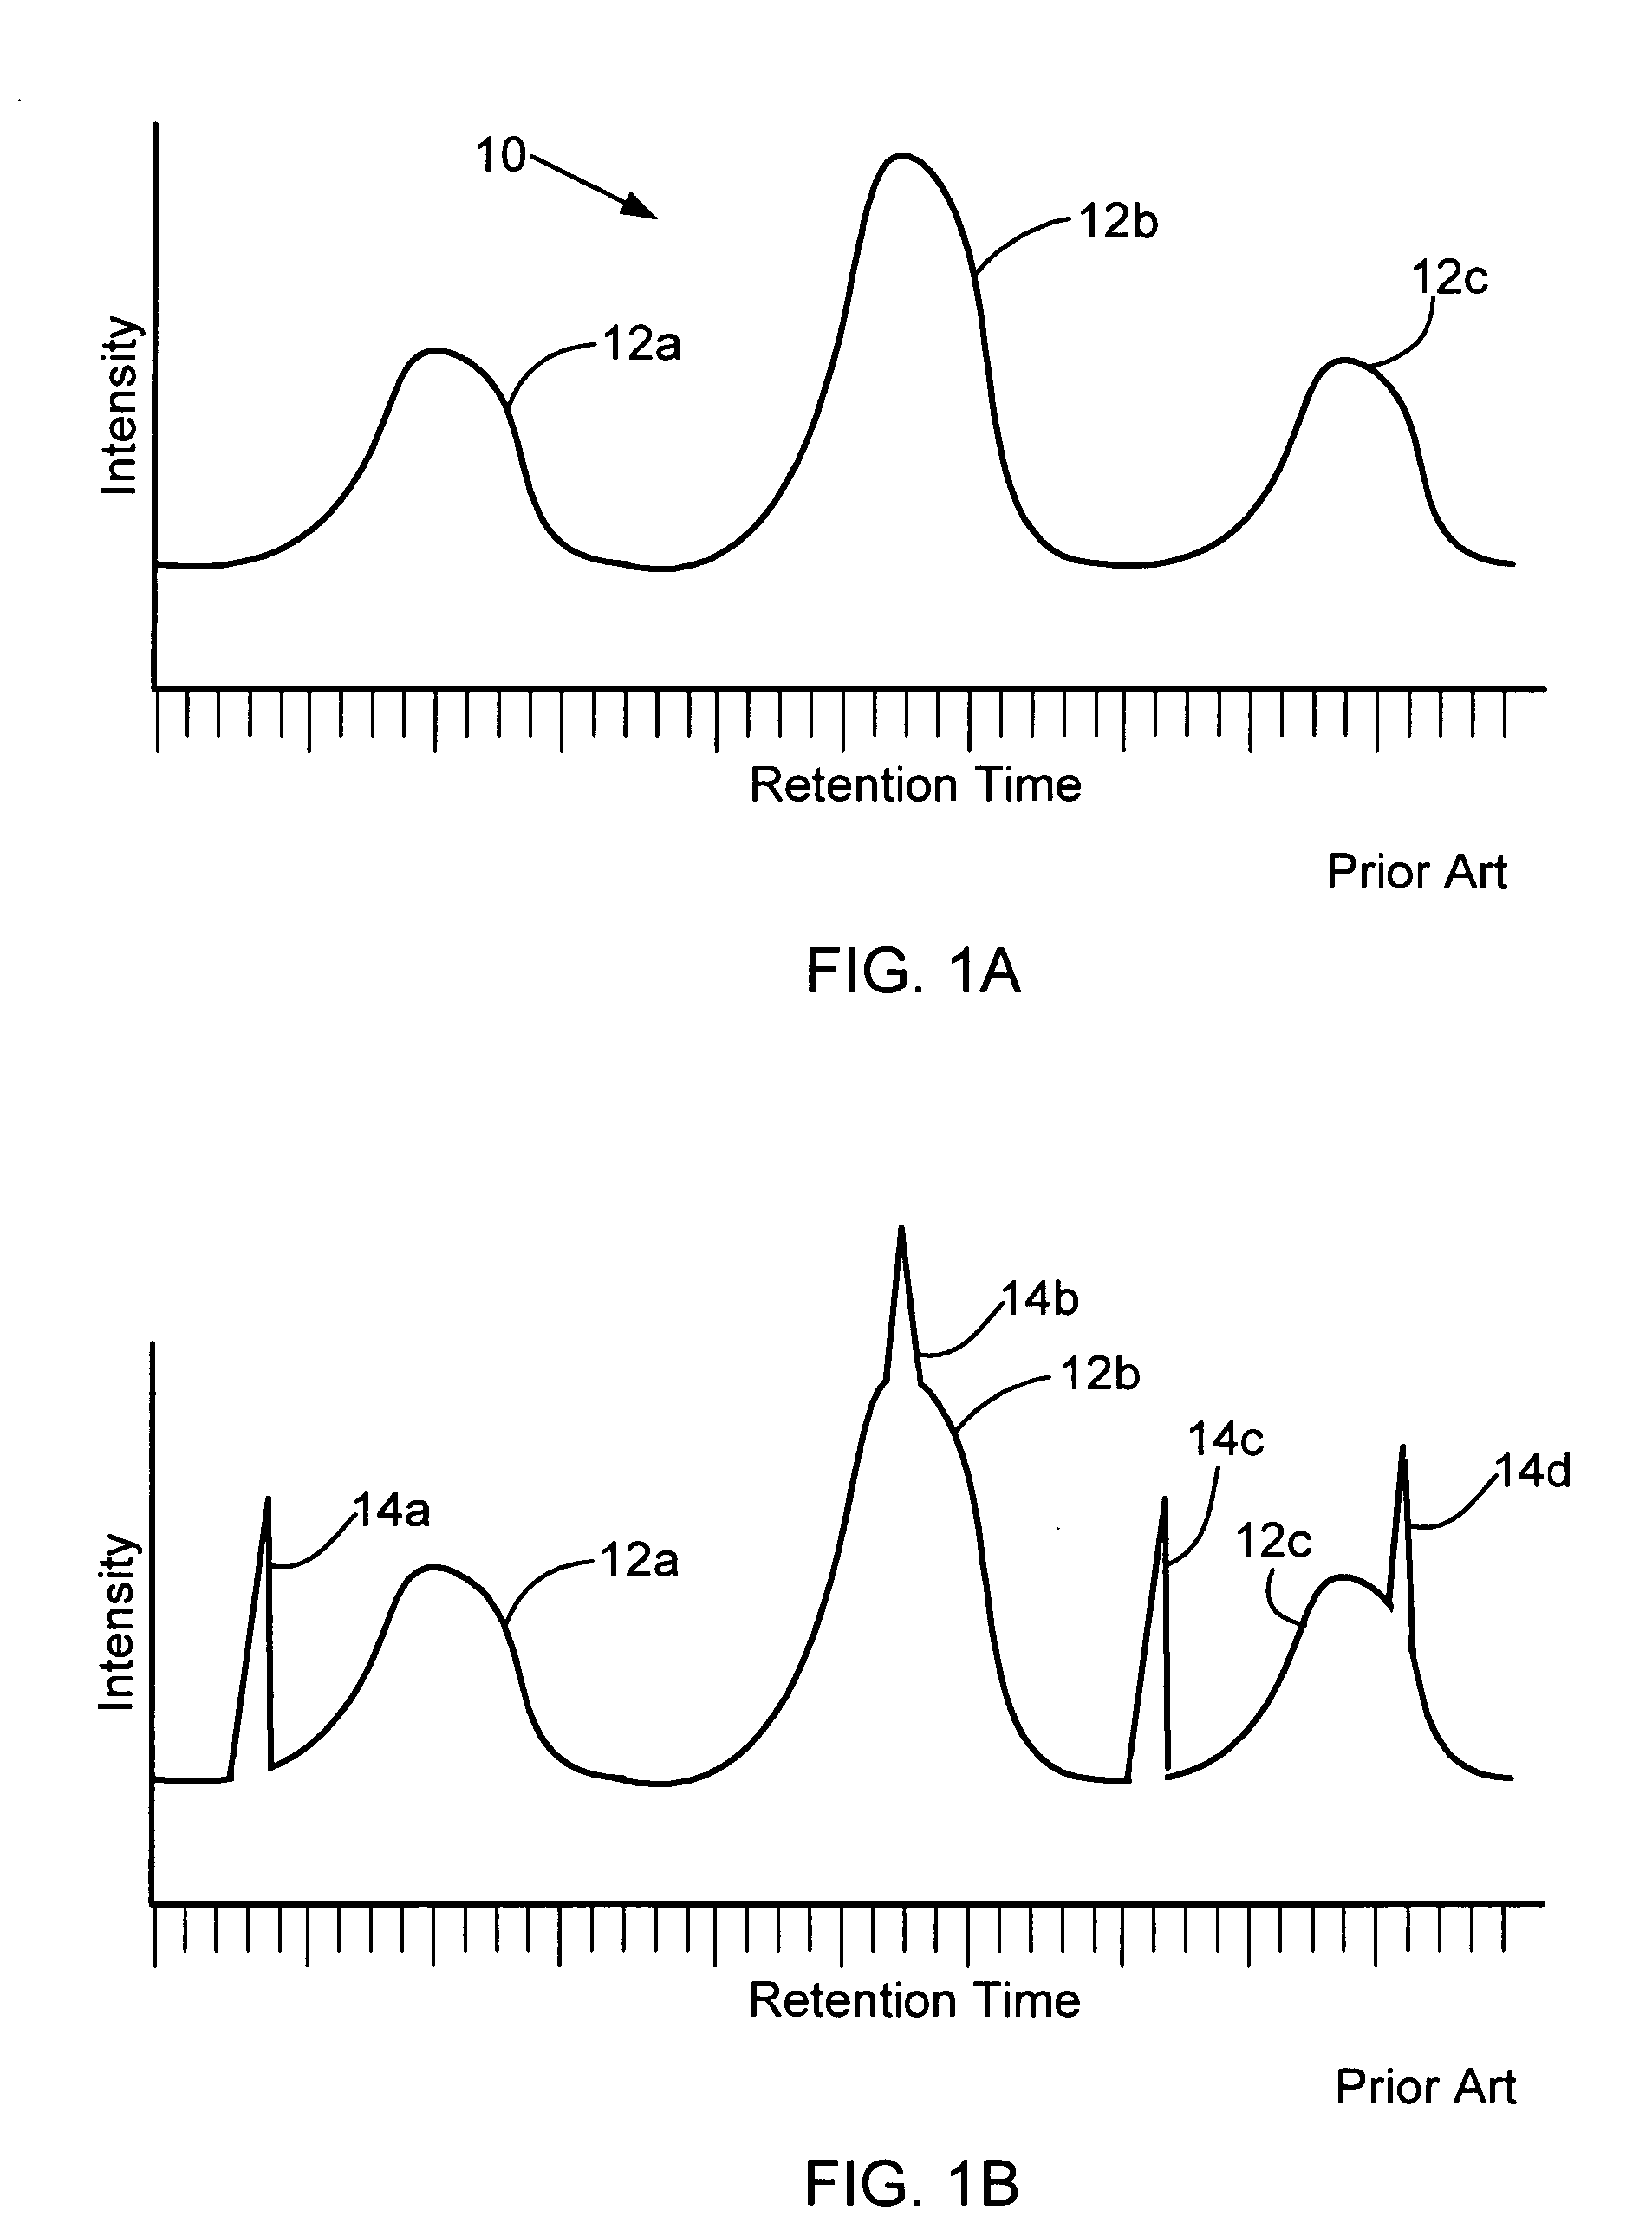
[0013] The present invention provides a method for filtering noisy mass chromatograms in two-dimensional liquid chromatography-mass spectrometry (LC-MS) data. The method can remove noise spikes that have a higher intensity than peaks corresponding to eluted analytes, while essentially retaining the peak intensity and shape. It therefore performs substantially better than conventional linear filters that assume a normal distribution of the noise.

Problems solved by technology

Although components elute over multiple scans, noise spikes typically do not extend beyond one scan time.
However, as the amount of noise present increases, it becomes more difficult for the operator to distinguish the chromatographic peaks, particularly if the noise level is higher than the signal level.
Such a procedure is clearly very time consuming.
Furthermore, when the mixture contains unknown analytes, the operator cannot confidently determine which mass spectral peaks are noise and which are actual peaks.
However, proteomics and small molecule studies typically have a set of requirements that cannot be met by manual interpretation of the LC-MS data.
First, these studies require high-throughput analysis of small volumes of biological fluid.
Manual data interpretation creates a bottleneck in sample processing that severely limits the number of samples that can be analyzed in a given time period.
Second, unlike traditional research applications, in which a relatively small amount of data is required, the paradigm of these studies is to acquire enormous amounts of data and then mine the data for new correlations and patterns.
Manual data analysis is therefore unfeasible.
In addition, biological samples are generally complex mixtures of unknown compounds, and so it is not desirable to extract only known spectra and discard the remaining data, an approach that has been used for studies involving quantification of known compounds in a mixture.
However, it can only accept or reject entire chromatograms based on their noise level, but cannot filter noise from an individual chromatogram.
The technique described in Gedcke et al. is only effective for noise levels that are substantially below the level of the peaks.
As with the method of Gedcke et al., the method of Dryden et al. can only be used when the noise intensity is substantially lower than the signal intensity.
Because LC-MS data often has noise values exceeding the signal values, the method of Dryden et al. is not effective at removing noise from LC-MS data.
The method is not, however, applied to two-dimensional data such as LC-MS data.
Without centroiding, an unmanageable amount of data would be generated for each spectrum.
Because the peak shape is removed in the reported data, filtering or analytical methods cannot be applied to the mass spectra.
Moreover, in some cases, one major source of noise, detector noise, can corrupt an entire mass spectrum.
If a high fraction of the points in the filter window are corrupted, then a median filter applied to the spectrum cannot remove this noise.

Method used


Image

  • Median filter for liquid chromatography-mass spectrometry data
  • Median filter for liquid chromatography-mass spectrometry data
  • Median filter for liquid chromatography-mass spectrometry data

Examples


Embodiment Construction

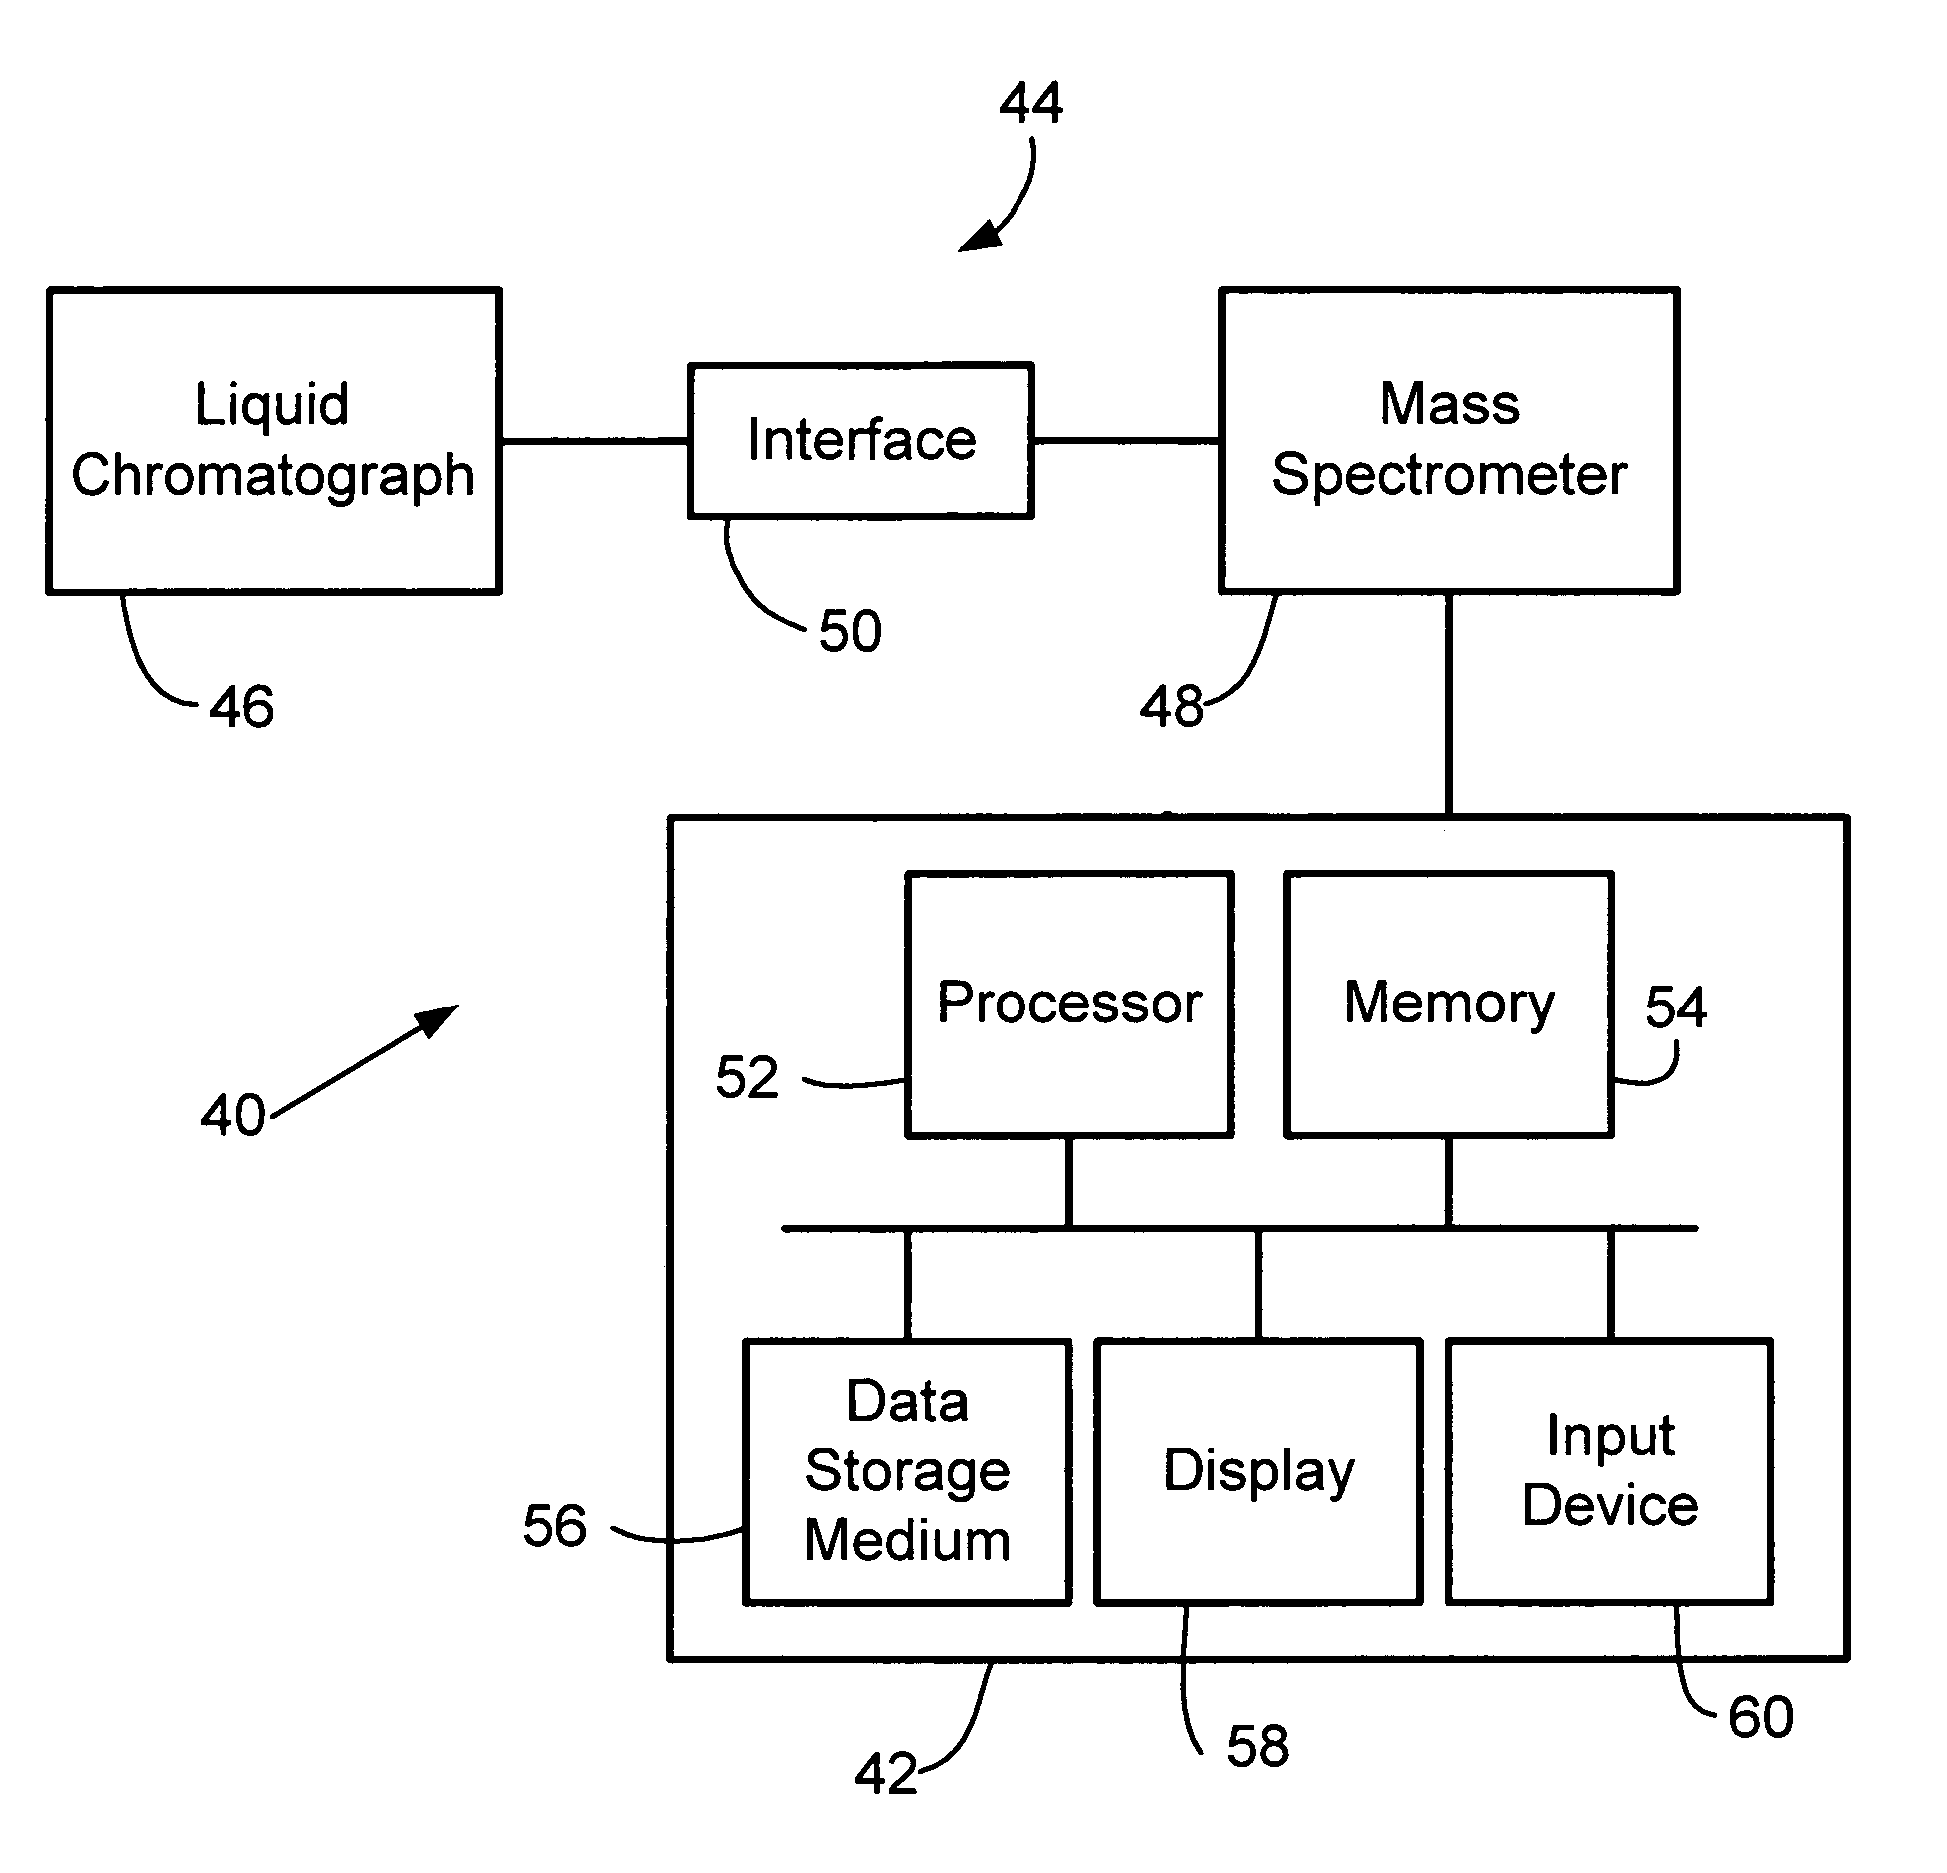
[0026] The present invention provides a method for filtering chromatographic and spectrometric data to reduce noise in individual mass chromatograms, thereby facilitating subsequent selection of peaks or high quality chromatograms for component detection. In liquid chromatography-mass spectrometry (LC-MS) or gas chromatography-mass spectrometry (GC-MS) data, the noise intensity is often larger than the intensity of the peaks corresponding to eluted species, making it very difficult to extract meaningful information from the data. The method of the invention is able to reduce substantially such large magnitude noise spikes.

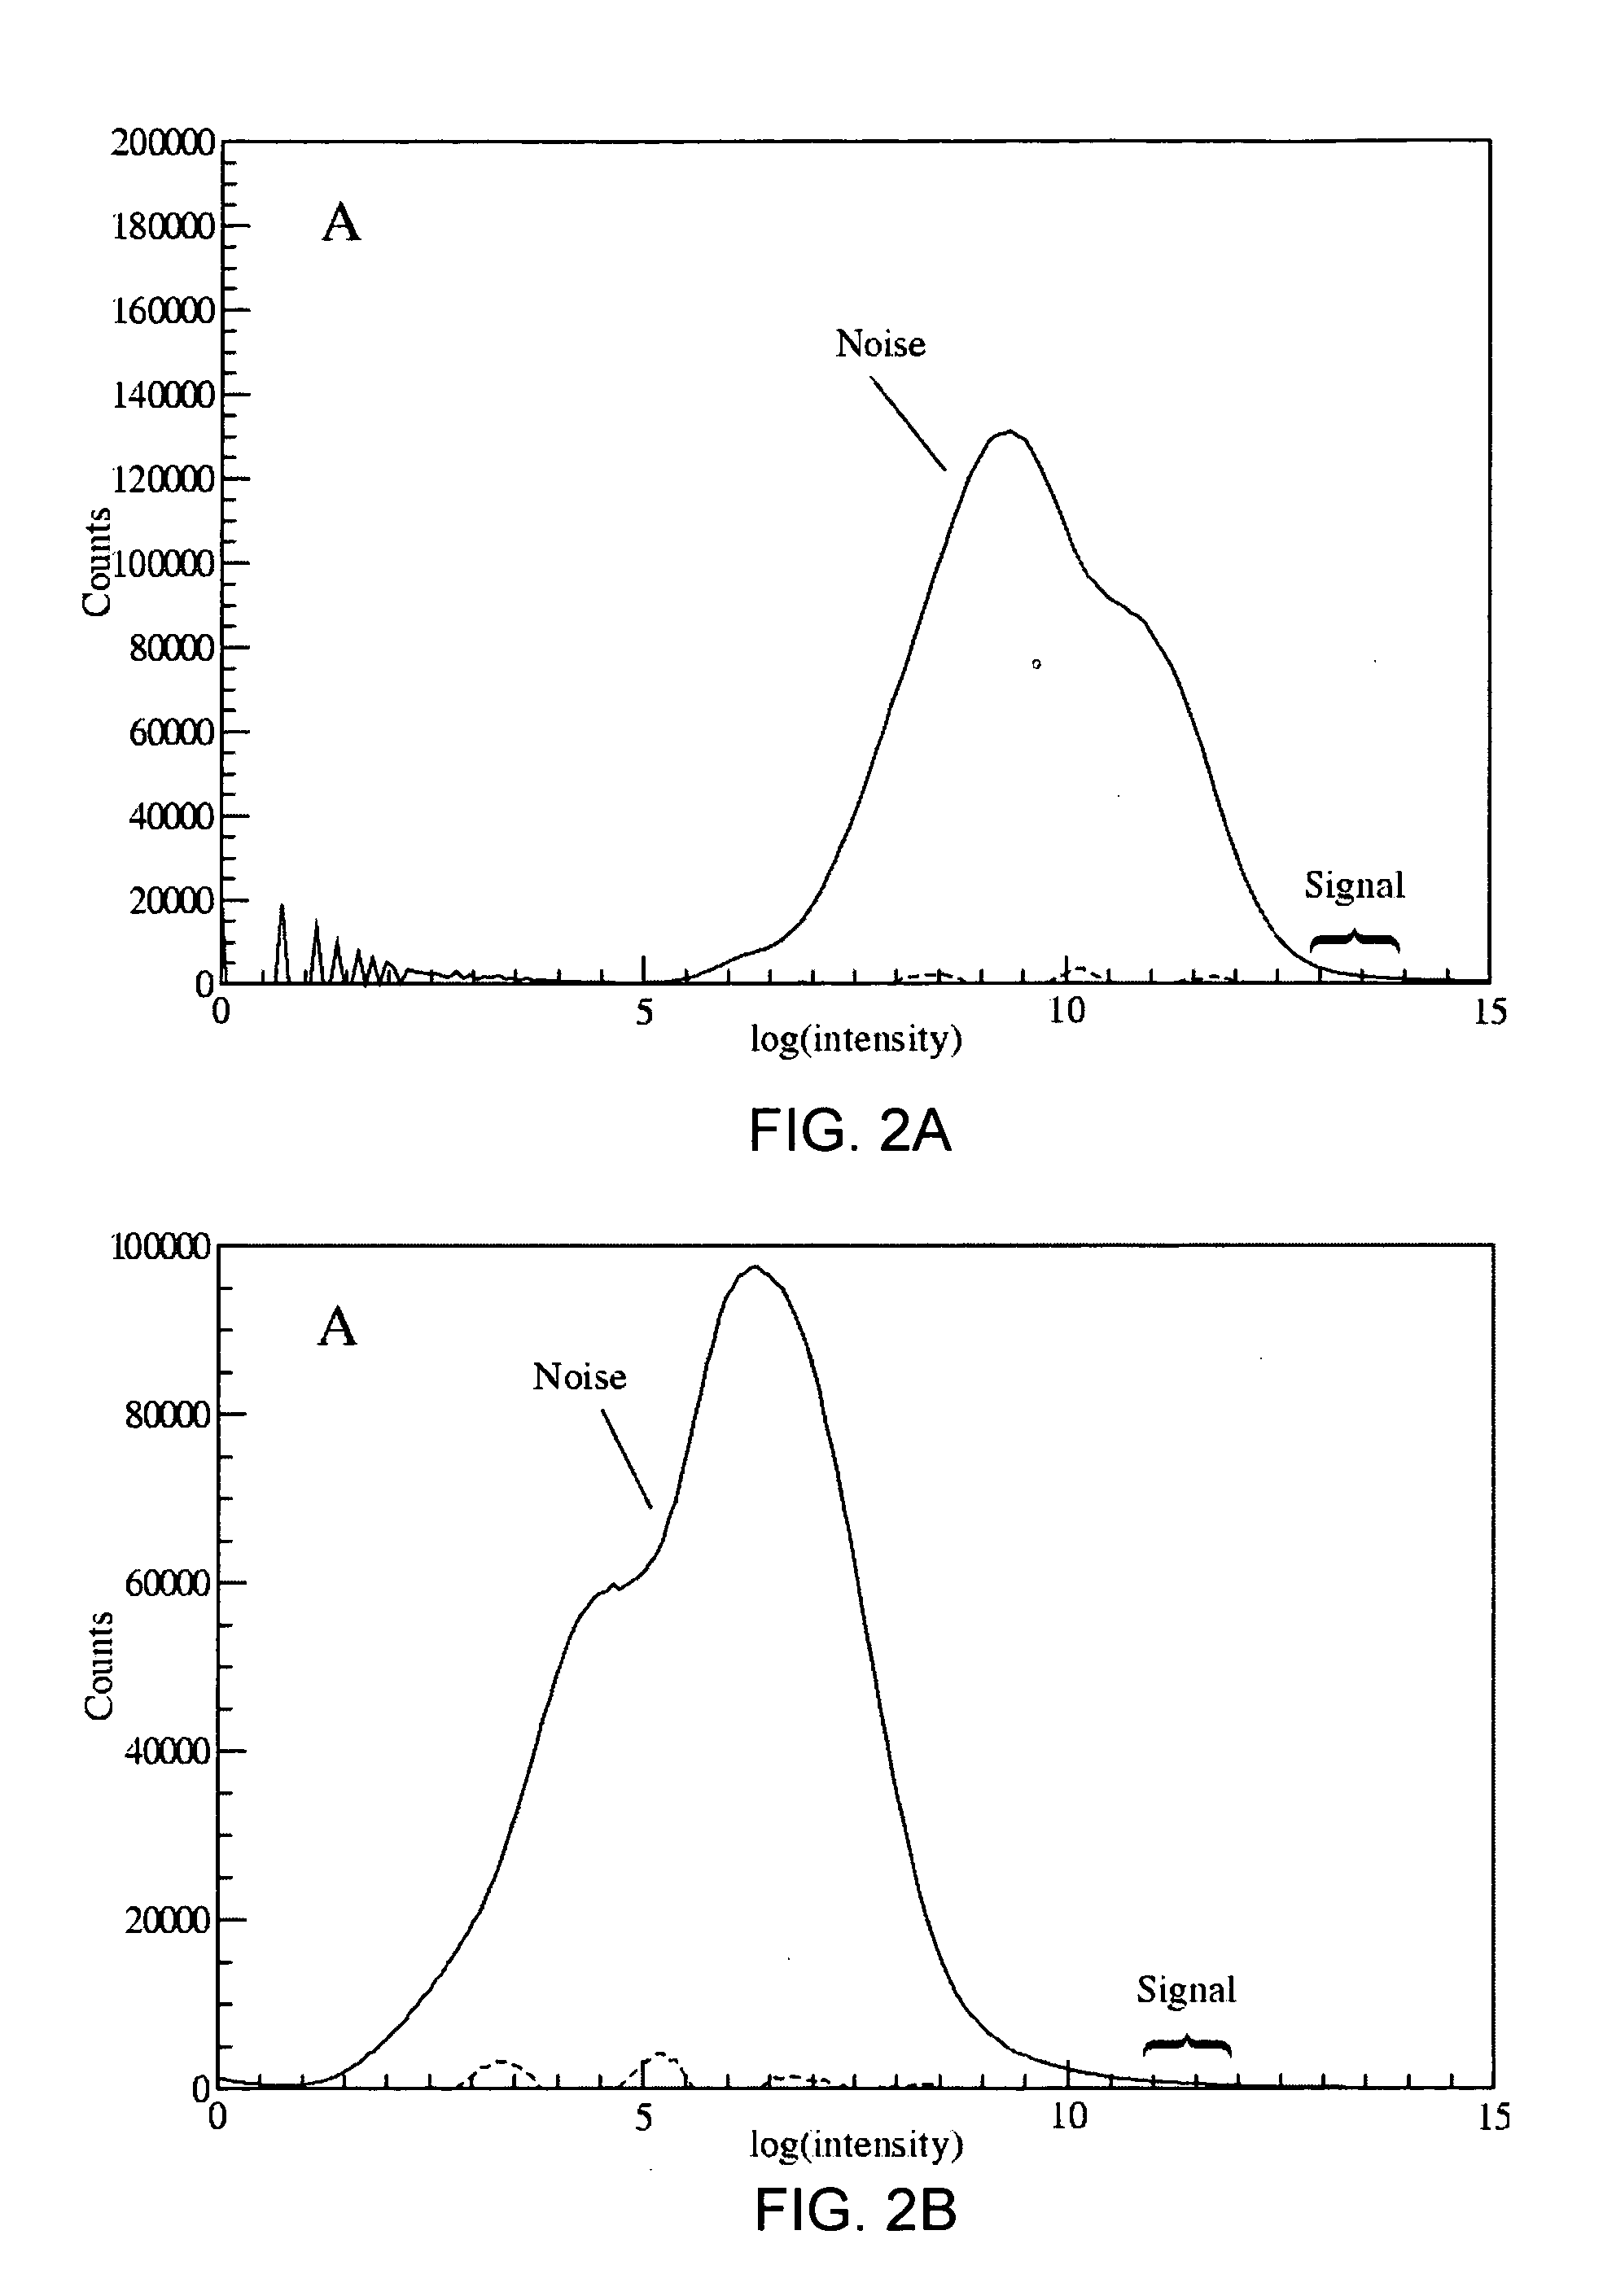
[0027] LC-MS noise originates from a variety of sources corresponding to different components of the system. Each physical mechanism of the system contributes its own noise distribution to the final measured ion current. For example, chemical noise results from column bleed, i.e., long-time elution of strongly-adsorbed species at particular mass-to-charge ratios, ...


PUM


Abstract

High-intensity, spiked noise is reduced in chromatography-mass spectrometry data by applying a nonlinear filter such as a moving median filter to the data. The filter is applied to individual mass chromatograms, plots of ion abundance versus retention time for each detected mass-to-charge ratio, and the filtered chromatograms are combined to form a filtered total ion current chromatogram. Standard linear filters are not effective for reducing noise in liquid chromatography-mass spectrometry (LC-MS) data because they assume a normal distribution of noise. LC-MS noise, however, is not normally distributed.

Description

RELATED APPLICATIONS [0001] This application is a continuation of patent application Ser. No. 09 / 994,575, “Median Filter for Liquid Chromatography-Mass Spectrometry Data,” filed Nov. 27, 2001, which claims the benefit of U.S. Provisional Application 60 / 253,178, “Informatics System,” filed Nov. 27, 2000 and U.S. Provisional Application No. 60 / 314,996, “Nonlinear Filter For Liquid Chromatography-Mass Spectrometry Data,” filed Aug. 24, 2001, all of which are herein incorporated by reference.FIELD OF THE INVENTION [0002] This invention relates generally to analysis of data collected by analytical techniques such as chromatography and spectrometry. More particularly, it relates to a nonlinear filter such as a moving median filter for noise reduction in mass chromatograms acquired by liquid chromatography-mass spectrometry. BACKGROUND OF THE INVENTION [0003] Liquid chromatography-mass spectrometry (LC-MS) is a well-known combined analytical technique for separation and identification of c...

Claims


Application Information

Patent Timeline
IPC IPC(8): G01N30/72G01N30/86H01J49/04
CPCG01N30/72G01N30/8624H01J49/0431H01J49/0036G01N30/8641
Inventor HASTINGS, CURTIS A.
Owner CAPRION PROTEOMICS INC
Learn More