
Multiplexed analysis of clinical specimens apparatus and method

a clinical specimen and multi-modal technology, applied in the field of laboratory diagnostic and genetic analysis, can solve the problems of significant analytical errors, limited capability, unsatisfactory results, etc., and achieve the effect of expanding the multiplexing power of the system

Inactive Publication Date: 2005-06-02
LUMINEX
View PDF43 Cites 78 Cited by
  • Summary
  • Abstract
  • Description
  • Claims
  • Application Information

AI Technical Summary

Benefits of technology

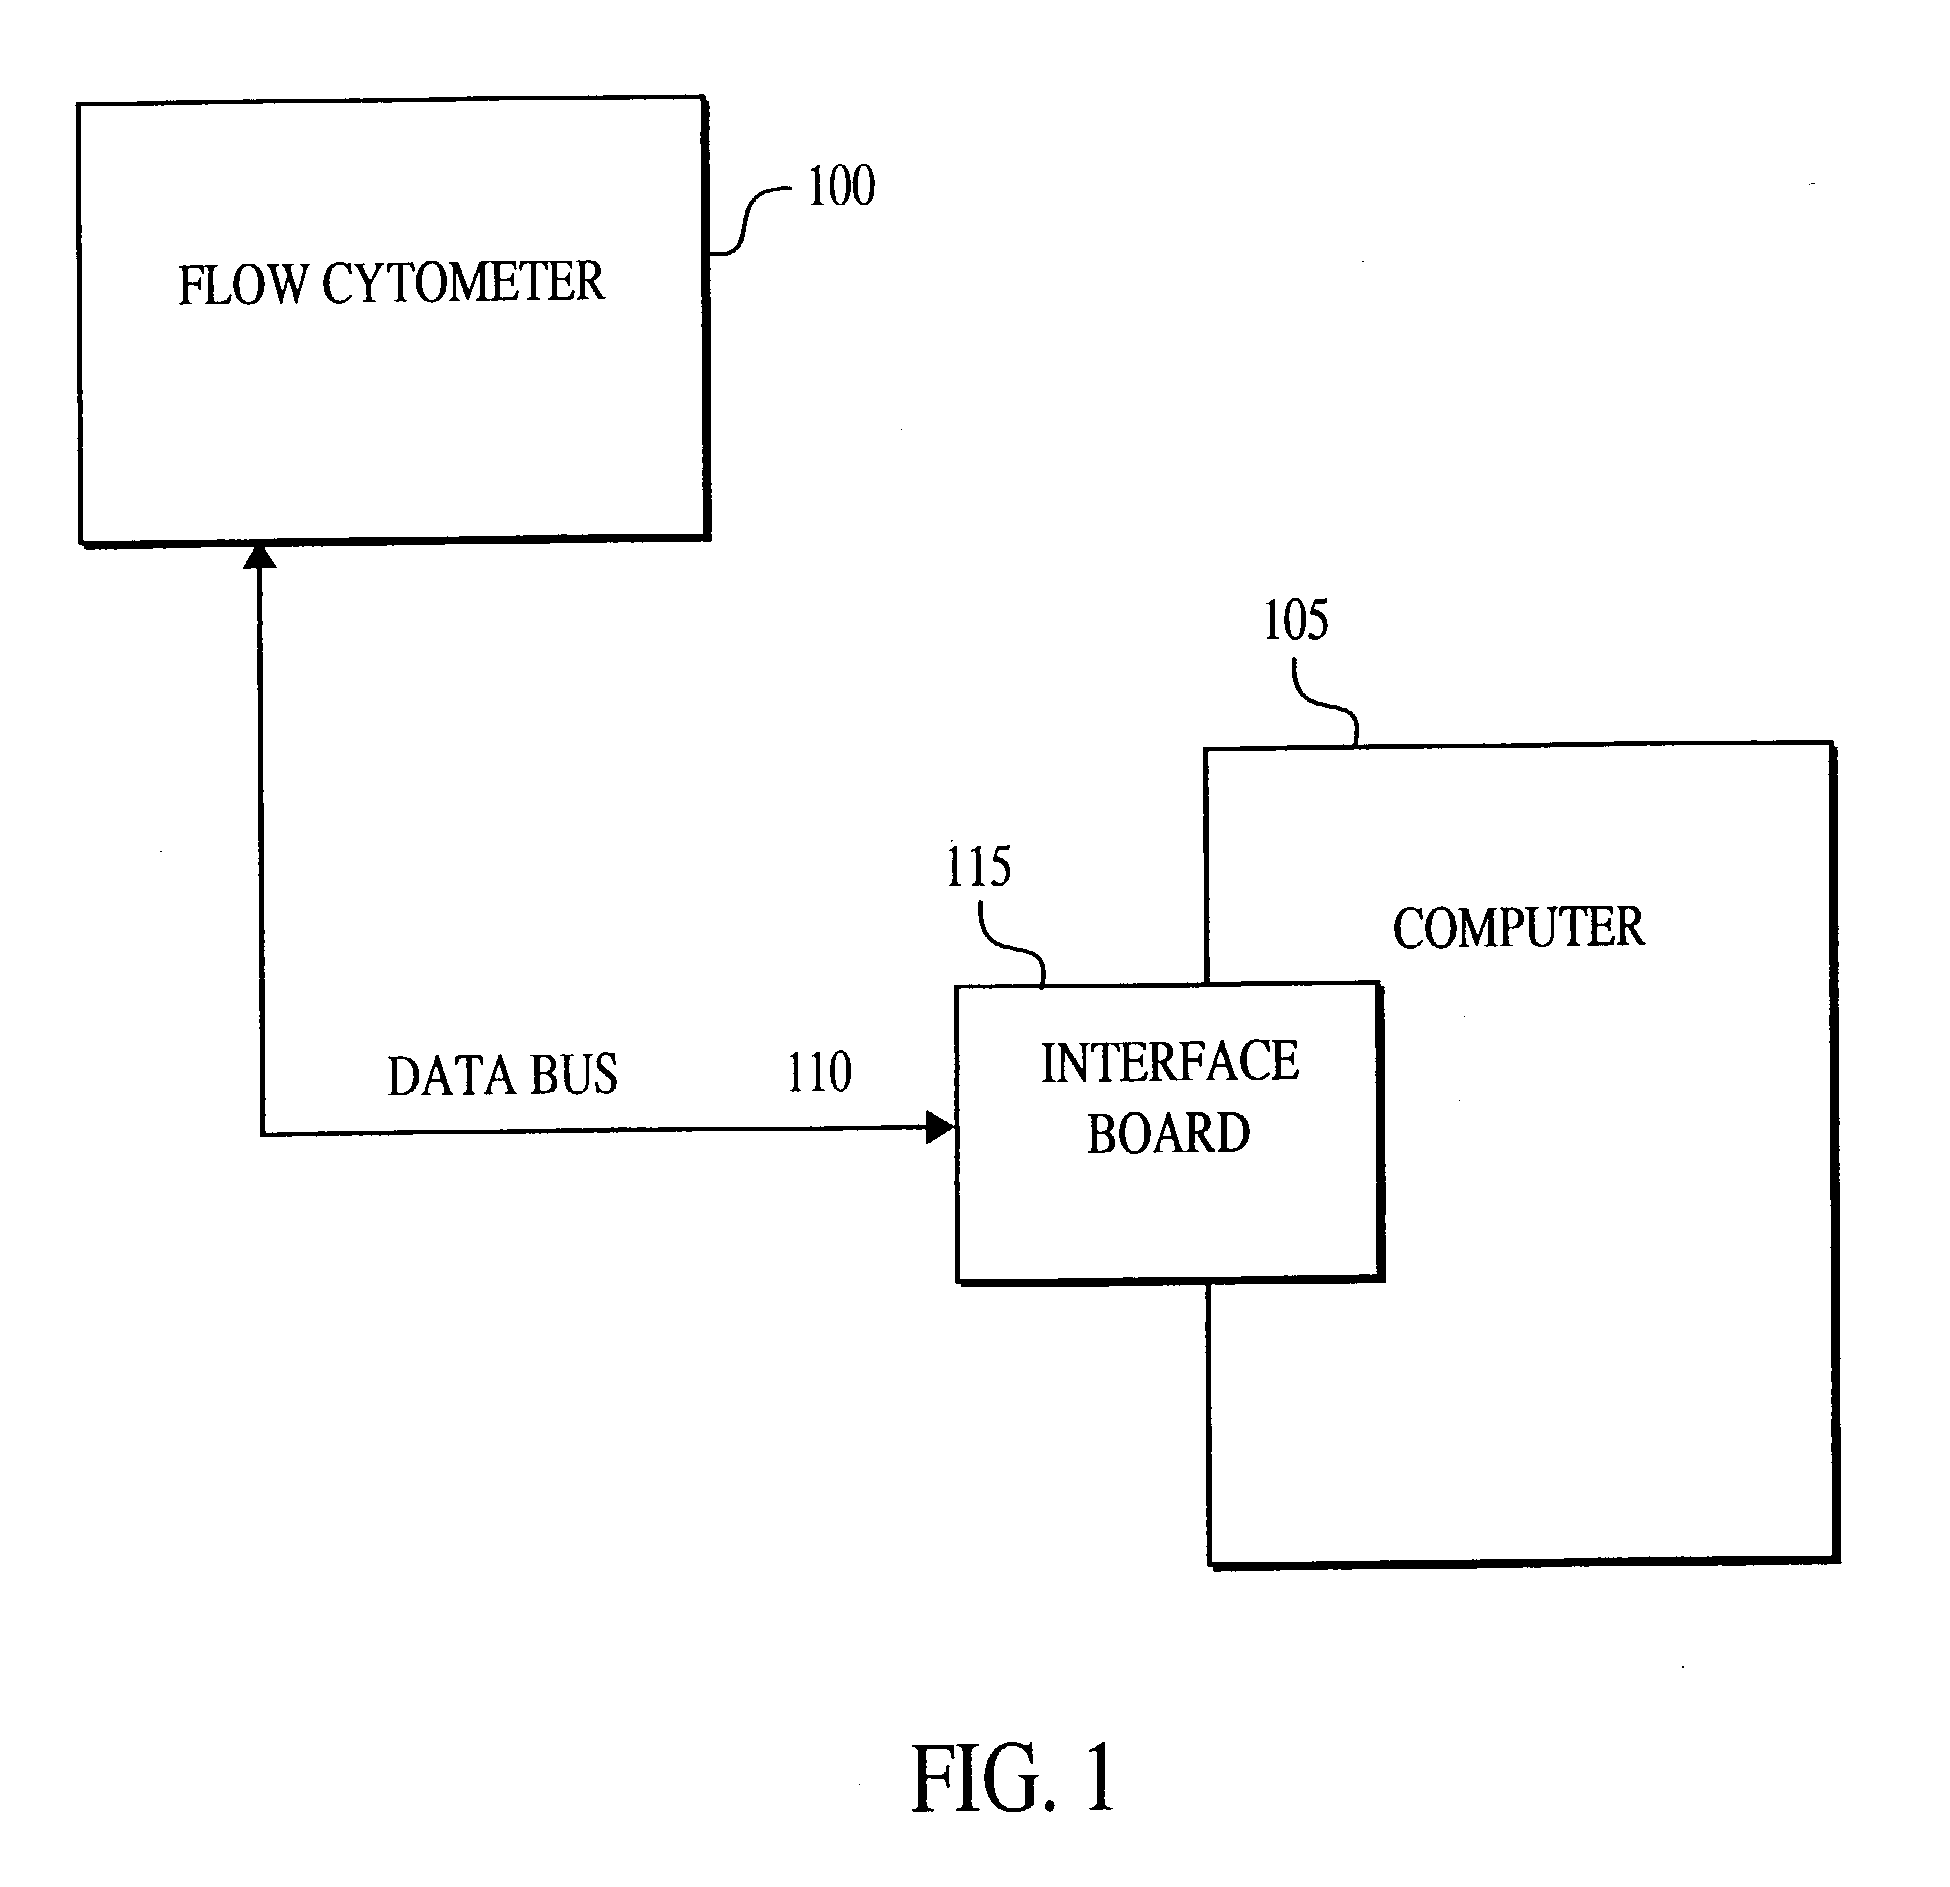
[0015] The present invention provides improved methods, instrumentation, and products for detecting multiple analytes in a fluid sample by flow cytometric analysis and for analyzing and presenting the data in real-time. An advantage of the invention is that it allows one rapidly and simultaneously to detect a wide variety of analytes of interest in a single assay step.
[0016] The invention employs a pool of bead subsets. The individual subsets are prepared so that beads within a subset are relatively homogeneous but differ in at least one distinguishing characteristic from beads in any other subset. Therefore, the subset to which a bead belongs can readily be determined after beads from different subsets are pooled.
[0017] In a preferred embodiment, the beads within each subset are uniform with respect to at least three and preferably four known classification parameter values measured with a flow cytometer: e.g., forward light scatter (C1) which generally correlates with size and refractive index; side light scatter (C2) which generally correlates with size; and fluorescent emission in at least one wavelength (C3), and preferably in two wavelengths (C3 and C4), which generally results from the presence of fluorochrome(s) in or on the beads. Because beads from different subsets differ in at least one of the above listed classification parameters, and the classification parameters for each subset are known, a bead's subset identity can be verified during flow cytometric analysis of the pool in a single assay step and in real-time.
[0018] Prior to pooling subsets of beads to form a beadset, the beads within each subset can be coupled to a reactant that will specifically react with a given analyte of interest in a fluid sample to be tested. Usually, different subsets will be coupled to different reactants so as to detect different analytes. For example, subset 1 may be labeled so as to detect analyte A (AnA); subset 2 may be labeled so as to detect analyte B (AnB); etc.
[0019] At some point prior to assay, the variously labeled subsets are pooled. The pooled beads, or beadset, are then mixed with a fluid sample to test for analytes reactive with the various reactants bound to the beads. The system is designed so that reactions between the reactants on the bead surfaces and the corresponding analytes in the fluid sample will cause changes in the intensity of at least one additional fluorescent signal (Fm) emitted from a fluorochrome that fluoresces at a wavelength distinct from the wavelengths of classification parameters C3 or C4. The Fm signal serves as a “measurement signal,” that is, it indicates the extent to which the reactant on a given bead has undergone a reaction with its corresponding analyte. The Fm signal may result from the addition to the assay mixture of fluorescently labeled “secondary” reagent that binds to the bead surface at the site where a reactant-analyte reaction has occurred.
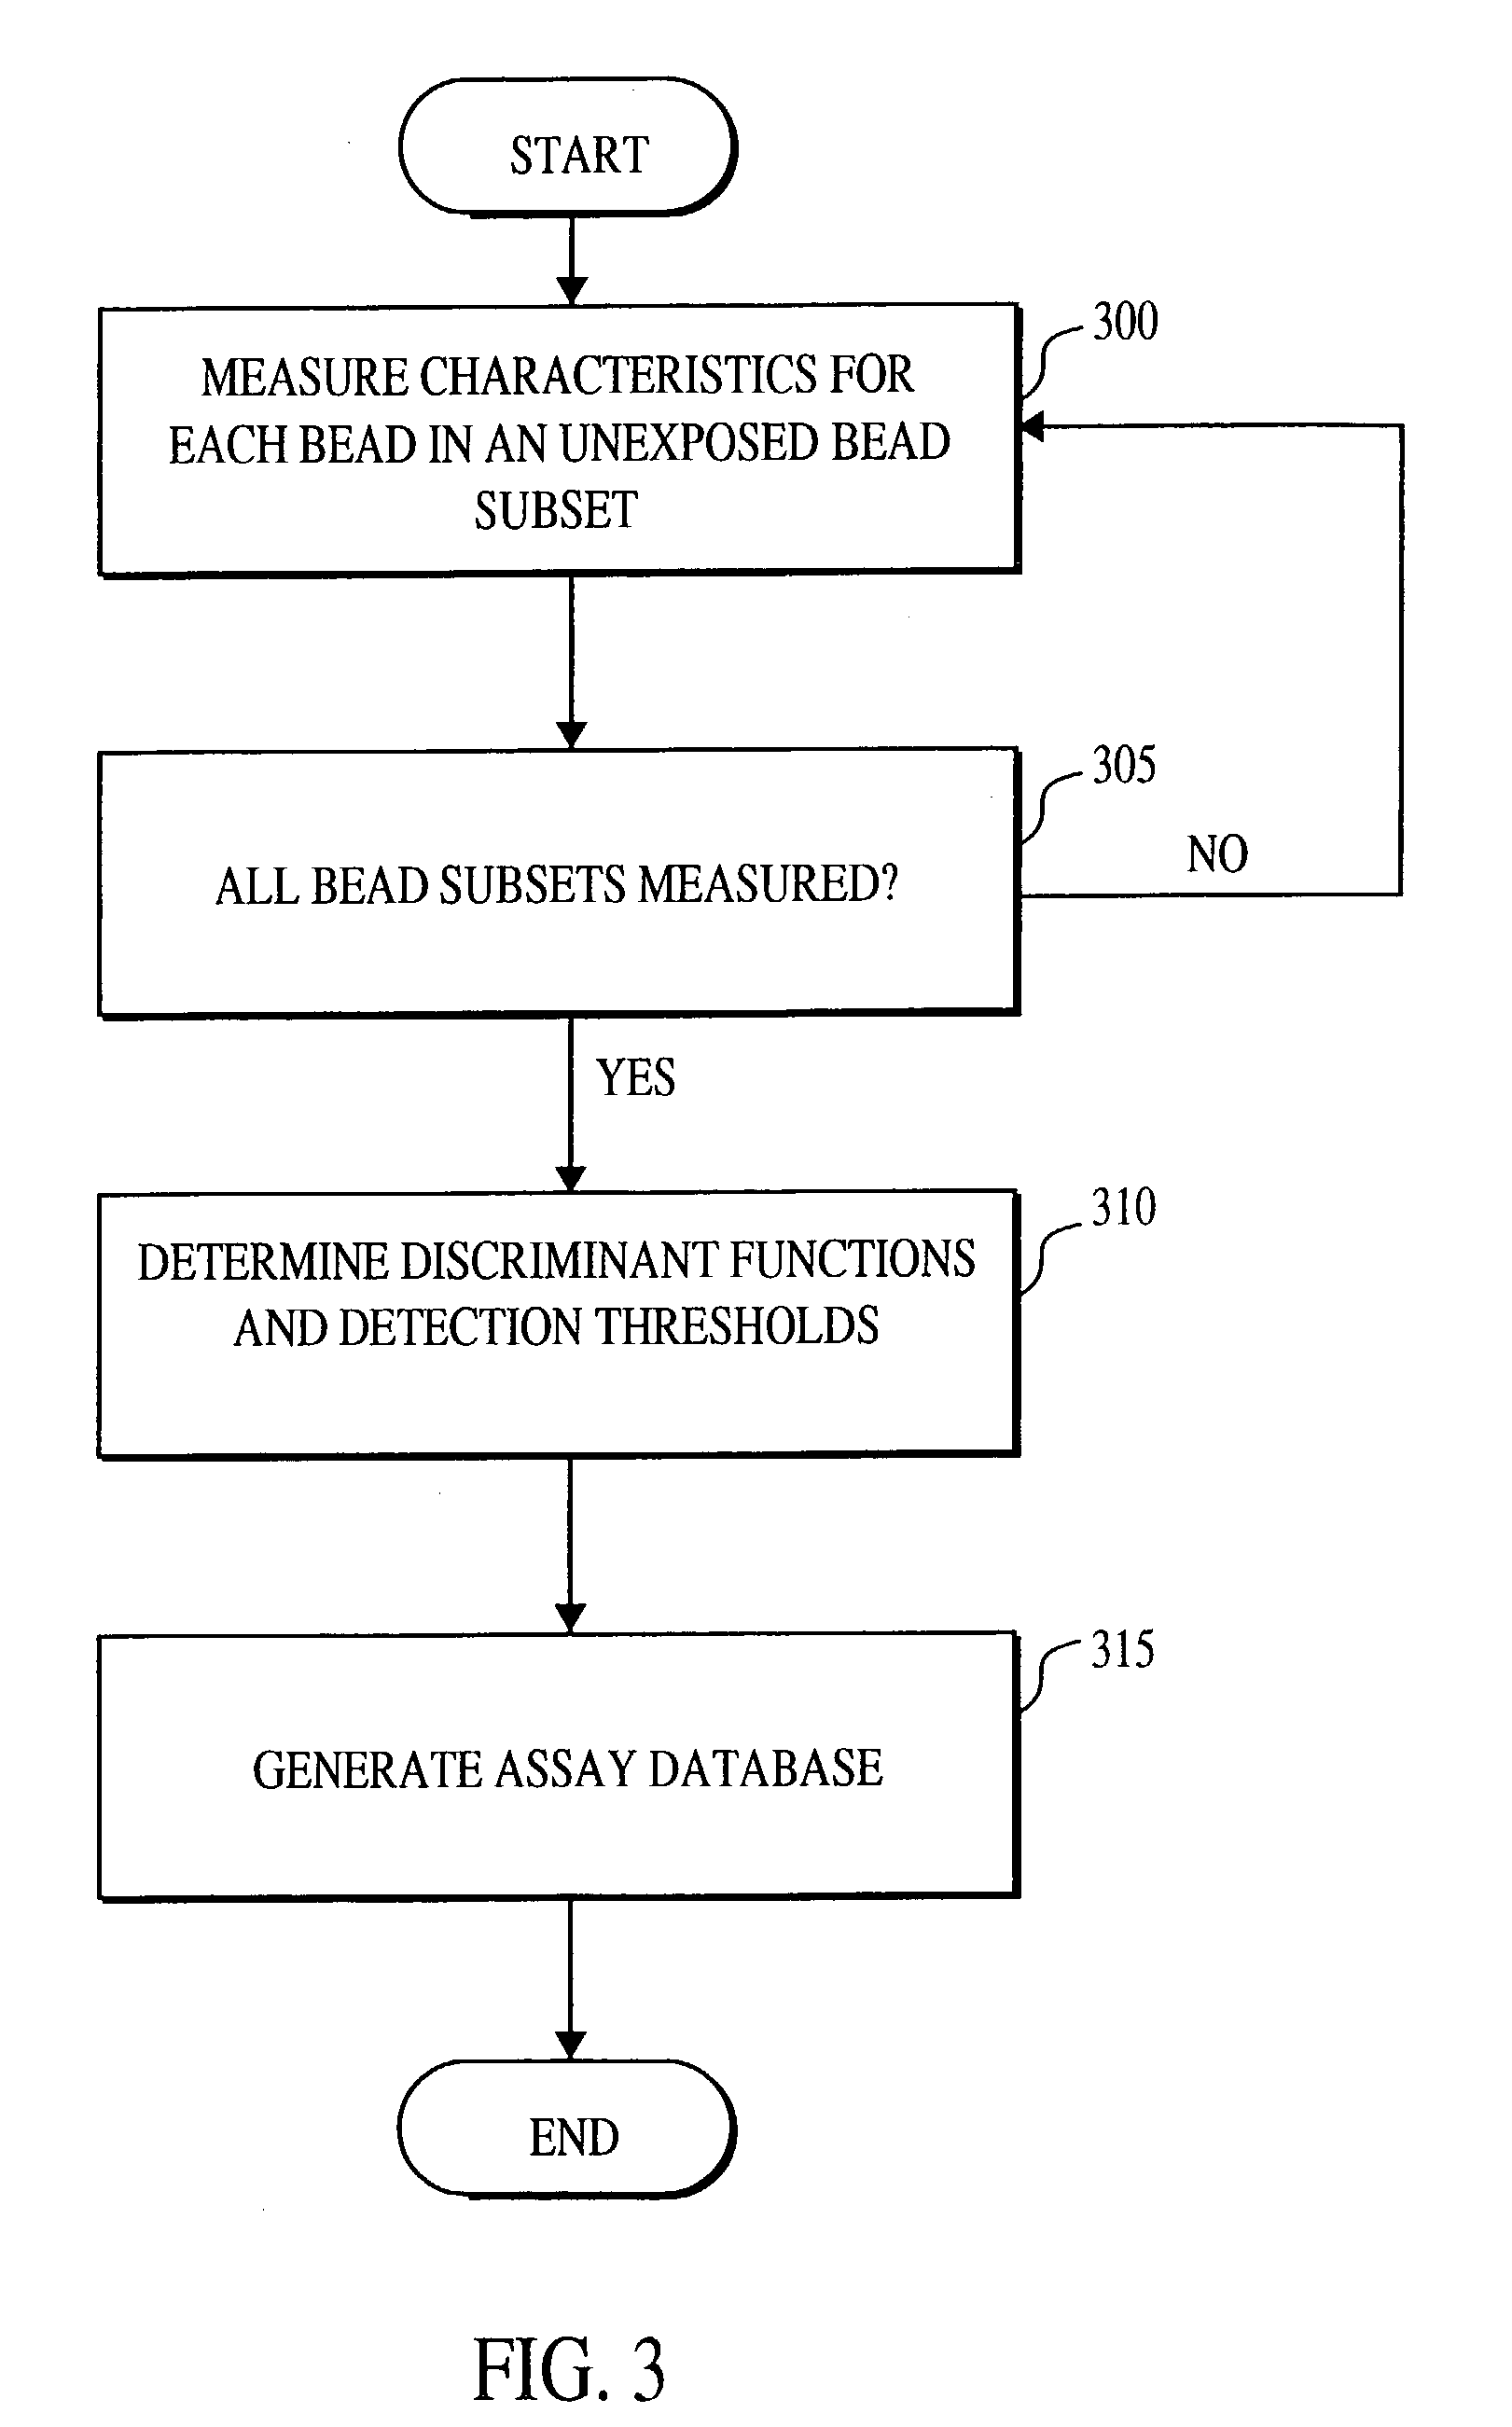
[0020] When the mixture (pooled beads and fluid sample) is run through a flow cytometer, each bead is individually examined. The classification parameters, e.g., C1, C2, C3, and C4, are measured and used to classify each bead into the subset to which it belongs and, therefore, identify the analyte that the bead is designed to detect. The Fm value of the bead is determined to indicate the concentration of analyte of interest in the fluid sample. Not only are many beads from each subset rapidly evaluated in a single run, multiple subsets are evaluated in a single run. Thus, in a single-pass and in real-time a sample is evaluated for multiple analytes. Measured Fm values for all beads assayed and classified as belonging to a given subset may be averaged or otherwise manipulated statistically to give a single meaningful data point, displayed in histogram format to provide information about the distribution of Fm values within the subset, or analyzed as a function of time to provide information about the rate of a reaction involving that analyte.

Problems solved by technology

Detection of multiple analytes, or separately identifiable characteristics of one or more analytes, through single-step assay processes are presently not possible or, to the extent possible, have provided only very limited capability and have not yielded satisfactory results.
Some of the reasons for these disappointing results include the extended times typically required to enable the detection and classification of multiple analytes, the inherent limitations of known reagents, the low sensitivities achievable in prior art assays which often lead to significant analytical errors and the unwieldy collection, classification, and analysis of prior art algorithms vis à vis the large amounts of data obtained and the subsequent computational requirements to analyze that data.
Although a multiplexed analysis capability theoretically would provide enormous benefits in the art of flow cytometry, very little multiplexing capability has been previously achieved.
Prior multiplexed assays have obtained only a limited number of determinations.
The above cited methods have been unsatisfactory as applied to provide a fully multiplexed assay capable of real-time analysis of more than a few different analytes.
Also, the analytic determinations made were hampered due to software limitations including the inability to perform real-time processing of the acquired assay data.
In summary, although it has been previously hypothesized that flow cytometry may possibly be adapted to operate and provide benefit in a multiple analyte assay process, such an adaptation has not in reality been accomplished.
At least one use of flow cytometry for the assay of a PCR product has been reported but that assay has not been adapted to multiplexing.
The procedure was limited, inter alia, in that avidin beads having only a single specificity were employed.
Further, real-time analysis of the assay's data was not possible.
The large volume of data typically generated during flow cytometric multiple analyte assays, combined with the limited capabilities of prior techniques to collect, sort and analyze such data have provided significant obstacles in achieving a satisfactory multiplexed assay.
The computing methods used in prior art flow cytometric analyses have generally been insufficient and unsuited for accurately and timely analyzing large volumes of data such as would be generated by multiplexed assays; particularly when more than two analytes (or properties of a single analyte) are to be simultaneously determined.

Method used


Image

  • Multiplexed analysis of clinical specimens apparatus and method
  • Multiplexed analysis of clinical specimens apparatus and method
  • Multiplexed analysis of clinical specimens apparatus and method

Examples


experimental example

[0119] Three different antigen-antibody pairs were used in a multiplex experiment demonstrating the ability to detect the presence or absence of several antibodies in a single sample. Antigens were coupled to latex microspheres via carbodiimide coupling, and the corresponding antibodies were fluorescently labeled with fluorescein isothiocyanate (green fluorescence—Fm). Each antigen was coupled to a unique microsphere. Baseline data for the fluorescent antibodies and antigen-microsphere complexes used in this experiment are shown in FIG. 13a. Baseline data for the three bead subsets of FIG. 13a are given in FIG. 13b.

[0120] The absence of fluorescence (C2 and C3) immediately discriminates the clear beads (subset 50) from beads in the other two subsets. Subsets 45 and 50 were further discriminated by side light scatter (C1) and red fluorescence (C3). Linear discriminant functions based on these observations and created as described in Section 6.2(c); are shown in FIG. 13c. Accepting o...


PUM

PropertyMeasurementUnit
wavelengthsaaaaaaaaaa
temperatureaaaaaaaaaa

Abstract

A method for the multiplexed diagnostic and genetic analysis of enzymes, DNA fragments, antibodies, and other biomolecules comprises the steps of constructing an appropriately labeled beadset, exposing the beadset to a clinical sample, and analyzing the combined sample / beadset by flow cytometry. Flow cytometric measurements are used to classify, in real-time, beads within an exposed beadset and textual explanations, based on the accumulated data obtained during real-time analysis, are generated for the user. The inventive technology enables the simultaneous, and automated, detection and interpretation of multiple biomolecules or DNA sequences in real-time while also reducing the cost of performing diagnostic and genetic assays.

Description

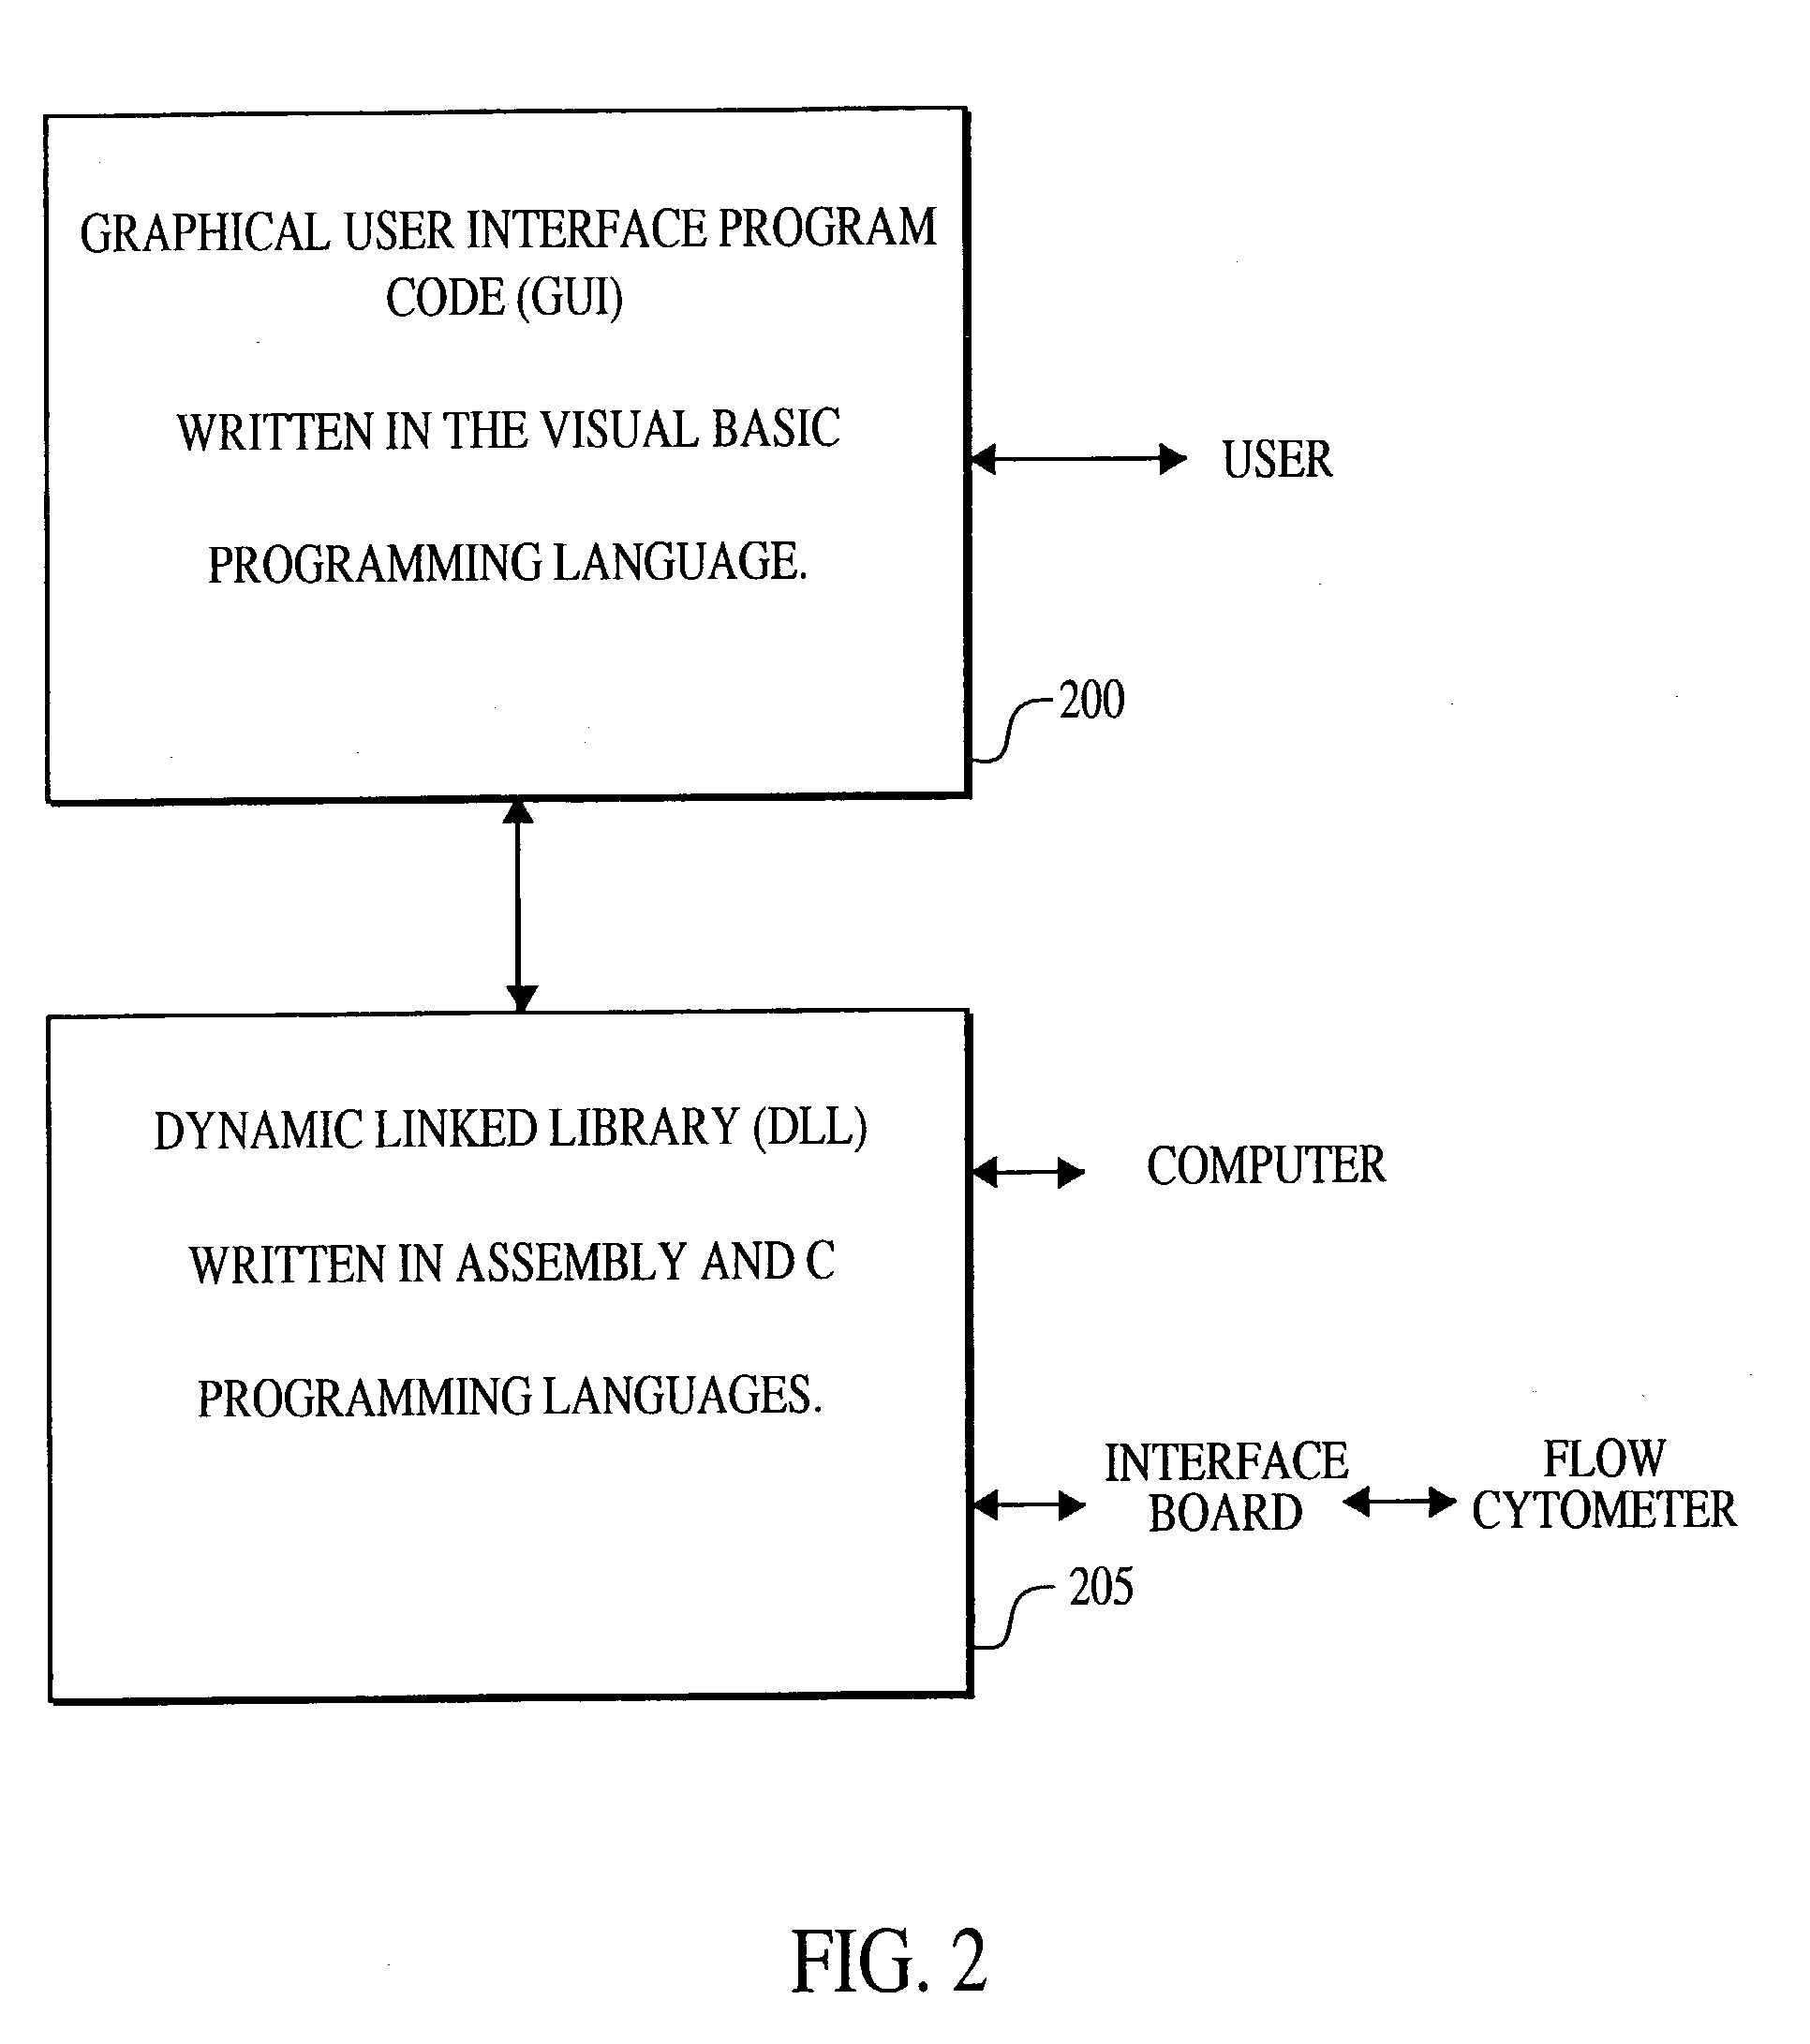
1. REFERENCES [0001] Commonly owned, and co-pending patent application, entitled “Methods and Compositions for Flow Cytometric Determination of DNA Sequences by R. Jerrold Fulton, filed on 11 Oct. 1995, is hereby incorporated in its entirety by reference. [0002] Microfiche appendix A contains a listing of selected Visual Basic and C programming source code in accordance with the inventive multiplexed assay method. Microfiche appendix A, comprising 1 sheet having a total of 58 frames, contains material which is subject to copyright protection. The copyright owner has no objection to the facsimile reproduction by anyone of the patent disclosure, as it appears in the Patent and Trademark Office patent files or records, but otherwise reserves all copyright rights whatsoever. 2. FIELD OF THE INVENTION [0003] The invention relates generally to laboratory diagnostic and genetic analysis and, more particularly, to a flow cytometric method for the simultaneous and multiplexed diagnostic and ...

Claims


Application Information

Patent Timeline
Patent Type & Authority Applications(United States)
IPC IPC(8): G01N15/10G01N15/14G01N33/50G01N33/543
CPCG01N15/1012G01N15/1456G01N33/5094G01N33/54313Y10S435/973G01N2015/1477G01N2015/1486G01N2015/1488G01N2015/149G01N2015/1018
Inventor CHANDLER, VAN S.FULTON, R. JERROLDCHANDLER, MARK B.
Owner LUMINEX
Learn More