Method for high throughput transgene function analysis for agronomic traits in maize
- Summary
- Abstract
- Description
- Claims
- Application Information
AI Technical Summary
Benefits of technology
Problems solved by technology
Method used
Image
Examples
example 1
Assessing the Effect of a Transgene on Maximum Plant Biomass without the Use of a Non-Transgenic Control Group
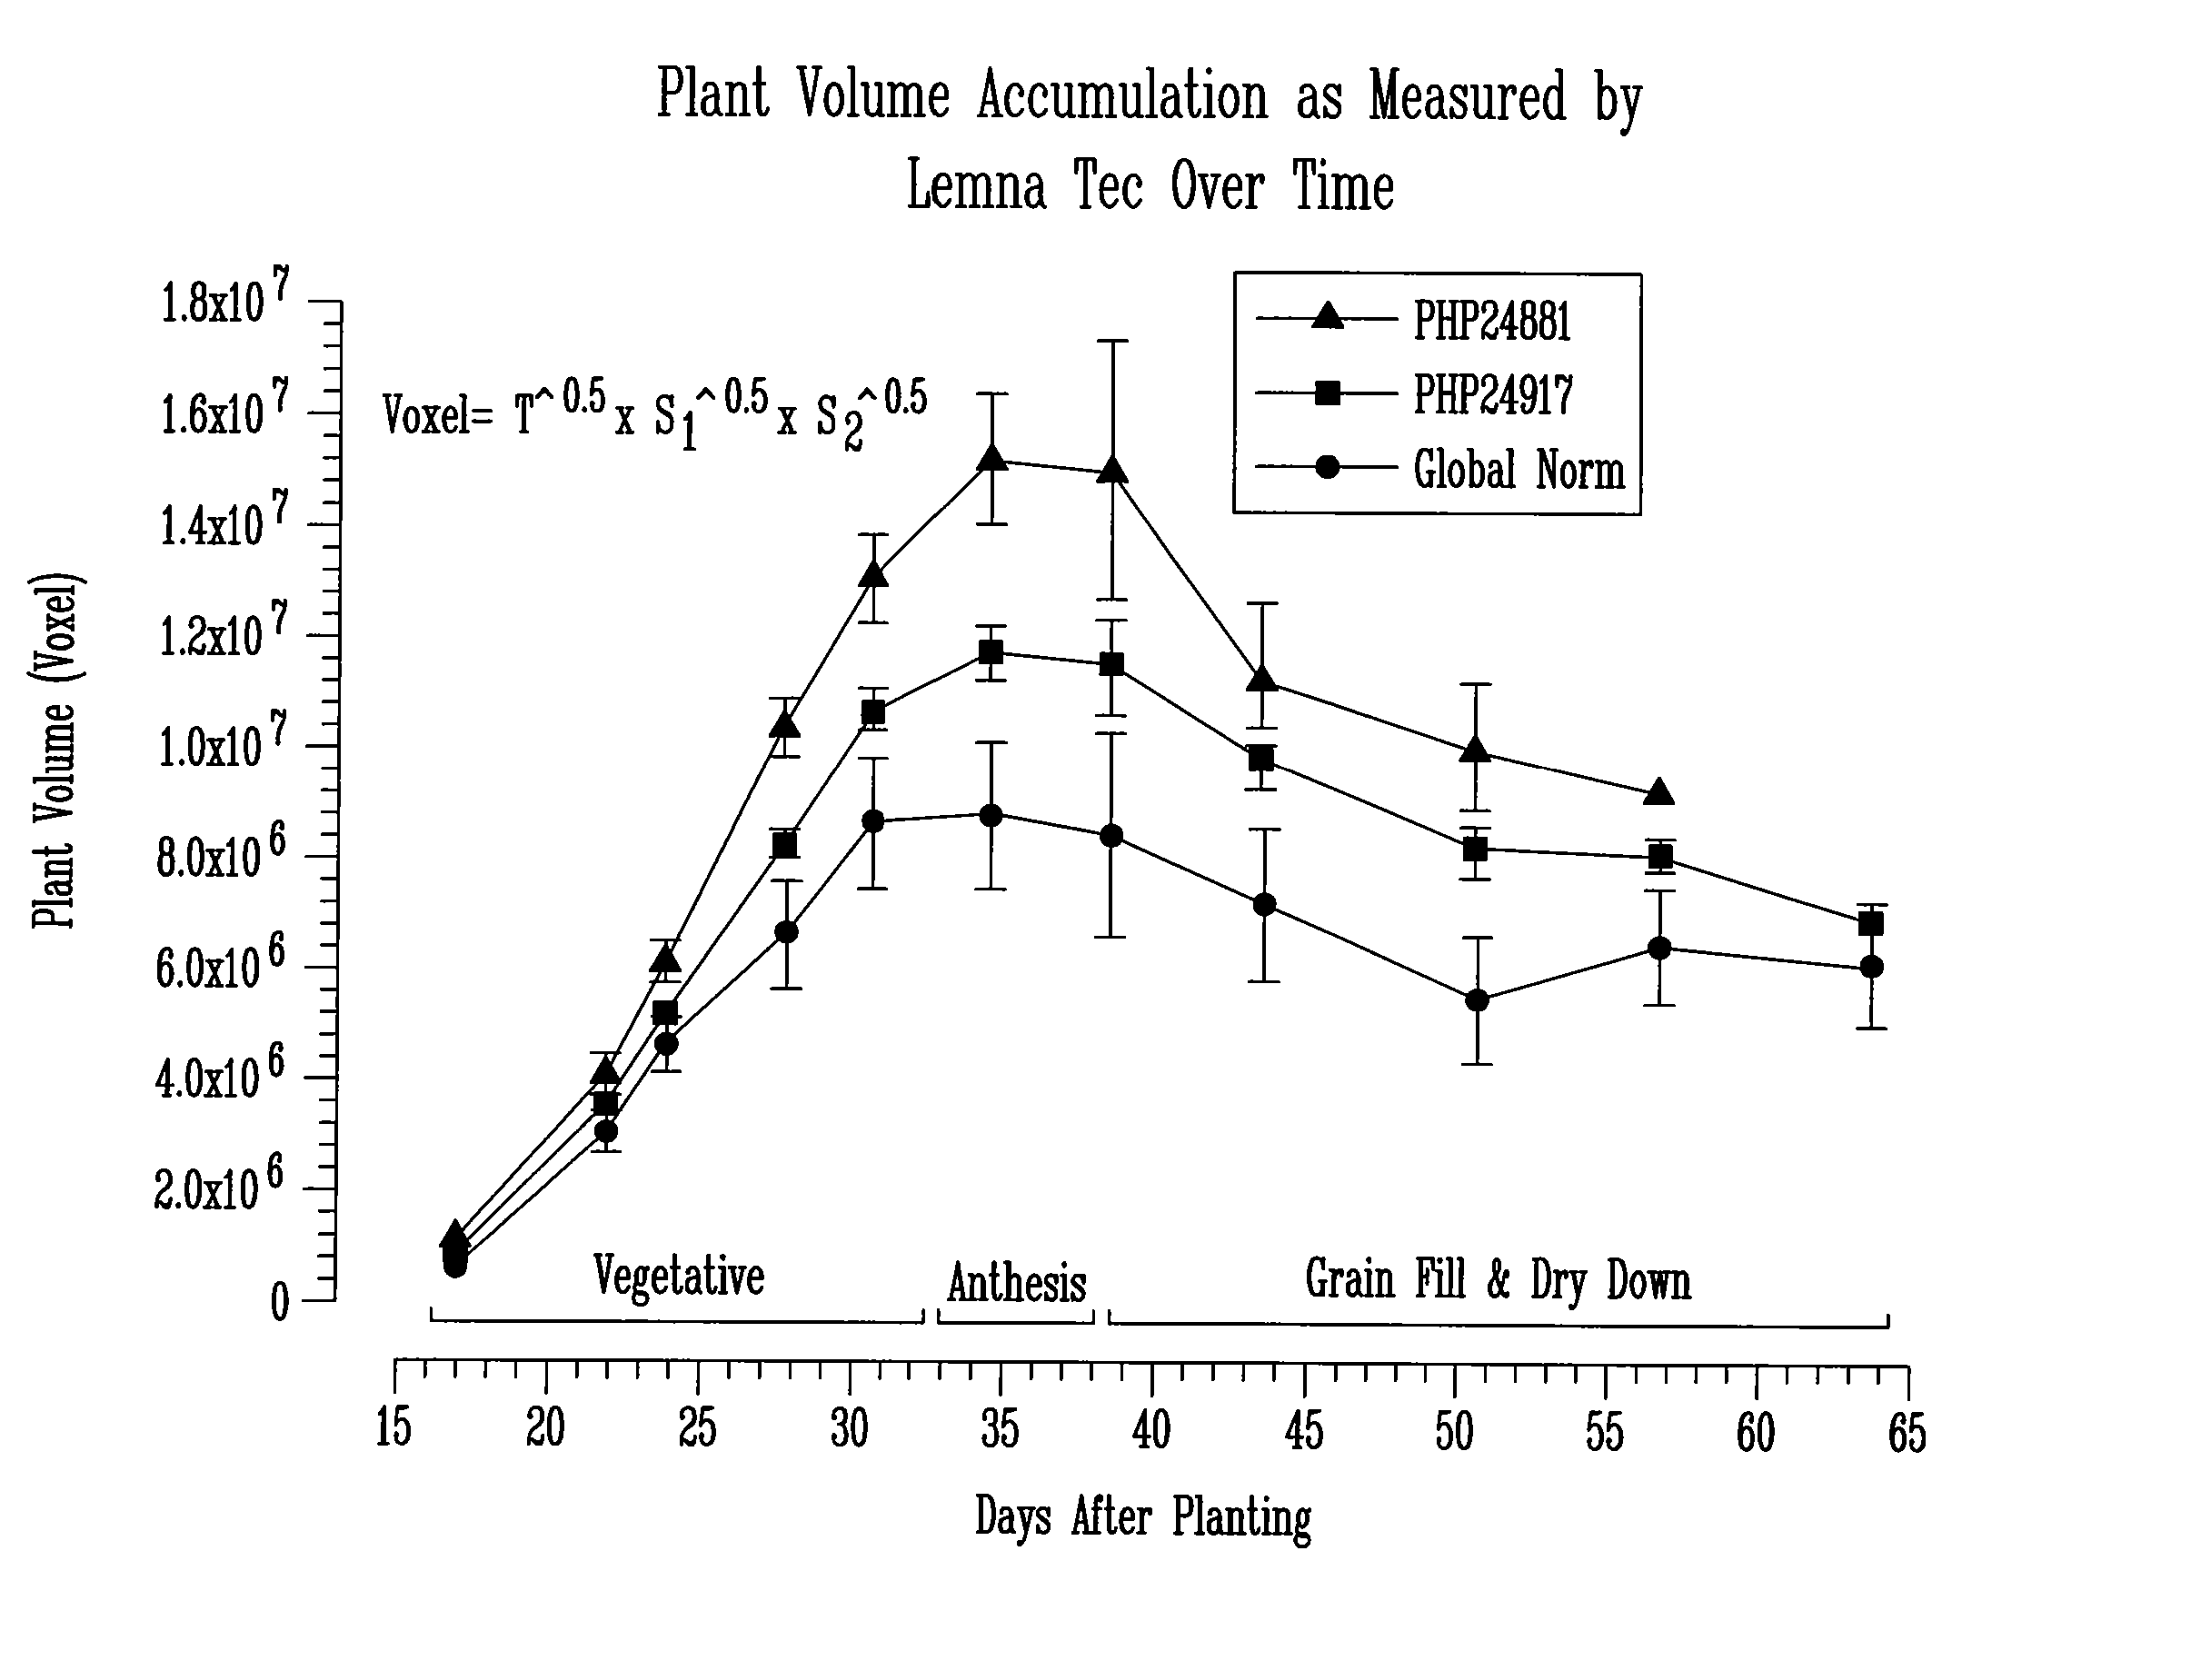
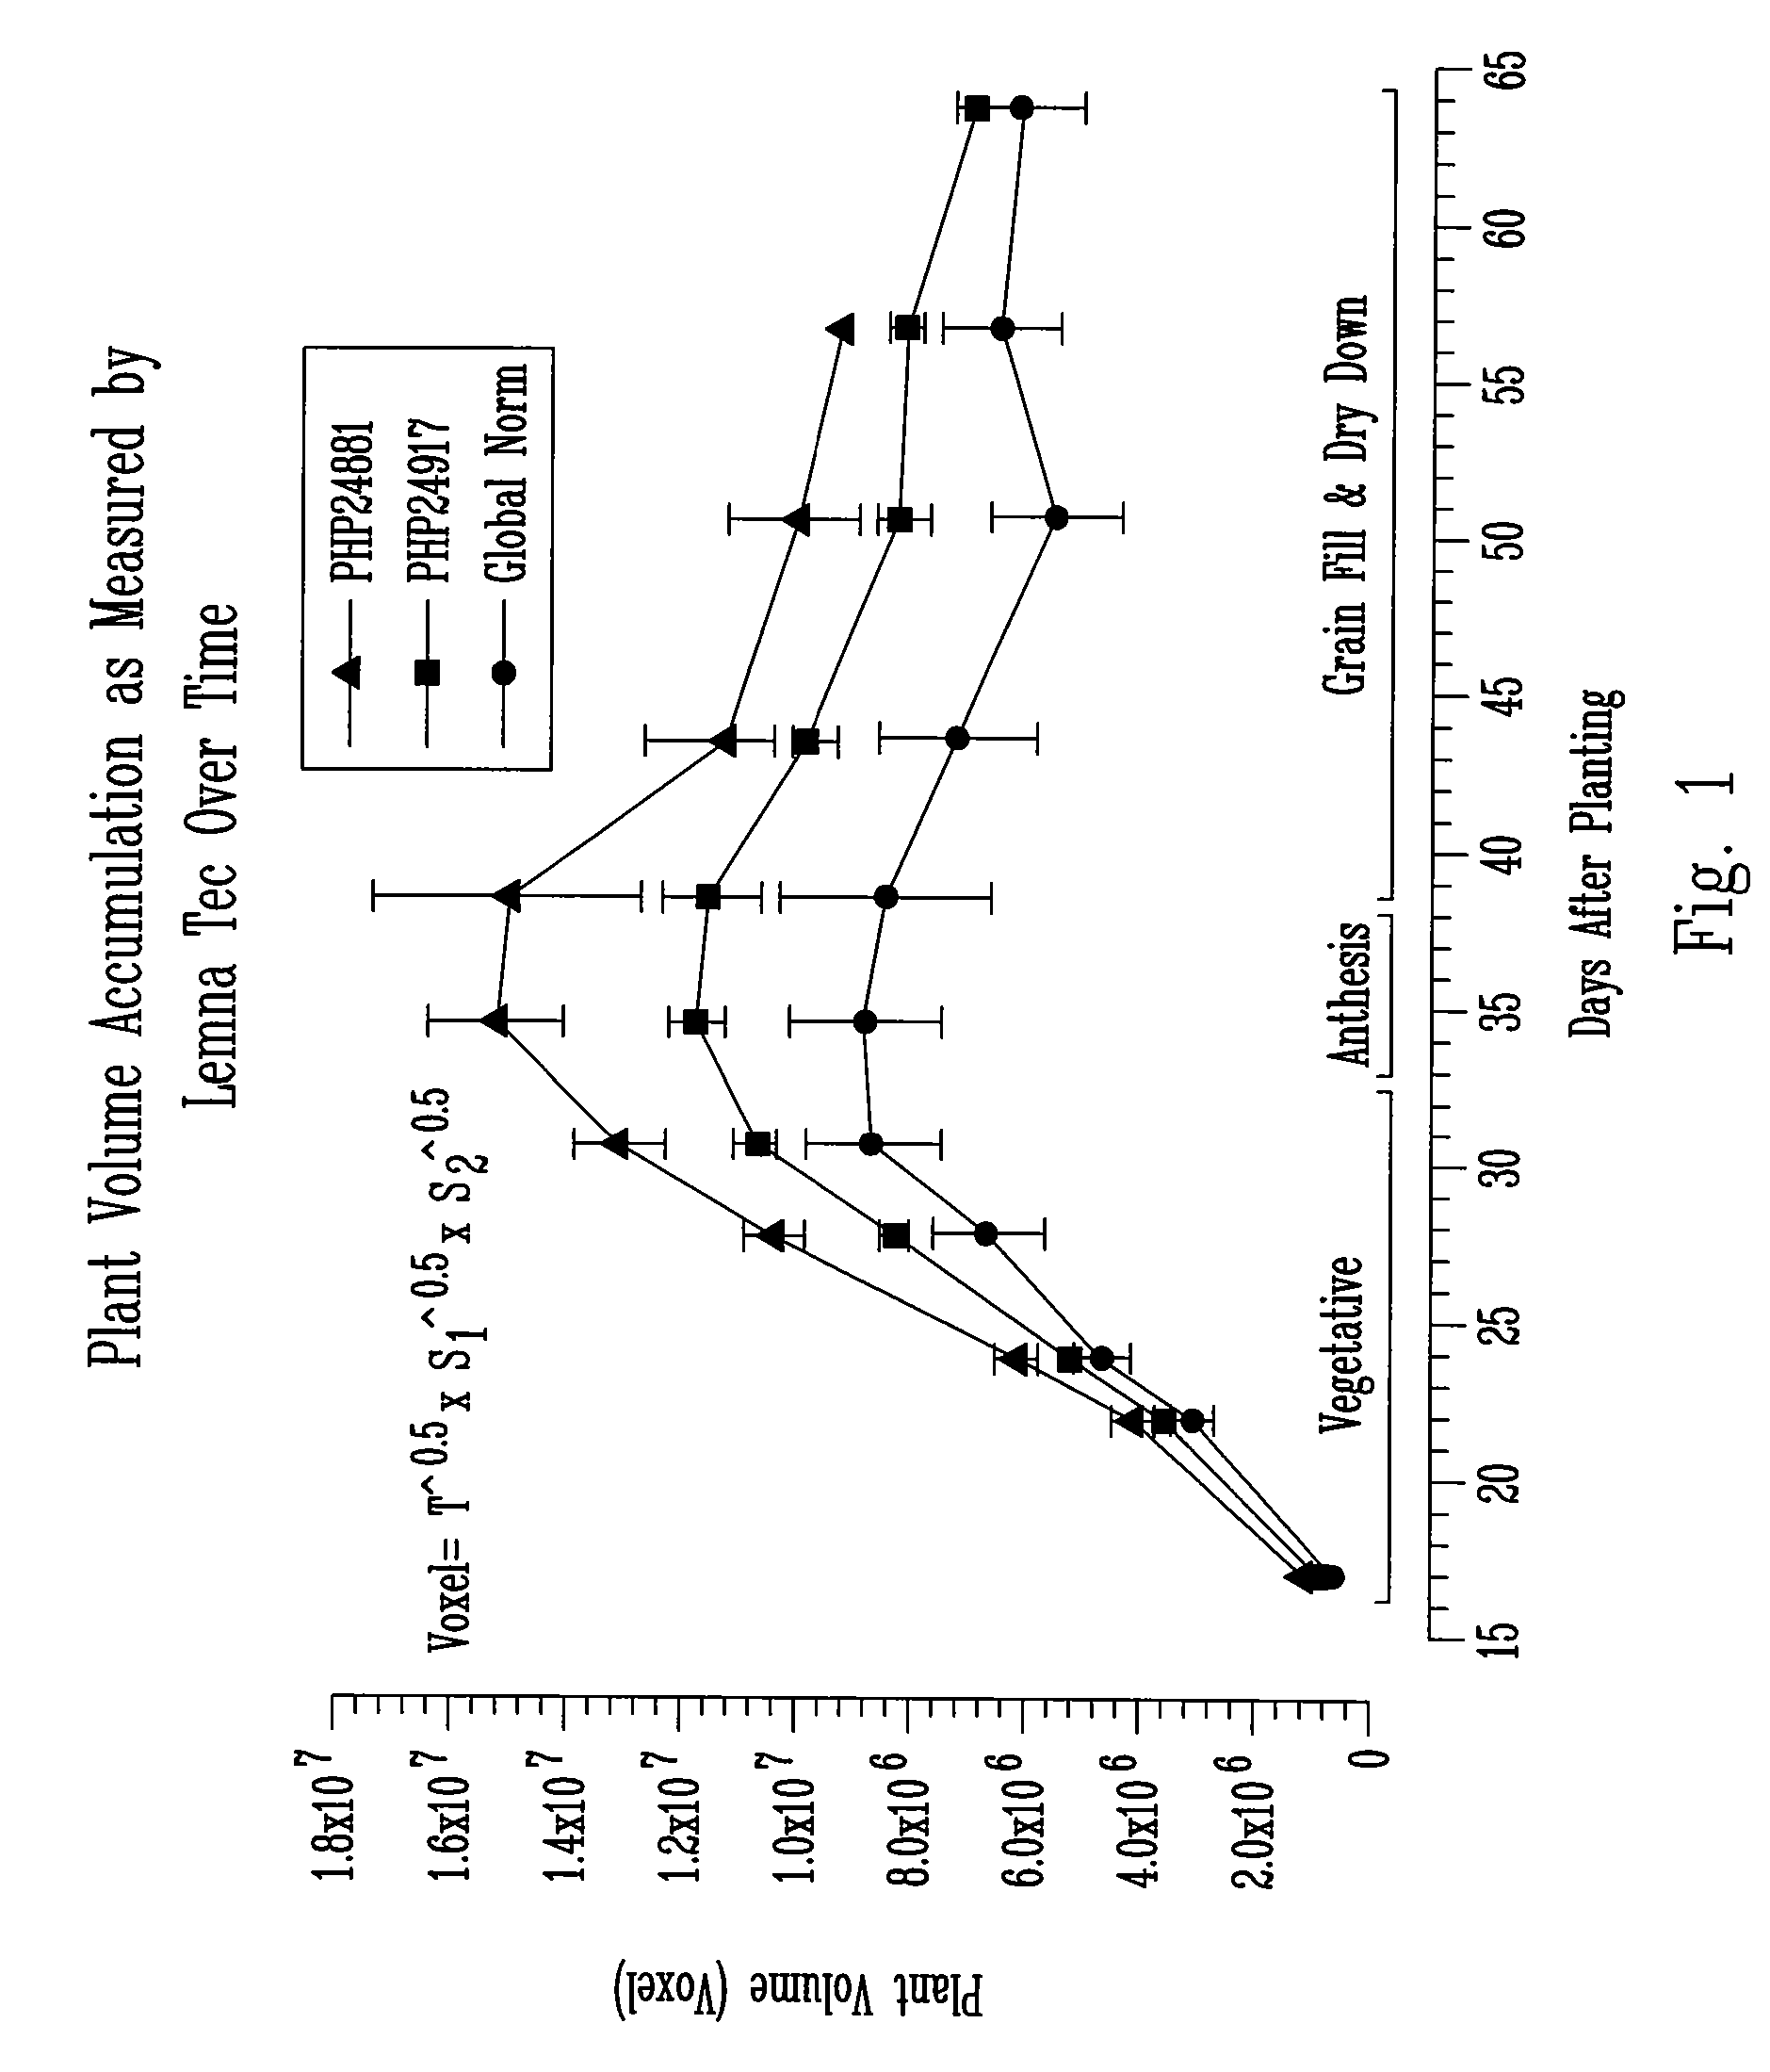
[0078] Yield in corn is commonly thought to be a function of a number of agronomic traits, including leaf angle, anthesis-silking interval (ASI), staygreen ability, early growth rate, and total biomass (plant volume). The present invention takes advantage of the fact that some of these traits are deployed (exhibited) early in a plant's life cycle. For example, maximum plant biomass is one determining factor for yield. Applicants determined plant volume in multiple replications using three-dimensional imaging technology to assess the effect of transgenes on corn yield.
[0079] Assessing Instrumental Variance
[0080] The instrumental variance of a LemnaTec Scanalyzer HTS LT-0001-2 was determined by analyzing the biomass of a single plant four times. The variability of the total voxel number from image to image was found to be about 2-3% of total plant volume. Thus, the precisio...
example 2
Assessing the Effect of a Transgene on Flowering Time Using a Control Group
[0090] A replicate group of 30 plants was scored (analyzed) for flowering time based on determination of date of anthesis using the statistical methods described above. Data was obtained for a block of 28 plants, consisting of T0 (first generation) plants from 16 different GOI constructs having either one or two transgenic events and four non-transformed, control plants. The date of anthesis was expressed as “days to shed”, that is, the number of experiment days that passed before anthesis was observed. For these purposes the experiment was considered initiated when seedlings were transferred to the greenhouse after acclimation of the T0 seedlings in soil. The mean and standard deviation of “days to shed” was calculated for the control plants (6.75 days and 0.5 days respectively) and used to establish a threshold value for “early flowering,” which was two standard deviations below the mean (Early Flowering T...
example 3
Quantitative Analysis of T1 Plants to Identify Transgenes that Confer Increased Biomass Accumulation
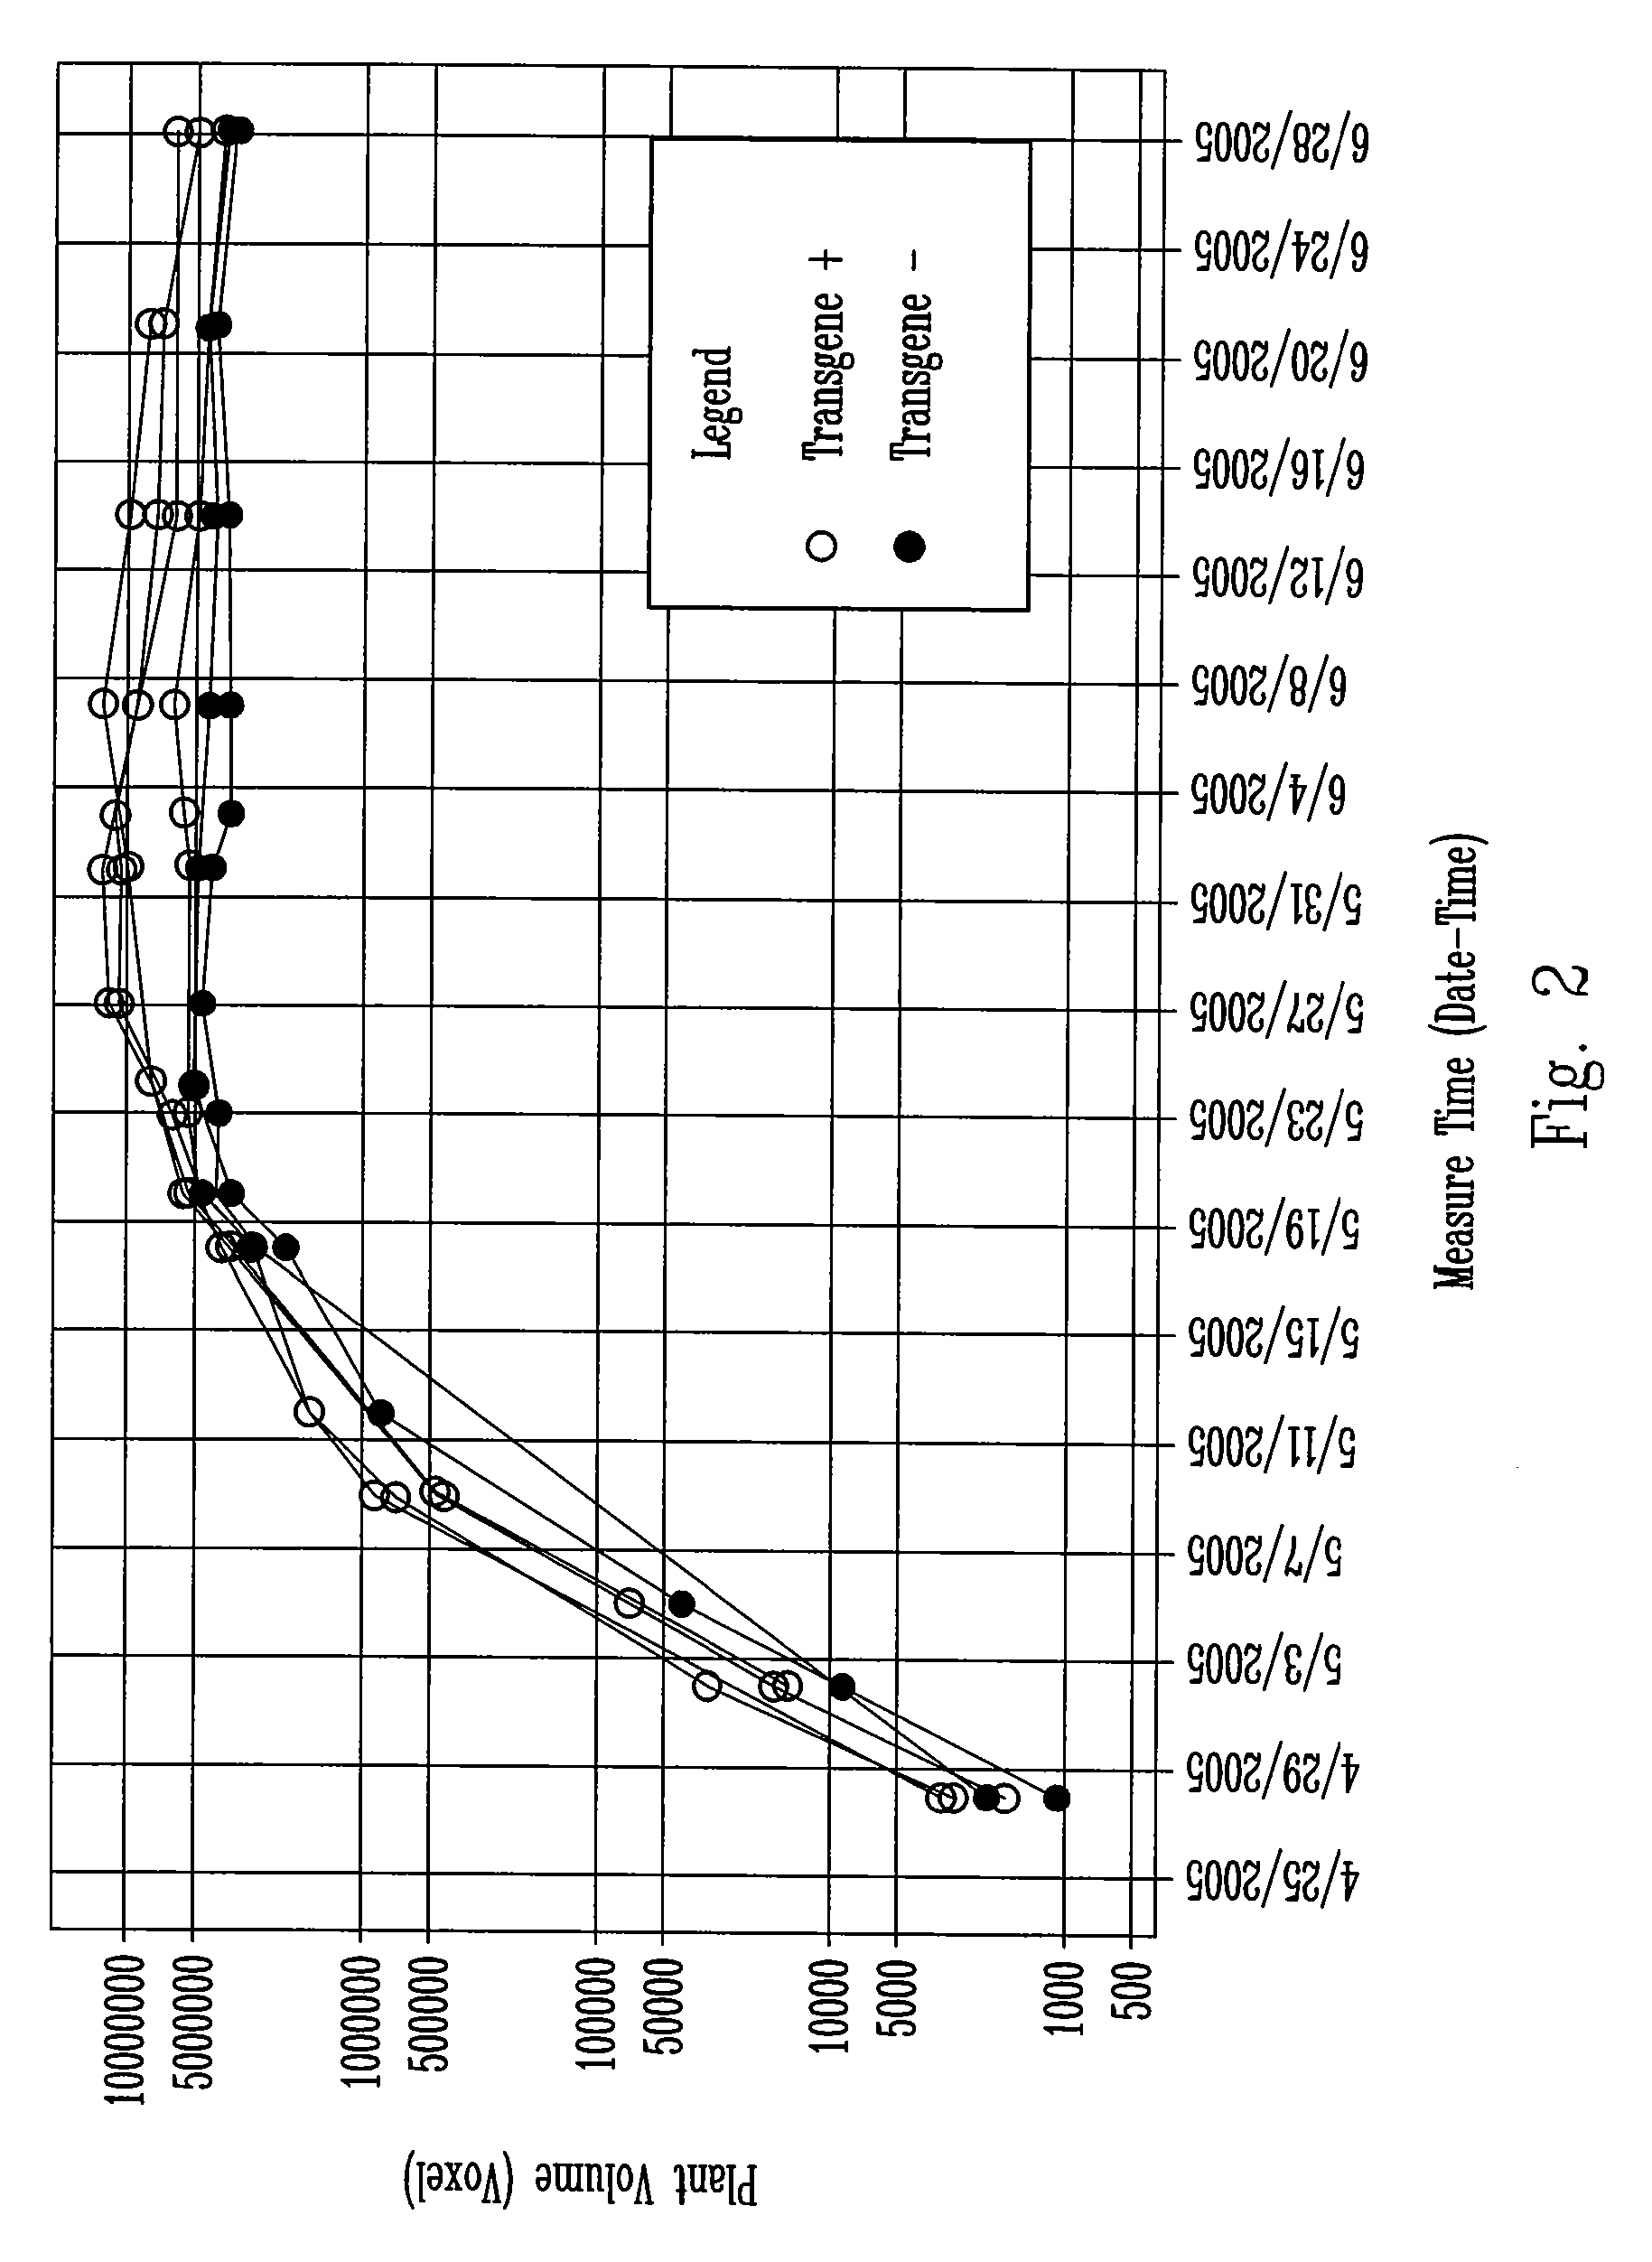
[0092] In order to achieve higher quantitative phenotypic resolution, T1 progeny of T0 plants can be obtained by pollinating the T0 plants with a recurrent parent (for example: Gaspe Flint mentioned above, or another desired corn variety, optimally a small stature rapid cycling variety). T0 plants obtained from construct PHP22760 were pollinated with GF-3, an inbred developed from Gaspe Bay Flint. T1 seeds from four transgenic events (Table 5) were sown and assayed for the presence of the transgene. From each transgenic event, T1 plants positive for transgene carrying and negative for null segregants were identified by scoring for the presence of the marker gene. Because the T0 plants (hemizygous) were outcrossed, the transgene segregates 1:1 in the T1 progeny. Table 5 indicates the number of trait positive and null segregants obtained for each of the events evaluated.
TABLE 5Indivi...
PUM
| Property | Measurement | Unit |
|---|---|---|
| Fraction | aaaaa | aaaaa |
| Mass | aaaaa | aaaaa |
| Molar density | aaaaa | aaaaa |
Abstract
Description
Claims
Application Information
 - R&D
- Intellectual Property
- Life Sciences
- Materials
- Tech Scout
- Unparalleled Data Quality
- Higher Quality Content
- 60% Fewer Hallucinations
Browse by: Latest US Patents, China's latest patents, Technical Efficacy Thesaurus, Application Domain, Technology Topic, Popular Technical Reports.
© 2025 PatSnap. All rights reserved.Legal|Privacy policy|Modern Slavery Act Transparency Statement|Sitemap|About US| Contact US: help@patsnap.com


