Earthquake resistant earth retention system using geocells

Inactive Publication Date: 2009-06-04
GEOTECH TECHNOLOGIES LTD
40 Cites 22 Cited by

AI-Extracted Technical Summary

Problems solved by technology

In addition, stress transfer in geogrids/geotextiles is much more sensitive to the infill type and installation quality.
However, relative to other polymeric materials used in soil reinforcement (e.g., polyester, polyvinyl alcohol), polyethylene has low stiffness, low strength, high creep, and high coefficient of thermal expansion.
Dense soil is rather strong under compression, but has little to no strength under tension.
However, at larger strains, it will quickly reach lower shear strength than its peak as it undergoes through a strain-softening phenomenon.
In fact, using a stiff cell wall to confine the infill would create a situation where failure of the confined infill will occur only when the solid particles crush or the cell walls undergo large deformation or rupture.
However, trying to drive a stake into the grou...

Method used

[0067]The capping geocell layer enhances the stability of the retaining wall. It was discovered that a long capping geocell layer inhibits crack formation and slip surface formation in the earth beneath it. This increases the stability of the retaining wall by inhibiting the formation of cracks or slip surfaces near the face of the retaining wall. It also reduces the lateral earth pressure acting on the face of the wall. In particular, if cracks or slip surfaces do form, they generally form behind the capping geocell layer and the cracks or slip surfaces run into the ground, rather than into the face of the retaining wall. This reduces the p...

Benefits of technology

[0012]Accordingly, it would be beneficial to provide a structure that uses the compressive strength of soil...

Abstract

A retaining wall comprises a plurality of layers made from geocells. The retaining wall has a capping layer at the top of the wall, wherein the ratio of the length of the capping layer to the height of the retaining wall is at least 0.8. The retaining wall also has at least one stacking layer and may further comprise a reinforcing layer made of geogrids or, preferably, geocells. The reinforcing geocells have a height that is less than the height of the capping layer geocell.

Application Domain

Artificial islandsExcavations +6

Technology Topic

Earthquake resistantEngineering +3

Image

  • Earthquake resistant earth retention system using geocells
  • Earthquake resistant earth retention system using geocells
  • Earthquake resistant earth retention system using geocells

Examples

  • Experimental program(4)

Example

Example 1
[0079]Two compositions suitable for use in the geocells were made and compared to high density polyethylene (HDPE).
[0080]Composition A: PE alloy with improved creep resistance
[0081]5 kg of HDPE grafted with 1% maleic anhydride was melt kneaded with 5 kg of dry polyamide 6 resin in a co-rotating twin screw extruder having L/D of 48, at 280° C., 150 RPM, to provide a PE alloy. The alloy was melt kneaded by a single screw extruder at 260° C., through a flat die and calendars, to form an embossed strip having average thickness of 1.2 mm.
[0082]An HDPE strip having the same dimensions and a density of 0.941 g/cm3 was also extruded for comparison. The mechanical properties and creep properties were analyzed and are shown in Table 1.
TABLE 1 Description Alloy HDPE Tensile stress at yield, strain rate of 29 13 10 mm/min (MPa) Tensile modulus at 1% deformation, strain 1350 550 rate of 10 mm/min (MPa) Deformation when loaded under 50% of stress 8 300 to yield, 500 hours at 23° C. (additional % of original dimension) Stress to rupture when loaded under 50% of 25 7 stress to yield, 500 hours at 23° C. (MPa)

Example

[0083]Composition B: PE composite with improved creep resistance
[0084]HDPE having a density of 0.941 g/cm3 was melt kneaded by a single screw extruder at 260° C. and extruded through a flat die, wherein glass fiber roving was fed to the melt, to provide a continuous fiber reinforced composite strip. The weight percentage of fibers was set to 15% of the strip weight. The melt was calendared to form an embossed strip having average thickness of 1.2 mm.
[0085]An HDPE strip having the same dimensions and a density of 0.941 g/cm3 was also extruded for comparison. The mechanical properties and creep properties were analyzed and are shown in Table 2.
TABLE 2 Description Composite HDPE Tensile stress at yield, strain rate of 22 13 10 mm/min (MPa) Tensile modulus at 1% deformation, strain 1100 550 rate of 10 mm/min (MPa) Deformation when loaded under 50% of stress 6 300 to yield, 500 hours at 23° C. (additional % of original dimension) Stress to rupture when loaded under 50% of 17 7 stress to yield, 500 hours at 23° C. (MPa)

Example

Example 2
[0086]Experiments were performed using a shake table at the Japan National Research Institute of Agricultural Engineering in Tsukuba City, Japan. The shake table was 6 meters by 4 meters and, at maximum payload, had a maximum horizontal/vertical acceleration of 1 g. A steel box 2 meters wide, 4 meters long, and 3 meters high was placed inside a larger box having transparent walls, then placed on the shake table. Various retaining walls were built inside the test box.
[0087]A fine, uniform sand, originally obtained from Tokachi Port in Hokkaido, was used as the backfill (the earthen material to be retained). The sand had a mean diameter of 0.27 millimeters, a uniformity coefficient of 2, a specific gravity of 2.668, and a fines content of 0.35%. The sand was compacted to a unit weight of 90% Proctor density. The sand had an average dry unit weight of 14.3 kN/m3. The internal angle of friction for the sand was measured and found to be 38°.
[0088]A foundation layer of 20 cm height was formed from the sand. The retaining walls were built on top of the foundation layer from blocks.
[0089]Several strain gauges, force transducers, accelerometers, and displacement transducers were used to measure various aspects of the reaction of the backfill and the retaining wall.
[0090]Gravel was used as infill in some of the tested retaining walls. The gravel was a standard Japanese commercial product, designated as M30, which had a mean diameter of 6 mm and a maximum grain size of 30 mm. The average unit weight of the gravel in the tests was 20.1 kN/m3. The gravel had an internal angle of friction that was not directly measured, but was likely greater than 45°.
[0091]The retaining walls were then subjected to a horizontal and/or vertical motion to simulate an earthquake. The 1995 Kobe, Japan earthquake was used as a baseline. In Kobe, the horizontal acceleration ranged up to 0.8 g and the vertical acceleration ranged up to 0.4 g.
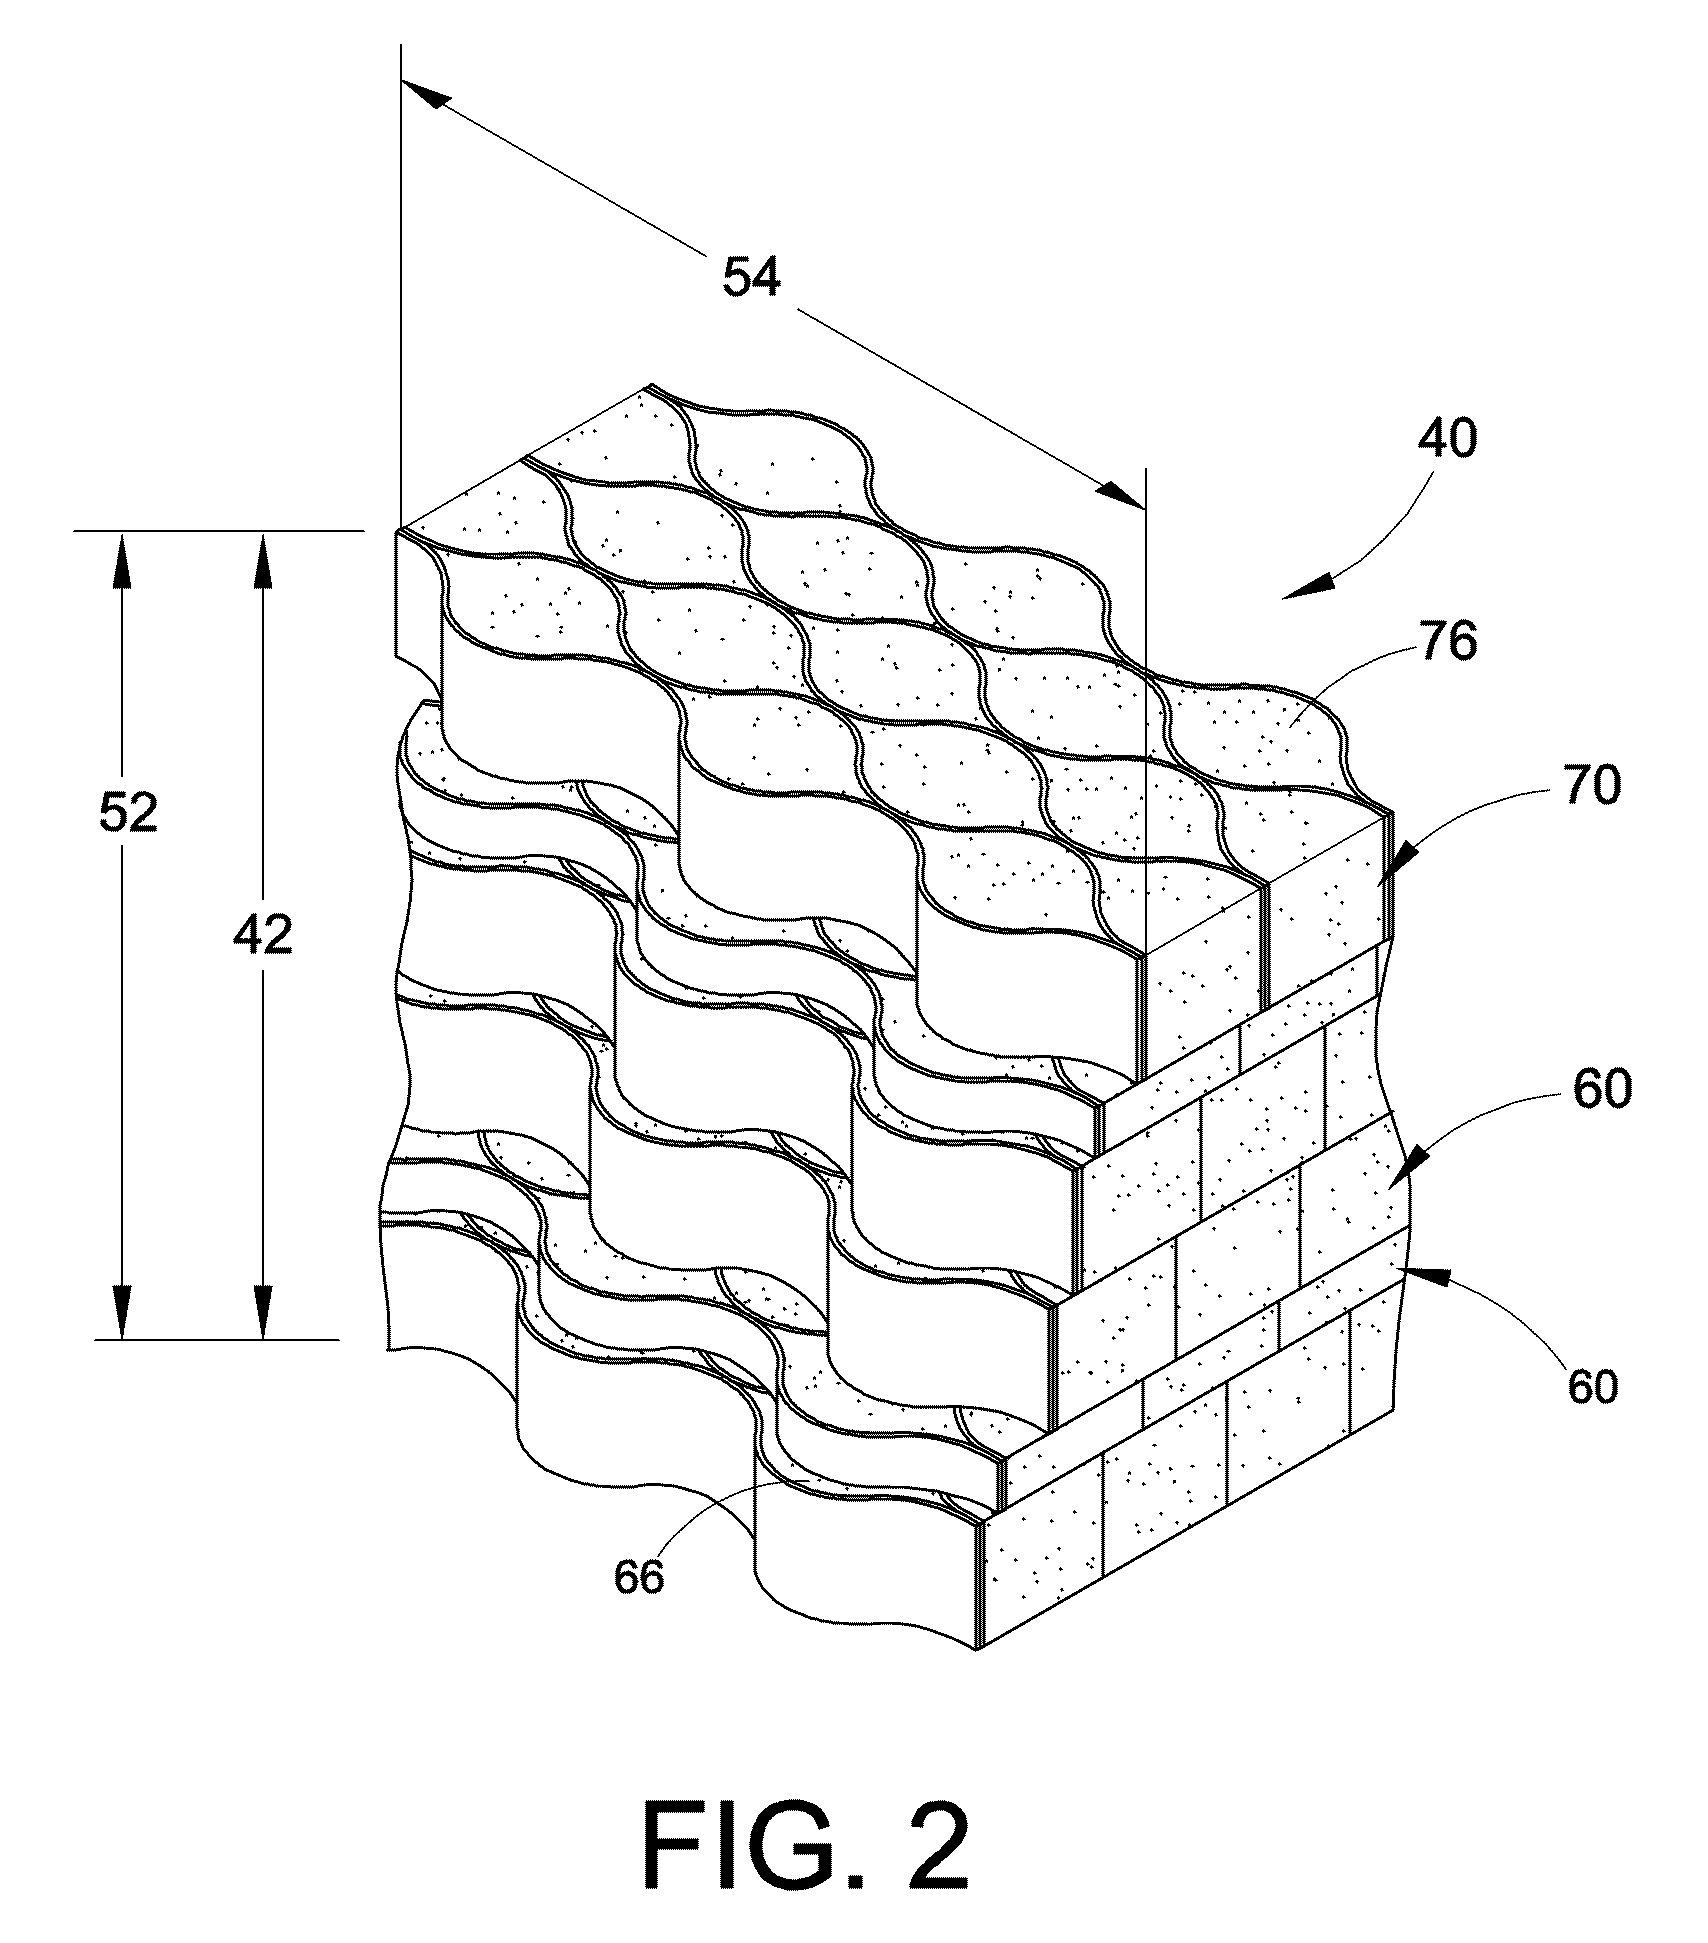
[0092]Five retaining walls according to the present disclosure were built. They were constructed from geocells formed by heat bonding or welding polypropylene sheets of thickness 2 mm together. When stretched, each cell was of dimensions approximately 20 cm by 20 cm; upon compaction, the dimensions increased to 21 cm by 21 cm. Nominal height was 20 cm. The geocells were textured to allow for a better interaction with the fill material and perforated to allow for horizontal drainage. Each layer was placed at an offset of 10 cm from the layer below it, for a slope of 63.4°.
[0093]White thin seams of sand were placed every about 40 cm within the backfill material. This white sand layer had negligible effects on the wall behavior. Upon completion of each test, the slope was carefully excavated to observe dislocations of these seams so that traces of slip surfaces could be identified.
Example Wall 1
[0094]Example Wall 1 was constructed as seen in FIG. 3. The total height of the wall was 2.8 meters (14 layers). The bottom stacking geocell layer had a length of seven cells, or about 1.47 meters. The stacking geocell layers tapered to a top stacking geocell layer having a length of three cells. The capping layer had a length of 12 cells, or about 2.52 meters. M30 gravel was used as the infill for all of the geocell layers.
Example Wall 2
[0095]Example Wall 2 was constructed as seen in FIG. 4. The total height of the wall was 2.8 meters (14 layers). All of the stacking geocell layers had a length of three cells. The capping layer had a length of 12 cells, or about 2.52 meters. M30 gravel was used as the infill for all of the geocell layers.
[0096]In addition, six geogrid layers were used. The first geogrid layer was placed 20 cm above the foundation layer and the rest were subsequently spaced apart by 40 cm. The geogrid layer was a polyester Fortrac® geogrid layer (made by Huesker) with apertures of 2 cm by 2 cm. The geogrid layer had a Tult of 35 kN/m at 10% elongation. The length of each geogrid layer was 180 cm (L/H=0.64), measured from the front end of the geocell layer. The geogrid layer thus extended 1.17 m beyond the geocell layer.
Example Wall 3
[0097]Example Wall 3 was constructed the same as Example Wall 1, except that sand was used as the infill for the geocell layers instead of M30 gravel.
Example Wall 4
[0098]Example Wall 4 was constructed as seen in FIG. 5. The total height of the wall was 2.8 meters (14 layers). The stacking geocell layers had a length of three cells. The capping layer had a length of 12 cells, or about 2.52 meters. In addition, three reinforcing geocell layers with a length of eight cells and a height of 20 cm were used. The first reinforcing geocell layer was located directly on the foundation layer, the second 80 cm above the first, and the third 60 cm above the second. Sand was used as the infill for all of the geocell layers.
Example Wall 5
[0099]Example Wall 5 was constructed as seen in FIG. 6. The total height of the wall was 2.7 meters. The stacking geocell layers had a length of three cells. The capping layer had a length of 12 cells, or about 2.52 meters. In addition, six reinforcing geocell layers with a length of nine cells and a height of 5 cm were used. Each reinforcing geocell layer was set back from the stacking geocell layer under it by 5 cm. M30 gravel was used as infill for the capping geocell layer and stacking geocell layers. For the reinforcing geocell layers, the front three cells (lying between stacking geocell layers) were infilled with M30 gravel and the rear six cells (extending into the backfill) were infilled with sand.
Shake Tests
[0100]The test walls were then subjected to two-dimensional shaking on the shake table.
[0101]For Example Walls 1 and 3, the excitation was applied in two stages. The target excitation was a horizontal peak ground acceleration (PGA) of 0.4 g and vertical PGA=0.2 g. Following a relaxation period of about one hour, the target excitation amplitude in the second stage was horizontal PGA=0.8 g and vertical PGA=04 g.
[0102]For Example Walls 2, 4 and 5, three loading stages were used. The target horizontal PGA was 0.4 g, 0.8 g, and 1.2 g, for the first, second, and third stages, respectively. The target vertical PGA was 0.2 g, 0.4 g, and 0.5 g for the first, second, and third stages, respectively. The relaxation period between each excitation in Tests 2, 4 and 5 was about one hour. However, due to limits in the actuators used to generate the accelerations, the actual accelerations applied were not exactly equal to the target values and were not completely uniform between all five Example Walls. Table 3 shows the applied PGA as recorded by accelerometers installed on the base of the table for each test and loading stage. The variations between Example Walls at each stage were not believed to be significant.
TABLE 3 Applied PGA Applied Peak Acceleration at Base of Shake Table Horizontal PGA at Each Vertical PGA at Each Example Loading Stage Loading Stage Wall 1 2 3 1 2 3 1 0.46 g 0.92 g — 0.21 g 0.42 g — 2 0.46 g 0.94 g 1.21 g 0.20 g 0.39 g 0.47 g 3 0.48 g 0.94 g — 0.20 g 0.39 g — 4 0.47 g 0.95 g 1.22 g 0.20 g 0.37 g 0.48 g 5 0.41 g 0.87 g 1.21 g 0.18 g 0.34 g 0.50 g
Results
[0103]Test Walls 1 and 3 are compared with each other because their only difference was the infill material (gravel for Wall 1 vs. sand for Wall 3).
[0104]FIG. 9 is a graph showing the amount of horizontal displacement versus height of the retaining wall for Walls 1 and 3. FIG. 10 is a graph showing the amount of crest settlement versus distance from the face of the retaining wall for Walls 1 and 3. FIG. 11 is a picture of the side of Example Wall 1 after shaking. FIG. 12 is a picture of the side of Example Wall 3 after shaking.
[0105]FIG. 13 is a graph showing the amount of horizontal displacement versus height of the retaining wall for Walls 2, 4, and 5. FIG. 14 is a graph showing the amount of crest settlement versus distance from the face of the retaining wall for Walls 2, 4, and 5. FIG. 15 is a picture of the side of Example Wall 2 after shaking. FIG. 16 is a picture of the side of Example Wall 4 after shaking. FIG. 17 is a picture of the side of Example Wall 5 after shaking.
[0106]Table 4 lists the maximum permanent displacements and maximum permanent crest settlements for the five walls.
TABLE 4 Face Maximum Permanent Crest Maximum Example Horizontal Permanent Wall Displacement (mm) Settlement (mm) 1 31 27 3 47 40 2 95 115 4 150 150 5 95 85
Discussion of Example Walls 1 and 3
[0107]Example Wall 1 performed better than Example Wall 3. The face of Wall 1 had a maximum permanent displacement of less than 31 mm and a crest maximum permanent settlement of less than 27 mm. In contrast, these values for Wall 3 were 47 mm and 40 mm, respectively.
[0108]Comparing FIGS. 11 and 12, Wall 1 had no fully developed slip surfaces, whereas a slip surface was present in Example Wall 3. This appeared to represent a translational movement that terminated at about 40 cm above the foundation layer. The slip surface was not associated with a catastrophic failure; a wall supporting a soil wedge defined by the slip surface is considered operational.

PUM

no PUM

Description & Claims & Application Information

We can also present the details of the Description, Claims and Application information to help users get a comprehensive understanding of the technical details of the patent, such as background art, summary of invention, brief description of drawings, description of embodiments, and other original content. On the other hand, users can also determine the specific scope of protection of the technology through the list of claims; as well as understand the changes in the life cycle of the technology with the presentation of the patent timeline. Login to view more.
Why Eureka
Try Eureka